Bayesian Optimization for Antibody Stability-Viscosity Tradeoffs: A Next-Gen Strategy for Biotherapeutics Development
This article provides a comprehensive guide to implementing Bayesian optimization (BO) for navigating the critical stability-viscosity tradeoff in monoclonal antibody (mAb) therapeutic development.
Bayesian Optimization for Antibody Stability-Viscosity Tradeoffs: A Next-Gen Strategy for Biotherapeutics Development
Abstract
This article provides a comprehensive guide to implementing Bayesian optimization (BO) for navigating the critical stability-viscosity tradeoff in monoclonal antibody (mAb) therapeutic development. We begin by exploring the foundational biophysical principles and business-critical challenges of high-concentration formulation. We then detail the methodological framework of BO, from constructing sequence-function landscapes to designing adaptive experimental campaigns. Practical guidance is provided for troubleshooting common pitfalls and optimizing model performance. Finally, we validate the approach through comparative analysis with traditional methods like Design of Experiments (DoE) and High-Throughput Screening (HTS), showcasing real-world case studies and accelerated timelines. This guide is essential for researchers and drug development professionals seeking to rationally engineer antibodies with optimal developability profiles.
Understanding the Antibody Stability-Viscosity Dilemma: The Foundational Challenge in Biologics Development
Why the Stability-Viscosity Tradeoff is a Critical Bottleneck in mAb Development
Technical Support Center: Troubleshooting mAb Formulation & Developability
FAQs & Troubleshooting Guides
Q1: During high-concentration formulation, our lead mAb candidate shows a sudden, nonlinear increase in viscosity (>50 cP at 150 mg/mL). What are the primary causal factors and immediate investigative steps?
A: This is a classic manifestation of the stability-viscosity tradeoff. Primary factors include:
- Net attractive protein-protein interactions (PPIs): Driven by patchy hydrophobic or charged surfaces.
- Electrostatic self-association: Especially at low ionic strength.
- Flexible CDR loops or domains: Leading to transient, viscosity-enhancing interactions.
Immediate Protocol: Dynamic Viscosity & Interaction Parameter Analysis
- Prepare samples: Dialyze mAb into target formulation buffer (e.g., 20 mM Histidine-HCl, pH 6.0). Concentrate to 50, 100, and 150 mg/mL using a 30 kDa MWCO centrifugal concentrator.
- Measure viscosity: Use a micro-viscometer (e.g., ViscoStar) with a 100 µL sample at 25°C. Perform in triplicate.
- Determine the interaction parameter (kD): Using Dynamic Light Scattering (DLS). Run samples at 1, 10, and 50 mg/mL on a Zetasizer. Analyze the diffusion interaction parameter from the concentration dependence of the mutual diffusion coefficient (Dt).
- Interpret data: A strongly negative kD (< -8 mL/g) and a sharp, exponential rise in viscosity confirm net attractive PPIs as the root cause.
Q2: Our stability-optimized variant (from charge engineering) now shows unacceptable viscosity. How do we diagnose if the issue is charge-mediated versus hydrophobic clustering?
A: Perform a controlled salt perturbation assay. Experimental Protocol: Salt Perturbation Assay for PPI Typing
- Prepare buffer matrix: Create a series of 20 mM Histidine buffers, pH 6.0, with NaCl concentrations of 0, 50, 150, and 300 mM.
- Formulate mAb: Dialyze both the original and charge-engineered variant into each buffer. Concentrate to 100 mg/mL.
- Measure: Record viscosity (as above) and kD via DLS for each condition.
- Analyze:
- If added salt reduces viscosity and makes kD less negative, interactions are primarily electrostatic.
- If salt has minimal effect or increases viscosity, the dominant driver is likely hydrophobic or short-range attraction.
Q3: What are the critical in-silico and in-vitro assays to screen for viscosity issues early in candidate selection?
A: Implement a multi-parameter developability screen.
Table 1: Key Developability Assays for Stability-Viscosity Assessment
| Assay | Parameter Measured | Predictive Value for Viscosity | Target Range (Ideal) |
|---|---|---|---|
| Static Light Scattering (SLS) | Second Virial Coefficient (B22) | High: Measures overall PPI. | B22 > 0 (positive) |
| Dynamic Light Scattering (DLS) | Diffusion Interaction Parameter (kD) | High: Measures hydrodynamic interactions. | kD > -8 mL/g |
| Affinity-Capture Self-Interaction Nanoparticle Spectroscopy (AC-SINS) | Δλ max (plasmon wavelength shift) | Medium-High: Measures self-association at low conc. | Δλ max < 5 nm |
| Size-Exclusion Chromatography (SEC) | % High Molecular Weight (HMW) species | Medium: Measures irreversible aggregates. | HMW < 2% |
| Differential Scanning Calorimetry (DSC) | Tm of Fab and Fc domains | Medium-Low: Confers stability but not direct PPI. | Tm1 > 65°C |
Bayesian Optimization in mAb Developability
The stability-viscosity tradeoff presents a high-dimensional optimization problem perfect for a Bayesian optimization (BO) framework. BO can efficiently navigate the sequence and formulation space by building a probabilistic model to predict viscosity and stability based on features like net charge, hydrophobicity index, and patchiness.
Experimental Protocol: Setting Up a BO Loop for mAb Engineering
- Define Design Space: Identify mutable residues in CDR and framework regions.
- Define Objective Functions: Maximize Tm (from DSC) and minimize viscosity at 150 mg/mL.
- Initial Data Collection: Characterize 10-20 initial variants (wild-type and mutants) for both objectives.
- Train Surrogate Model: Use a Gaussian Process to model the relationship between sequence features and objectives.
- Acquisition & Iteration: Use an acquisition function (e.g., Expected Improvement) to select the next most informative variant to test experimentally.
- Iterate: Update the model with new data for 5-10 rounds to converge on an optimized variant.
Bayesian Optimization for mAb Design
The Scientist's Toolkit: Key Research Reagent Solutions
Table 2: Essential Materials for mAb Stability-Viscosity Research
| Item | Function & Application |
|---|---|
| Histidine-HCl Buffer (20 mM, pH 6.0) | Standard low-ionic-strength formulation buffer for assessing electrostatic PPIs. |
| Sucrose or Trehalose | Common stabilizers used to enhance conformational stability (raise Tm) and modulate viscosity. |
| Arginine Hydrochloride | A versatile excipient that can suppress aggregation but may increase or decrease viscosity based on concentration. |
| NaCl Solution (1-5 M stock) | For performing salt perturbation studies to diagnose interaction types. |
| 30 kDa Molecular Weight Cut-Off (MWCO) Centrifugal Concentrators | For buffer exchange and concentrating mAbs to high concentration (>100 mg/mL). |
| Micro-viscometer (e.g., ViscoStar) | Essential for accurately measuring low-volume, high-value mAb samples at high concentration. |
| Zetasizer or Similar DLS Instrument | For measuring kD, hydrodynamic radius (Rh), and particle size distribution. |
| Differential Scanning Calorimetry (DSC) Microcalorimeter | For determining the thermal melting temperature (Tm) of Fab and Fc domains. |
Root Cause of Stability-Viscosity Tradeoff
Troubleshooting Guides & FAQs
Q1: During formulation screening, my antibody shows unexpectedly high viscosity at low ionic strength, contrary to charge repulsion theory. What could be the cause?
A: This often indicates that hydrophobic interactions are dominating over electrostatic repulsion. High-concentration self-association can be driven by surface hydrophobicity patches, even when the net charge is high and repulsive. Troubleshooting steps:
- Measure hydrophobic interaction chromatography (HIC) retention time: A higher retention time confirms increased surface hydrophobicity.
- Perform cross-interaction chromatography (CIC): This assesses self-association propensity directly in conditions mimicking low ionic strength.
- Check for charge heterogeneity: Use imaged capillary isoelectric focusing (icIEF). A broad or asymmetric charge variant distribution can lead to localized attractive patches.
Q2: My Bayesian optimization model for viscosity prediction is not converging on an optimal formulation. The suggested experiments seem contradictory. How should I proceed?
A: This typically occurs when the model's acquisition function is exploring uncertain regions of the parameter space. Follow this protocol:
- Validate Input Data: Ensure all historical data on net charge (from capillary zone electrophoresis), hydrophobicity (from HIC), and viscosity (from microcapillary viscometry) are accurately measured and formatted.
- Inspect Parameter Ranges: The model may be suggesting experiments at the edges of your defined design space (e.g., very low pH and very high conductivity). Systematically constrain one parameter (e.g., fix pH at 6.0) for the next iteration to reduce complexity.
- Incorporate a Direct Self-Association Metric: Add Cross-Interaction Chromatography (CIC) retention time as a fourth input parameter. This provides a more direct correlate to viscosity than net charge or hydrophobicity alone.
Q3: How can I quickly differentiate whether viscosity is driven primarily by net charge or self-association propensity?
A: Perform a simple salt titration experiment and analyze the data in this table:
| Condition (NaCl Concentration) | Viscosity (cP) at 150 mg/mL | Interpretation |
|---|---|---|
| 0 mM | High (> 25 cP) | If viscosity is high at low salt, electrostatic attractions (from charge patches) or hydrophobic effects may dominate. |
| 50-100 mM | Decreasing | Screening of electrostatic interactions supports charge-driven self-association. |
| >150 mM | Plateau or Increases | Hydrophobic-driven self-association is likely, as salt enhances hydrophobic interactions. |
Protocol: Prepare the same antibody sample at 150 mg/mL in a histidine buffer at pH 6.0. Dialyze into identical buffers containing 0, 50, 100, and 150 mM NaCl. Measure viscosity using a microfluidic viscometer at 25°C.
Q4: My antibody has a favorable (negative) net charge at formulation pH and low hydrophobicity, yet shows high aggregation propensity in stability studies. What factor am I missing?
A: You are likely missing dynamic self-association propensity. Net charge and average hydrophobicity are static measures. Some antibodies undergo concentration-dependent reversible self-association that is not captured by standard assays.
- Solution: Use Static and Dynamic Light Scattering (SLS/DLS) to measure the interaction parameter (kD) and the second virial coefficient (B22). A negative kD/B22 indicates attractive interactions leading to self-association and aggregation risk.
- Experimental Protocol:
- Perform buffer exchange into the desired formulation using size-exclusion chromatography.
- Conduct DLS measurements across a concentration series (e.g., 1, 5, 10, 20 mg/mL) at 25°C.
- Plot the diffusion coefficient (Dm) vs. concentration. The slope is kD (negative slope = attraction).
- Use SLS data to calculate B22 via the Zimm plot method.
The Scientist's Toolkit: Research Reagent Solutions
| Item | Function in Analysis |
|---|---|
| Cation Exchange Chromatography (CEX) Resin (e.g., Capto SP ImpRes) | Measures net charge distribution and identifies basic/acidic charge variants. |
| Hydrophobic Interaction Chromatography (HIC) Resin (e.g., Capto Phenyl) | Quantifies surface hydrophobicity; higher retention time correlates with hydrophobicity. |
| Cross-Interaction Chromatography (CIC) Column | A column coupled with human IgG or Fc receptor to directly assess self-association propensity. |
| Imaged Capillary Isoelectric Focusing (icIEF) Assay Kit | Provides high-resolution analysis of net charge (pI) and charge heterogeneity. |
| Microfluidic Viscometer Chip (e.g., on a Viscosizer platform) | Enables viscosity measurement of precious, low-volume (µL) antibody samples at high concentration. |
| Dynamic Light Scattering (DLS) Plate Reader | Measures the interaction parameter (kD) to quantify colloidal stability and self-association. |
| Bayesian Optimization Software Package (e.g., in Python: Scikit-Optimize, BoTorch) | Algorithmically designs the next best experiment to optimize stability and minimize viscosity. |
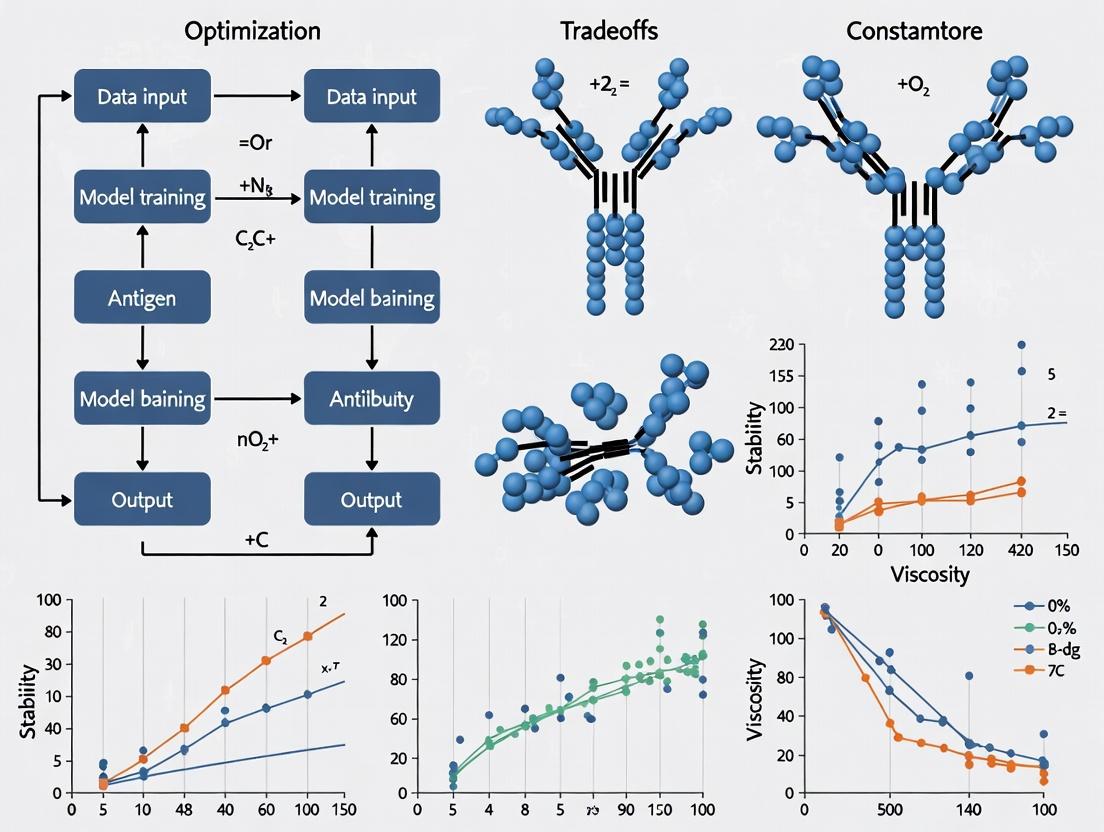
Experimental Workflow & Logical Diagrams
Bayesian Optimization Workflow for Viscosity
Biophysical Drivers Impact on Viscosity
Technical Support Center: Troubleshooting & FAQs
This technical support center provides guidance for researchers conducting experiments related to antibody formulation and stability, specifically within the framework of Bayesian optimization studies for managing the stability-viscosity trade-off.
FAQ 1: During my high-throughput screening for viscosity, my readings are inconsistent across replicate samples. What could be the cause?
- Answer: Inconsistent viscosity measurements in replicates often stem from poor temperature control or sample equilibration. High-concentration antibody solutions are highly sensitive to temperature fluctuations.
- Troubleshooting Protocol:
- Verify Instrument Calibration: Use standard viscosity oils at the expected measurement temperature.
- Ensure Thermal Equilibration: Place all samples and instrument plates in a thermally controlled environment (e.g., 25°C) for at least 30 minutes prior to measurement.
- Check for Sample Evaporation: Use sealing films for all plates during the equilibration step. For long analysis runs, consider humidity-controlled chambers.
- Inspect for Air Bubbles: Centrifuge plates at low speed (e.g., 500 x g for 2 minutes) before loading into the viscometer.
- Troubleshooting Protocol:
FAQ 2: My Bayesian optimization algorithm is converging on formulations with high viscosity despite setting a viscosity penalty. Why?
- Answer: This indicates a potential imbalance in your objective function or insufficient exploration of the formulation space. The algorithm may be over-prioritizing stability metrics (like aggregation percentage).
- Troubleshooting Protocol:
- Audit Objective Function: Recalculate the weighting of your composite objective. For example:
Objective = (w1 * Aggregation%) + (w2 * Viscosity) + (w3 * Opalescence). Ensurew2(viscosity weight) is sufficiently large. - Review Parameter Bounds: Check if your design space (e.g., pH range, excipient concentration limits) is too narrow, preventing discovery of low-viscosity regions.
- Introduce a Viscosity Constraint: Modify the algorithm to discard any candidate formulation with viscosity > a specified threshold (e.g., 20 cP) before assessing stability.
- Inspect Data Quality: Verify that the viscosity data fed into the model is accurate and has low noise (see FAQ 1).
- Audit Objective Function: Recalculate the weighting of your composite objective. For example:
- Troubleshooting Protocol:
FAQ 3: Scale-up from a 5mL Bayesian optimization batch to a 50mL stability batch resulted in a significant viscosity increase. What happened?
- Answer: This is a common scale-up issue related to mixing heterogeneity and shear history. Small-volume magnetic stirring does not replicate the shear forces of large-scale impeller mixing.
- Troubleshooting Protocol:
- Standardize Mixing: Implement a defined mixing protocol (RPM, time, impeller type) for all batches above a critical volume (e.g., >10mL).
- Characterize Shear Rate: Estimate the shear rate during mixing for both small and large scales. Aim to keep it consistent.
- Reformulate with Scale in Mind: If certain excipients (e.g., some surfactants) are shear-sensitive, the Bayesian model may need to be retrained with data generated under scaled-down, but representative, mixing conditions.
- Troubleshooting Protocol:
FAQ 4: How do I effectively incorporate "dosage" as a constraint in my Bayesian optimization for formulation?
- Answer: Dosage (mg/mL) is a direct input variable, not just a constraint. Its interaction with excipients is non-linear and critical for viscosity.
- Troubleshooting Protocol:
- Model Dosage Explicitly: Include antibody concentration (mg/mL) as a primary, continuous variable in your experimental design space (e.g., from 50 to 150 mg/mL).
- Define a Viscosity-Dosage Response Surface: Run a preliminary DOE (Design of Experiments) to map viscosity as a function of concentration and key excipients (e.g., Histidine, NaCl). Feed this data as a prior to the Bayesian optimizer.
- Set Business Logic Constraints: Program the algorithm to target the minimum dosage required for therapeutic efficacy (a fixed value) OR treat it as an optimizable variable with a cost function (higher concentration may reduce fill volume but increase viscosity risk).
- Troubleshooting Protocol:
Table 1: Impact of Formulation Parameters on Key Metrics
| Parameter | Typical Range | Effect on Viscosity (cP) | Effect on Stability (Aggregation %/month) | Estimated Cost Impact (Relative to Baseline) |
|---|---|---|---|---|
| Antibody Concentration | 50 - 150 mg/mL | Increase of 2-10x across range | May increase by 0.1-0.5% at high conc. | High (increases CoGs proportionally) |
| pH | 5.5 - 6.5 | U-shaped curve, min ~pH 6.0 | Can increase sharply at extremes | Low |
| Histidine (Buffer) | 10 - 50 mM | Mild decrease with increase | Minimal effect | Very Low |
| Sodium Chloride | 0 - 150 mM | Can sharply increase above 50mM | May reduce colloidal stability | Low |
| Sucrose (Stabilizer) | 5 - 10% w/v | Slight increase | Can reduce aggregation by ~0.2% | Low |
| Surfactant (PS80) | 0.01 - 0.1% w/v | Negligible effect | Critical for surface protection | Medium |
Table 2: Timeline Delays Due to Formulation Challenges
| Challenge | Typical Delay | Root Cause | Mitigation Strategy |
|---|---|---|---|
| High Viscosity (>20 cP) at target dose | 3-6 months | Requires reformulation and new stability studies | Implement Bayesian optimization early in development. |
| Unstable lead formulation (aggregation) | 6-12 months | Requires identification of new stabilizers and long-term stability studies | Use accelerated stability screening (e.g., CE-SDS, SEC-HPLC after stress). |
| Failed tech transfer to CMO | 1-3 months | Non-robust formulation, mixing sensitivity | Include scale-down shear models in initial screening. |
Experimental Protocols
Protocol 1: High-Throughput Viscosity Screening for Bayesian Optimization Input
- Objective: Generate reliable viscosity data for Bayesian model training.
- Materials: See "Scientist's Toolkit" below.
- Method:
- Prepare formulation candidates in a 96-deep well plate using a liquid handler.
- Seal plate and equilibrate at 25.0 ± 0.1°C for 30 minutes in a thermal chamber.
- Centrifuge plate at 500 x g for 2 minutes to remove bubbles.
- Using a micro-viscometer (e.g., with capillary or rotational probe), measure kinematic viscosity. Convert to dynamic viscosity using measured density.
- Perform each measurement in triplicate, reporting the mean and standard deviation.
Protocol 2: Accelerated Stability Assessment for Objective Function Calculation
- Objective: Quantify aggregation after thermal stress to predict long-term stability.
- Method:
- Aliquot 100 µL of each formulated candidate into a PCR tube.
- Subject samples to controlled thermal stress (e.g., 40°C for 4 weeks). Include a control stored at 2-8°C.
- At weekly intervals, analyze samples by Size-Exclusion High-Performance Liquid Chromatography (SEC-HPLC).
- Calculate percent aggregation as:
(Area of aggregate peaks / Total peak area) * 100. - Use the aggregation rate (change % per week) as a key input for the stability score in the Bayesian objective function.
Visualizations
Title: Bayesian Optimization Workflow for Formulation
Title: Formulation Challenges Drive Business Outcomes
The Scientist's Toolkit: Research Reagent Solutions
| Item | Function in Formulation Research |
|---|---|
| Histidine-HCl Buffer | A common buffering system (pH 5.5-6.5) that provides minimal ion-specific viscosity effects. |
| Trehalose / Sucrose | Stabilizing excipients that protect the antibody from aggregation via preferential exclusion. |
| Polysorbate 80 (PS80) | Surfactant that minimizes surface-induced aggregation at interfaces (e.g., air-liquid). |
| Arginine Hydrochloride | A versatile excipient that can suppress aggregation but may increase viscosity at high concentrations. |
| Sodium Chloride | Ionic strength modifier; can be used to screen for electrostatic viscosity drivers but often increases viscosity. |
| Micro Viscometer | Instrument for measuring viscosity of small-volume (μL) samples in high-throughput formats. |
| SEC-HPLC Columns | For quantifying soluble aggregates (dimers, HMWs) as a primary stability metric. |
| Dynamic Light Scattering (DLS) | Provides hydrodynamic radius and polydispersity, early indicators of instability. |
| 96-Well Deep Well Plates | Enable parallel formulation preparation for screening design spaces. |
| Automated Liquid Handler | Critical for accuracy and reproducibility when preparing multicomponent formulation matrices. |
Technical Support Center
Troubleshooting Guides & FAQs
Q1: My Bayesian optimization model is failing to converge or is stuck in a local minimum for the antibody viscosity-stability Pareto front. What are the primary checks?
A1: Perform this diagnostic sequence:
- Check Acquisition Function: Are you using Expected Improvement (EI) or Upper Confidence Bound (UCB)? For highly noisy viscosity measurements, switch to a noise-aware acquisition function like Predictive Entropy Search.
- Validate Kernel Choice: The Matérn 5/2 kernel is standard, but for a tradeoff problem, consider a multi-task kernel if you have correlated stability (e.g., Tm) and viscosity data.
- Scale Your Inputs: Ensure all antibody sequence descriptors (e.g., hydrophobicity index, charge) are normalized (e.g., z-score). Unscaled inputs can cripple kernel performance.
- Initial Design: You need a sufficient space-filling initial design (e.g., Latin Hypercube) of at least 5-10 points per dimension before the Bayesian loop begins.
Q2: High-throughput viscosity measurements are noisy and sometimes outlier-prone. How do I robustly integrate this data into the Bayesian optimization loop?
A2: Implement a pre-processing pipeline:
- Statistical Filtering: Define a moving median absolute deviation (MAD) threshold for replicate measurements. Discard points beyond 3×MAD.
- Model Noise Explicitly: Use a Gaussian Process model that includes a heteroscedastic noise term (
gpytorchorGPflowallow this). This informs the model which data points are less reliable. - Windowing: Focus the optimization on a recent window of iterations if experimental conditions drift over time.
Q3: When optimizing for both stability (high Tm) and low viscosity, how do I properly define the composite objective function for a single-target BO?
A3: Avoid ad-hoc weighted sums. Use a two-stage approach:
- Constraint Method: Set low viscosity as the primary objective to minimize. Define a constraint on stability (e.g., Tm > 70°C). Use a constrained BO package like
BoTorch. - Scalarization with Care: If you must scalarize, use a known transformation like the Logarithmic Desirability Function. It is less sensitive to scale differences than a linear sum.
Q4: The computational cost of updating the Gaussian Process model with every new batch of experimental data is becoming prohibitive. How can I speed this up?
A4: Employ approximate methods:
- Sparse Gaussian Processes: Use inducing points to approximate the full dataset. This reduces complexity from O(n³) to O(m²n), where m << n.
- Update the Posterior, Not the Full Model: For sequential batches, use Bayesian updating rules to refine the posterior distribution without re-computing from scratch, if the kernel hyperparameters are stable.
Key Experimental Protocols & Data
Protocol 1: High-Throughput Viscosity Measurement (Microfluidic Rheology)
Principle: Measure dynamic viscosity from the flow rate and pressure drop in a micro-capillary.
- Sample Prep: Dialyze antibody variants into a standard formulation buffer (e.g., Histidine-Sucrose). Concentrate to 50 mg/mL using a 30 kDa MWCO centrifugal filter.
- Load Chip: Use a commercial microfluidic viscometer chip (e.g., VROC initium). Load 100 µL of sample into the injection port.
- Run: Apply a controlled pressure gradient (5-20 psi). The software detects meniscus movement via embedded video and calculates viscosity from the Poiseuille flow equation.
- Replicates: Perform three independent loads per variant. Include a buffer control and a standard protein (e.g., BSA) for calibration.
Protocol 2: Stability Assessment via Differential Scanning Fluorimetry (DSF)
Principle: Monitor protein unfolding as a function of temperature using a fluorescent dye.
- Plate Setup: Dilute antibody samples to 0.2 mg/mL in formulation buffer. Mix with SYPRO Orange dye (final dilution 5X).
- Run: Use a real-time PCR instrument. Ramp temperature from 25°C to 95°C at 1°C/min, with fluorescence readings (ROX channel) at each step.
- Analysis: Fit the fluorescence derivative vs. temperature curve. The inflection point is the apparent melting temperature (Tm). Report the mean of 4 replicates.
Table 1: Optimization Efficiency for a 20-Variant Design Space
| Metric | Random Search (50 iterations) | Bayesian Optimization (50 iterations) |
|---|---|---|
| Best Viscosity (cP) @ 50 mg/mL | 12.5 ± 1.8 | 8.2 ± 0.5 |
| Tm of Best Candidate (°C) | 68.5 | 72.3 |
| Iterations to Reach <10 cP | 38 | 12 |
| Pareto Front Quality (Hypervolume) | 0.65 | 0.89 |
Table 2: Essential Research Reagent Solutions
| Reagent/Kit | Function | Key Consideration |
|---|---|---|
| His-Tag Purification Resin | High-throughput purification of expressed antibody fragments. | Use pre-packed 96-well plates for parallel processing. |
| SYPRO Orange Dye | Fluorescent dye for DSF stability screening. | Light-sensitive; aliquot to avoid freeze-thaw cycles. |
| VROC Microfluidic Chip | Enables viscosity measurement with <50 µL sample volume. | Calibrate with viscosity standards at the start of each run. |
| Stability Buffer Screen Kit | Pre-formulated buffer plates to assess excipient impact. | Contains 24 distinct buffers for initial formulation space mapping. |
| Charge Variant Analysis Column | Cation-exchange HPLC column to assess isoelectric point. | Net charge is a critical feature for viscosity prediction models. |
Visualizations
Title: Bayesian Optimization Workflow for Antibody Engineering
Title: Molecular Drivers of Viscosity-Stability Tradeoff
Bayesian Optimization Technical Support Center
Welcome to the Technical Support Center for Bayesian Optimization (BO) in antibody stability-viscosity trade-off research. This guide provides targeted troubleshooting and FAQs to assist researchers in implementing BO for efficient biologic drug development.
Frequently Asked Questions (FAQs)
Q1: In our study of antibody viscosity, the BO algorithm seems to get "stuck" exploring a narrow region of the sequence space too early. How can we encourage more global exploration?
- Answer: This is a common issue of over-exploitation. Adjust your acquisition function.
- For Expected Improvement (EI): Increase the parameter
xi(e.g., from 0.01 to 0.1 or 0.2). This adds more weight to exploring uncertain regions. - Switch to Upper Confidence Bound (UCB): Use a higher
kappaparameter (e.g., 3-5) for earlier iterations to prioritize exploration, then gradually reduce it. - Protocol: Run a short initial BO loop (10-20 iterations) with a high exploration parameter. Analyze the surrogate model's uncertainty. If uncertainty remains high in large, unexplored areas, manually add 1-2 design points in those regions before resuming the main BO loop.
- For Expected Improvement (EI): Increase the parameter
Q2: Our experimental measurements for antibody stability (e.g., Tm, ΔG) have significant inherent noise or variability. How do we configure BO to handle this?
- Answer: You must explicitly model the noise in your Gaussian Process (GP) surrogate.
- Methodology: When defining your GP prior, set a non-zero
alphaornoiseparameter. This tells the model to expect variance in the observations themselves. - Action: Use a heteroscedastic GP if noise level varies across the parameter space. Alternatively, use a robust acquisition function like Noisy Expected Improvement (NEI). Always run experimental replicates (n≥3) for initial design points to quantify baseline noise level, which informs the
alphasetting.
- Methodology: When defining your GP prior, set a non-zero
Q3: When optimizing for both high stability (Target: Max Tm) and low viscosity (Target: Min Concentration at 20 cP), how do we structure the single objective function for a standard BO implementation?
- Answer: Construct a weighted, normalized composite objective.
- Formula:
Objective = w1 * ((Tm - Tm_min) / (Tm_max - Tm_min)) - w2 * ((log(Viscosity) - log(Visc_min)) / (log(Visc_max) - log(Visc_min))) - Procedure:
- Define plausible min/max ranges for Tm and Viscosity from literature or prior data.
- Normalize each property to a [0,1] scale.
- Assign weights
w1andw2(e.g., 0.7 and 0.3) reflecting the project's priority. - The negative sign for viscosity ensures minimizing viscosity increases the score.
- Formula:
Q4: We have prior knowledge about which antibody framework regions most influence viscosity. How can we incorporate this into the BO model?
- Answer: Use informative priors in the GP kernel.
- Method: Apply Automatic Relevance Determination (ARD) with a Matern or RBF kernel. Start the length-scale parameters for known critical regions (e.g., CDR loops) with smaller initial values, making the model initially more sensitive to changes in those dimensions. For truly categorical variables (e.g., specific amino acid types at a site), use a Hamming kernel or one-hot encoding.
Troubleshooting Guides
Issue: Poor Performance Despite Many Iterations
- Check 1: Initial Design. Your initial Design of Experiments (DoE) may be insufficient. For a sequence space with
ddimensions, start with at least5*dto10*dpoints using Latin Hypercube Sampling (LHS). - Check 2: Kernel Choice. For antibody parameters (continuous, discrete, categorical), a composite kernel is often needed. Example:
Matern (for continuous) + Hamming (for categorical). - Action Plan: Pause optimization. Visualize the surrogate model's mean and variance predictions across 2D slices of your parameter space. If the model appears random, restart with a better DoE and a simpler, more exploratory configuration.
Issue: Objective Function Evaluation is Extremely Expensive (e.g., In Silico FEP calculations)
- Solution: Implement a Multi-Fidelity Approach.
- Protocol: Use a lower-fidelity, cheaper method (e.g., coarse-grained simulation, heuristic scoring function) to approximate the objective for many candidate points. The BO algorithm uses this to decide which few points warrant evaluation with the high-fidelity method (e.g., experimental viscosity measurement).
- Visual Workflow: See Diagram 1 below.
Issue: Constraints are Violated by Suggested Experiments (e.g., suggested mutant is insoluble)
- Solution: Use Constrained Bayesian Optimization.
- Methodology: Model the constraint (e.g., solubility > threshold) with a separate GP classifier. Multiply your primary acquisition function by the probability of satisfying the constraint. Only suggest points with a high probability of being feasible.
- Experimental Integration: Build a quick, cheap solubility assay (e.g., thermal challenge followed by SEC-HPLC) to run in parallel with your main stability/viscosity assays to gather constraint data.
Table 1: Common GP Kernels for Antibody Optimization
| Kernel Name | Best For | Key Parameter | Consideration for Antibodies |
|---|---|---|---|
| Matern 5/2 | Continuous parameters (pH, Temp) | Length-scale | Default choice for smooth but not infinitely differentiable functions. |
| Radial Basis (RBF) | Very smooth, continuous trends | Length-scale | Can oversmooth if the response is complex. |
| Hamming | Categorical/sequence data (Amino Acid type) | Length-scale | Essential for encoding discrete mutations. |
| Dot Product | Linear trends | Variance offset | Useful as a component in composite kernels. |
Table 2: Comparison of Acquisition Functions
| Function | Goal | Parameter to Tune | Use-Case Phase |
|---|---|---|---|
| Expected Improvement (EI) | Balance explore/exploit | xi (exploration weight) |
General purpose, most common. |
| Upper Confidence Bound (UCB) | Explicit exploration | kappa (confidence level) |
Early-stage, highly uncertain space. |
| Probability of Improvement (PI) | Pure exploitation | xi |
Final tuning of a promising region. |
| Noisy EI | Noisy observations | xi, noise_level |
When experimental replicates vary. |
Experimental Protocol: Standard BO Loop for Viscosity-Stability Screening
1. Define Parameter Space & Objective:
- Parameters: List mutable residues (e.g., CDR-H3 positions 99-102), each with possible amino acids [A, R, N, D...].
- Objective: As defined in FAQ A3. Establish assay protocols for
Tm(Differential Scanning Fluorimetry) andViscosity(Dynamic Light Scattering or micro-viscometer).
2. Initial Experimental Design:
- Use LHS to select
n_init= 50-100 unique antibody variants. - Express, purify, and characterize (
Tm,Viscosity) alln_initvariants. Run in triplicate.
3. BO Loop Execution (Iterative Phase):
- Surrogate Model Training: Fit a GP with a composite kernel to all accumulated data.
- Acquisition Maximization: Use an optimizer (e.g., L-BFGS-B, DIRECT) to find the next candidate variant(s) that maximize the acquisition function.
- Experimental Evaluation: Characterize the suggested variant(s).
- Iterate: Repeat until resource budget exhausted or convergence (e.g., <1% improvement in objective over 10 iterations).
Mandatory Visualizations
Multi-Fidelity BO for Costly Experiments
Core Bayesian Optimization Cycle
The Scientist's Toolkit: Research Reagent Solutions
Table 3: Essential Materials for Antibody Stability-Viscosity BO Experiments
| Item | Function / Role in BO Workflow |
|---|---|
| High-Throughput Expression System (e.g., Expi293F) | Rapid production of 100s of antibody variant supernatants for initial design and iterative testing. |
| Automated Liquid Handler | Enables precise, reproducible plate-based assays for DSF and sample prep for viscosity. |
| Differential Scanning Fluorimeter (DSF, e.g., Prometheus) | Measures thermal stability (Tm, ΔG) in a high-throughput, low-volume format. |
| Dynamic Light Scattering (DLS) Plate Reader | Measures hydrodynamic radius and assesses aggregation propensity, correlated with viscosity. |
| Micro-Viscometer (e.g., ViscoStar) | Directly measures viscosity of low-volume (≤50 µL) protein samples. |
| BO Software Library (e.g., BoTorch, GPyOpt, scikit-optimize) | Provides algorithms for Gaussian Process modeling, acquisition function optimization, and loop management. |
| Laboratory Information Management System (LIMS) | Tracks the genotype (sequence), experimental parameters, and phenotype (Tm, Viscosity) data for each variant, essential for data integrity in the BO loop. |
Implementing Bayesian Optimization: A Step-by-Step Framework for Antibody Engineering
FAQs & Troubleshooting Guides
Q1: How do I properly define my initial sequence variant library for a Bayesian optimization study of antibody viscosity? A: Ensure your variant library covers a diverse, yet physically plausible, sequence space. Common issues include:
- Problem: Poor optimization convergence due to a sparse initial dataset.
- Solution: Use a combination of structure-based computational design (e.g., targeting net charge, hydrophobic patches) and historical variant data. Aim for 20-50 well-characterized variants to seed the model. Avoid clustering variants with only single-point mutations.
Q2: What are the critical formulation parameters to include when expanding the search space beyond sequence? A: The key parameters are pH, ionic strength, and excipient concentration. A frequent error is using ranges that are too narrow or physiologically irrelevant.
- Problem: Missing the optimal formulation sweet spot.
- Solution: Define ranges based on stability and feasibility: pH (5.0-7.0), NaCl (0-150 mM), Sucrose (0-10% w/v), or Histidine (5-50 mM). Use a Design of Experiments (DoE) approach to sample this space efficiently when combined with sequence variables.
Q3: My high-concentration viscosity measurements are highly variable. How can I improve reproducibility? A: This is often related to sample handling and instrument calibration.
- Problem: Inconsistent shear history or sample equilibration leads to noisy viscosity data, confusing the Bayesian model.
- Solution:
- Pre-shear all samples at a fixed, moderate shear rate for 60 seconds.
- Equilibrate at the measurement temperature (e.g., 25°C) for 10 minutes.
- Use a controlled-stress rheometer with a cone-plate geometry for small sample volumes.
- Implement a triplicate measurement protocol, discarding the first reading as a conditioning step.
Q4: How do I balance the number of sequence vs. formulation parameters to avoid an intractably large search space? A: Use a tiered approach.
- Problem: The "curse of dimensionality" makes optimization inefficient.
- Solution: Start with a sequence-only search (5-10 mutable positions) to identify promising variant families. Then, for the top 2-3 variants, launch a combined sequence-formulation optimization where formulation is the primary variable, using the earlier data as prior knowledge.
Key Experimental Protocols
Protocol 1: High-Throughput Viscosity Screening at Low Volume
- Objective: Measure relative viscosity of antibody variants at high concentration using minimal material.
- Methodology:
- Concentrate purified antibody variants to 100-150 mg/mL using 10 kDa MWCO centrifugal filters.
- Load 20 µL of sample into a capillary-based viscosity instrument (e.g., Unchained Labs Little Mr. Viscosity or similar).
- Measure the flow time through a micro-capillary at a controlled pressure and temperature (25°C).
- Calculate kinematic viscosity relative to a buffer standard. Normalize all values to a common reference antibody included in each plate.
- Key Controls: Include a buffer blank and a standard antibody control on every measurement plate.
Protocol 2: Formulation Buffer Preparation for DoE Studies
- Objective: Generate precise, high-throughput formulation buffers for stability-viscosity profiling.
- Methodology:
- Prepare stock solutions of all excipients (e.g., 1M Histidine, 2M NaCl, 40% Sucrose).
- Use a liquid handling robot to mix stocks according to a DoE matrix in 96-well deep-well blocks.
- Adjust pH of each buffer using micro-titrations of 0.5M HCl or NaOH. Verify final pH in a representative subset.
- Perform buffer exchange for selected antibody variants into each formulation using 96-well plate desalting columns or dialysis.
- Concentrate to target concentration (e.g., 50 mg/mL) for screening.
Data Tables
Table 1: Typical Search Space Parameters for Antibody Optimization
| Parameter Category | Specific Variables | Typical Range | Key Consideration |
|---|---|---|---|
| Sequence | CDR Residue Identity | 3-5 positions, 2-4 aa each | Prioritize by in silico SCM or hydrophobicity |
| Sequence | Framework Patch Mutation | e.g., "TM2" (S28T, S30T, S65T) | Known to modulate self-interaction |
| Formulation | pH | 5.0 - 7.0 (0.5 increments) | Impacts charge distribution & stability |
| Formulation | Ionic Strength (NaCl) | 0 - 150 mM | Screens electrostatic interactions |
| Formulation | Stabilizer (Sucrose) | 0 - 10% (w/v) | Alters solution viscosity & stability |
Table 2: Common Viscosity Measurement Methods
| Method | Sample Volume | Concentration Range | Throughput | Key Limitation |
|---|---|---|---|---|
| Capillary Viscometer | 10-30 µL | 50-200 mg/mL | High | Measures kinematic viscosity only |
| Micro-Rheology | 5-10 µL | 1-150 mg/mL | Medium | Requires tracer particles |
| Cone-Plate Rheometer | 50-100 µL | 10-200 mg/mL | Low | Gold standard; requires more sample |
Visualizations
Diagram 1: Search Space Definition Workflow
Diagram 2: BO for Antibody Tradeoffs Logic
The Scientist's Toolkit
| Research Reagent / Material | Function in Experiment |
|---|---|
| Histidine-HCl Buffer Stock (1M, pH 6.0) | Primary buffer system for formulation screens; provides pH control and chemical stability. |
| Sodium Chloride (NaCl) | Modifies ionic strength to screen for electrostatic-driven self-interactions affecting viscosity. |
| Trehalose or Sucrose | Stabilizing excipient; used to probe colloidal stability and its effect on solution viscosity. |
| 96-Well Plate Desalting Columns | Enables high-throughput buffer exchange of multiple antibody variants into numerous formulation conditions. |
| 10 kDa MWCO Centrifugal Filters | For concentrating antibody samples to high concentration (≥100 mg/mL) for viscosity measurements. |
| Reference mAb Control | A well-characterized antibody with known viscosity profile; essential for data normalization and instrument QC. |
| Capillary Viscometer Plates/Chips | Enables low-volume, high-throughput relative viscosity measurements for initial screening. |
Troubleshooting Guides & FAQs
Q1: My Gaussian Process (GP) surrogate model training is failing due to high-dimensional antibody sequence data (one-hot encoded). What are my options? A: High-dimensional one-hot encoded sequences often violate GP assumptions of smoothness and lead to poor kernel matrix conditioning. Solutions include:
- Dimensionality Reduction: Apply Principal Component Analysis (PCA) or use learned embeddings from a pre-trained protein language model (e.g., ESM-2) before model training.
- Model Switching: Use a surrogate model better suited for high-dimensional, discrete data, such as a Random Forest or a Bayesian Neural Network (BNN).
- Kernel Selection: If using a GP, switch to a specialized kernel like the Fisher kernel or a deep kernel that incorporates sequence information.
Q2: The predictions from my ensemble of surrogates (GP and Random Forest) disagree significantly for promising candidate sequences. Which prediction should I trust for the next Bayesian optimization iteration? A: Significant disagreement indicates high model uncertainty in that region of the sequence-stability-viscosity landscape. This is an opportunity for active learning.
- Strategy: Use an acquisition function that explicitly balances exploration and exploitation, like Expected Improvement (EI) or Upper Confidence Bound (UCB). The candidate with the highest acquisition function value, not necessarily the best mean prediction, should be selected for the next wet-lab experiment.
- Protocol: Calculate the mean and variance (uncertainty) for each candidate from the ensemble. Feed these into the acquisition function. The candidate maximizing the acquisition function is the optimal next experiment.
Q3: How do I integrate experimental viscosity measurements (a notoriously noisy assay) into my surrogate model reliably? A: Explicitly modeling measurement noise is crucial.
- Methodology: When configuring your surrogate model (e.g., a GP), set or estimate a noise parameter (
alphain scikit-learn'sGaussianProcessRegressor). Use replicate experimental data to estimate the noise level empirically. - Protocol: For each candidate antibody, perform at least
n=3technical replicates of the viscosity measurement (e.g., using a micro-viscometer). Calculate the variance. Use the average variance across recent batches as a prior for the GP's noise level parameter to stabilize training.
Q4: My multi-output surrogate model, predicting both stability (Tm) and viscosity (cP), performs poorly on viscosity. Should I build separate models? A: Not necessarily. A poorly performing multi-output model often indicates mismatched scaling or inappropriate coregionalization.
- Troubleshooting Steps:
- Scale Outputs: Independently standardize the Tm and cP values to have zero mean and unit variance.
- Kernel Review: For a Multi-output GP, ensure you are using an appropriate coregionalization kernel (e.g.,
Coregionalization) that can learn correlations between the two outputs. If no correlation exists, separate models may be simpler. - Validate Correlation: Check the Pearson correlation between experimental Tm and cP in your existing data. If
|r| < 0.2, separate models are recommended.
Research Reagent Solutions
| Item | Function in Surrogate Modeling for Antibody Optimization |
|---|---|
| scikit-learn | Python library providing robust implementations of Random Forest regressors and foundational tools for data scaling/preprocessing for model training. |
| GPyTorch / BoTorch | PyTorch-based libraries for flexible Gaussian Process and Bayesian optimization model building, ideal for custom kernel design and multi-output tasks. |
| ESM-2 (Meta) | Pre-trained protein language model used to generate informative, continuous vector embeddings of antibody variable region sequences, reducing dimensionality. |
| UniRep (JAX) | Alternative protein sequence representation model for generating rich features from amino acid sequences as input for machine learning models. |
| PyMC3 / NumPyro | Probabilistic programming frameworks for building complex, hierarchical Bayesian models (e.g., Bayesian Neural Networks) as surrogates. |
| Pandas / NumPy | Essential for data wrangling, organizing experimental data (sequences, Tm, cP), and preparing it for model ingestion. |
Key Experimental Data
Table 1: Comparison of Surrogate Model Performance on Antibody Stability-Viscosity Dataset (Hypothetical Data)
| Model Type | Kernel/Architecture | Stability (Tm) RMSE (°C) ↓ | Viscosity (cP) RMSE ↓ | Avg. Training Time (min) | Handles High-Dim Seq? |
|---|---|---|---|---|---|
| Gaussian Process | RBF Kernel | 1.05 | 0.82 | 45 | No |
| Gaussian Process | Deep Kernel + ESM-2 | 0.78 | 0.65 | 62 | Yes |
| Random Forest | 100 Trees | 0.95 | 0.71 | 5 | Yes |
| Bayesian Neural Net | 3 Hidden Layers | 0.82 | 0.68 | 110 | Yes |
| Multi-output GP | ICM Kernel | 0.88 | 0.75 | 58 | No |
Table 2: Impact of Noise Modeling on Surrogate Prediction for Viscosity
| Noise Handling Method | Estimated Noise Level (cP²) | Model Log-Likelihood on Test Set ↑ |
|---|---|---|
None (alpha=1e-6) |
Fixed, Low | -125.4 |
| Empirical (from replicates) | 0.11 | -48.7 |
| Marginal Likelihood Maximization | 0.09 | -50.1 |
Experimental Protocol: Training a Robust Surrogate Model
Title: Integrated Workflow for Surrogate Model Training on Antibody Data
Objective: To train a surrogate model that accurately maps antibody sequence features to experimentally measured stability (Tm) and viscosity.
Materials:
- Dataset of antibody variable region sequences and corresponding experimental Tm & viscosity values.
- Python environment with scikit-learn, GPyTorch, pandas, numpy.
- ESM-2 model weights (local or via API).
Procedure:
- Feature Generation: Input antibody sequences into the ESM-2 model. Extract the per-residue or pooled embeddings from the final layer. Use PCA to reduce dimensions to ~50.
- Data Partitioning: Randomly split the dataset into training (70%), validation (15%), and hold-out test (15%) sets. Ensure stratified sampling across a range of Tm/viscosity values.
- Output Scaling: Independently standardize the Tm and viscosity vectors (from the training set only) using
StandardScaler. - Model Configuration: Initialize your chosen surrogate model (e.g., a GP with a Matern 5/2 kernel). For the GP, set the noise constraint based on prior replicate variance (see Table 2).
- Training: Fit the model to the scaled training data (ESM-2 features -> scaled outputs). For GPs, optimize the marginal log-likelihood. For Random Forests, use out-of-bag error.
- Validation: Predict on the validation set. Inverse-transform the predictions to original units. Calculate RMSE and Mean Absolute Error (MAE).
- Hyperparameter Tuning: Adjust model complexity (kernel lengthscales, number of trees, network layers) based on validation performance to avoid overfitting.
- Final Evaluation: Retrain on combined training+validation data. Report final performance metrics on the untouched test set.
Model Integration & Selection Workflow Diagram
Surrogate Model Decision Logic Diagram
Technical Support Center
Troubleshooting Guides & FAQs
Q1: During a Bayesian optimization (BO) run for mAb formulation, my acquisition function gets "stuck," repeatedly selecting similar points without exploring new regions of the viscosity-stability space. How can I address this?
A: This indicates a potential over-exploitation issue. Recommended actions:
- Check Kernel Hyperparameters: An excessively large length-scale in the Matern or RBF kernel can over-smooth the surrogate model, causing it to miss local optima. Re-optimize hyperparameters (e.g., via marginal log-likelihood maximization) or consider using an automatic relevance determination (ARD) kernel.
- Adjust Acquisition Function Parameters: If using Expected Improvement (EI), increase the exploration parameter (ξ). A typical range is 0.01 to 0.1. Systematically increase ξ and monitor the diversity of selected points.
- Switch Acquisition Functions: Temporarily switch to an Upper Confidence Bound (UCB) with a high β (e.g., β=4-6) for a few iterations to force exploration, or use a purely exploratory function like Thompson Sampling.
- Add Manual Exploration Points: Inject a random or space-filling design point into the next batch to perturb the optimization loop.
Q2: The predicted mean from my Gaussian Process (GP) model for viscosity appears accurate, but the uncertainty (variance) is unrealistically low, causing poor exploration. What could be wrong?
A: Unrealistically low uncertainty often stems from inappropriate noise assumptions.
- Noise Model Mis-specification: Your experimental noise may be higher than assumed. Explicitly model heteroscedastic (input-dependent) noise if your measurement error varies across the formulation space (e.g., higher error at high viscosity).
- Kernel Choice: The default kernel might be too rigid. Implement a composite kernel (e.g., RBF + WhiteKernel) to capture both the smooth function and independent noise. Ensure the WhiteKernel's noise level parameter is being optimized.
- Data Pre-processing: Verify that the viscosity and stability data are scaled appropriately (e.g., standardized). Features on vastly different scales can distort distance calculations in the kernel.
Q3: When optimizing for both low viscosity and high stability, how do I handle conflicting objectives within the acquisition function?
A: For multi-objective BO, you must use a specialized acquisition function.
- Methodology: Employ the Expected Hypervolume Improvement (EHVI). This is the gold standard for Pareto front discovery. It measures the expected increase in the hypervolume dominated by the Pareto front after adding a new point.
- Protocol: After each experiment, update the GP models for both viscosity and stability. Calculate the current Pareto front from all observed data. The EHVI acquisition function then evaluates candidate formulations by how much they are expected to improve this front. Select the point maximizing EHVI for the next experiment.
- Alternative: For a simpler scalarized approach, use the Weighted Sum method with a standard EI. Define a scalar objective:
Objective = w * (Stability Score) - (1-w) * log(Viscosity). Optimize this single objective with BO. Vary the weightwacross multiple BO runs to map the trade-off.
Key Experimental Protocols
Protocol 1: Benchmarking Acquisition Functions for mAB Formulation
- Design: Create a historical dataset of 50-100 formulations with measured viscosity (cp, at 10 mg/mL, 20°C) and stability (% monomer after 4 weeks at 40°C).
- Surrogate Model: Fit independent GP models with Matern 5/2 kernels to viscosity and stability data. Use 5-fold cross-validation to validate model predictions.
- BO Loop Simulation: Start each BO run from a randomly selected subset of 10 initial points. Iteratively "select" the next point using different acquisition functions (EI, UCB, Probability of Improvement, Thompson Sampling). Use the full historical dataset to simulate the "experimental result" for the selected point.
- Metric: Track the log hypervolume improvement over iterations. The acquisition function leading to the fastest hypervolume growth is optimal for your problem.
Protocol 2: Calibrating the Exploration-Exploitation Trade-off Parameter (ξ for EI)
- Initial Run: Conduct a BO run with a default ξ=0.01.
- Analysis: Plot the distance of each newly selected point to its nearest neighbor in the observed dataset. Calculate the moving average of this distance.
- Adjustment: If the moving average distance drops below a threshold (e.g., 10% of the feature space diameter) for 3 consecutive iterations, increase ξ by a factor of 1.5 for the next iteration.
- Validation: Run two parallel BO experiments on the same mAb: one with static ξ=0.01 and one with the adaptive ξ protocol from steps 1-3. Compare the Pareto fronts obtained after 30 iterations.
Data Presentation
Table 1: Performance Comparison of Acquisition Functions in a Simulated mAB Optimization Scenario: Maximizing Stability & Minimizing Viscosity over 40 iterative experiments.
| Acquisition Function | Final Hypervolume (a.u.) | Iterations to Reach 90% Max HV | % of Selected Points in Unexplored Regions* |
|---|---|---|---|
| Expected Improvement (EI) | 12.7 | 28 | 35% |
| Upper Confidence Bound (UCB, β=2) | 11.9 | 33 | 52% |
| Probability of Improvement (PI) | 10.5 | 37 | 22% |
| Thompson Sampling (TS) | 12.4 | 26 | 48% |
| q-EHVI (Multi-Objective) | 14.2 | 24 | 41% |
*Unexplored Region: Distance > 0.2 (normalized space) from all previous points.
Table 2: Impact of EI Exploration Parameter (ξ) on Optimization Outcome Data from a single mAb formulation screen targeting viscosity < 5 cp.
| ξ Value | Final Best Viscosity (cp) | Stability at that Point (% monomer) | Total Distinct Formulation Clusters Explored |
|---|---|---|---|
| 0.001 | 4.8 | 94.2 | 3 |
| 0.01 | 4.5 | 93.8 | 7 |
| 0.1 | 5.1 | 95.1 | 11 |
| Adaptive (0.01-0.3) | 4.4 | 94.5 | 9 |
Visualizations
Title: Bayesian Optimization Cycle for mAb Development
Title: Acquisition Function Balancing Exploration vs Exploitation
The Scientist's Toolkit: Research Reagent Solutions
| Item / Reagent | Primary Function in BO for mAb Formulation |
|---|---|
| Histidine Buffer System (e.g., L-Histidine/Histidine-HCl) | A common pH buffer (range 5.5-6.5) providing a controlled ionic environment for screening excipient effects on viscosity and stability. |
| Excipient Library (Sucrose, Trehalose, Arginine-HCl, Proline, NaCl, PS20/PS80) | Key formulation components whose concentrations become the input variables (dimensions) for the Bayesian optimization search space. |
| High-Throughput Viscosity Analyzer (e.g., μVISC, DLS-based) | Enables rapid, low-volume viscosity measurement of hundreds of formulation candidates, generating the critical quantitative data for the GP model. |
| Stability-Indicating Assays (SEC-HPLC, DSC, DLS for subvisible particles) | Provide the stability/output metrics (e.g., % monomer, Tm, kD) for the multi-objective optimization, often after stressed storage. |
| Automated Liquid Handler | Essential for precise, high-throughput preparation of the diverse formulation combinations suggested by the BO algorithm. |
| BO Software Platform (e.g., BoTorch, GPyOpt, custom Python with scikit-learn & GPflow) | Provides the computational framework for building GP models, calculating acquisition functions (EI, UCB, EHVI), and managing the iterative optimization loop. |
Technical Support Center: Troubleshooting & FAQs
Q1: Our Bayesian optimization (BO) loop is suggesting antibody variants with very high predicted stability but also a high predicted viscosity risk. Should we proceed with synthesis? A1: Yes, but with caution. The BO algorithm is exploring the trade-off frontier. Validate these "high-risk, high-reward" candidates with in silico viscosity predictors (e.g., spatial charge map, CoVariance Identification [CVI] score) before moving to wet-lab. If predictors concur, synthesize a small batch for initial viscosity measurement (e.g., micro-scale viscosity assessment) before full expression.
Q2: During wet-lab validation, the measured viscosity of a variant is significantly higher than the BO model predicted. What could be the cause? A2: Common causes and solutions:
- Feature Miscalibration: The isoelectric point (pI) or charge features used in the model may not fully capture the specific self-interaction. Re-check the calculated molecular features for errors.
- Concentration Discrepancy: Ensure the measured protein concentration is exact. Use orthogonal methods (A280, SEC-MALS) for confirmation.
- Buffer Conditions: Verify that the formulation buffer (pH, ionic strength, excipients) matches the in silico simulation conditions exactly.
- Assay Variability: Perform the viscosity measurement (e.g., on a viscometer) in triplicate. High variance may indicate instrument or sample handling issues.
Q3: The stability (e.g., Tm from DSF) of a synthesized variant is much lower than predicted, breaking the expected trade-off. How should we update the BO model? A3: This is critical feedback for the BO loop.
- Confirm Data Fidelity: Repeat the stability assay to rule out experimental error.
- Enter Data Point with Confidence Metric: Input the new (sequence, measured stability, measured viscosity) data pair into the BO database. Tag it with a "high confidence" flag if the assay was robust.
- Adjust Model Hyperparameters: Retrain the Gaussian Process model. The unexpected result may indicate a need to adjust the length-scale hyperparameters, suggesting the model was over-confident in a region of the sequence space.
- Re-run Optimization: The updated model will now avoid this region of the design space, improving subsequent suggestions.
Q4: We are experiencing slow progress in the BO loop. The algorithm seems to be "exploiting" rather than "exploring" the design space. A4: Tune the acquisition function.
- Problem: Over-use of Expected Improvement (EI) can lead to exploitation.
- Solution: Shift to Upper Confidence Bound (UCB) with a higher
kappaparameter (e.g., increase from 2 to 4) to weight exploration more heavily for the next 1-2 design rounds. Alternatively, use a mixed strategy (e.g., 70% EI, 30% random query) for the next iteration.
Q5: How do we handle failed protein expression or purification for a suggested variant? A5: This is a common bottleneck.
- Immediate Action: Assign a "failed expression" flag and input a penalty value for stability and viscosity (e.g., a very low stability and very high viscosity) into the BO dataset. This actively teaches the model to avoid sequences with poor developability.
- Root Cause: Run quick in silico checks on the failed sequence: check for aggregation-prone regions (APR) or unusual codon usage. This can inform a filter for future suggestions.
- Protocol: Implement a high-throughput micro-expression screen (e.g., 1 mL deep-well plate) for all suggested variants before moving to large-scale purification to catch expression issues early.
Key Experimental Protocols
Protocol 1: High-Throughput Stability Assessment (Differential Scanning Fluorimetry - DSF)
- Prepare Samples: Dilute purified antibody variant to 0.2 mg/mL in formulation buffer. Mix 25 µL of protein with 25 µL of 10X SYPRO Orange dye.
- Plate Setup: Load into a 96-well PCR plate in triplicate. Include a buffer-only + dye control.
- Run Assay: Using a real-time PCR instrument, ramp temperature from 25°C to 95°C at a rate of 1°C/min, with fluorescence measurements (excitation/emission ~470/570 nm) at each step.
- Analyze Data: Plot derivative of fluorescence (dF/dT) vs. temperature. The melting temperature (Tm) is the peak minimum. Report the mean ± SD of triplicates.
Protocol 2: Micro-Scale Viscosity Measurement (Dynamic Light Scattering - DLS)
- Sample Preparation: Buffer-exchange antibody variants into the target formulation buffer and concentrate to a target high concentration (e.g., 150 mg/mL) using centrifugal concentrators. Confirm concentration via A280.
- Measurement: Load 15 µL of sample into a glass capillary or low-volume cuvette. Place in a DLS instrument equipped with a viscosity measurement module.
- Data Collection: Measure the diffusion coefficient at 25°C. The apparent viscosity is derived from the Stokes-Einstein equation, relative to a buffer standard.
- Quality Control: Ensure the intensity autocorrelation function fits a single major species model. Polydispersity >25% may indicate aggregation invalidating the viscosity readout.
Protocol 3: Bayesian Optimization Iteration Update
- Data Compilation: Assemble a table with columns: [VariantID, SequenceFeatures (pI, hydrophobicity index, etc.), MeasuredTm, MeasuredViscosity].
- Data Normalization: Scale all input features and target outputs (Tm, viscosity) to zero mean and unit variance.
- Model Retraining: Using a Gaussian Process library (e.g., GPyTorch, scikit-learn), train a model with a Matern kernel on all data.
- Acquisition Calculation: Compute the Upper Confidence Bound (UCB) for all candidate sequences in the pre-enumerated library.
- Selection: Choose the top 3-5 sequences with the highest UCB scores for the next round of synthesis and validation.
Table 1: Example Closed-Loop Experiment Results (Cycle 3)
| Variant ID | Predicted Tm (°C) | Measured Tm (°C) | Predicted Viscosity (cP) | Measured Viscosity (cP) | Expression Yield (mg/L) |
|---|---|---|---|---|---|
| BO-3-01 | 72.5 | 71.8 ± 0.4 | 12.1 | 14.5 ± 0.8 | 45 |
| BO-3-02 | 69.1 | 68.3 ± 0.6 | 8.2 | 8.0 ± 0.3 | 52 |
| BO-3-03 | 75.2 | 70.1 ± 1.1 | 15.5 | 22.7 ± 1.5 | 28 |
| Parent | 68.0 | 68.0 | 15.0 | 15.0 | 60 |
Table 2: Key Bayesian Optimization Hyperparameters
| Parameter | Symbol | Value Used | Function |
|---|---|---|---|
| Acquisition Function | α(x) | UCB (κ=2.5) | Balances exploration/exploitation |
| Kernel | k(x,x') | Matern (ν=2.5) | Models smoothness of the objective function |
| Noise Prior | σ² | 0.01 | Accounts for experimental measurement noise |
| Training Iterations | - | 1000 | For Gaussian Process model convergence |
Diagrams
Closed-Loop Bayesian Optimization Workflow
Wet-Lab Validation Protocol Steps
The Scientist's Toolkit: Research Reagent Solutions
| Item | Function in Closed-Loop Experiment |
|---|---|
| HEK293 Expi or CHO-S Cells | Mammalian expression systems for transient or stable production of human antibody variants, ensuring proper folding and post-translational modifications. |
| Protein A Affinity Resin | For high-purity, high-yield capture of IgG antibodies from cell culture supernatant in a single step. |
| Size-Exclusion Chromatography (SEC) Column | Critical for polishing purification, removing aggregates, and exchanging buffer into the desired formulation for stability/viscosity testing. |
| SYPRO Orange Dye | Fluorescent dye used in Differential Scanning Fluorimetry (DSF) to monitor protein unfolding as a function of temperature, yielding Tm. |
| Standardized Formulation Buffer Kits | Pre-mixed buffers (e.g., Histidine-Sucrose at various pHs) to ensure consistency in viscosity measurements across all variants. |
| Dynamic Light Scattering (DLS) Plate Reader | Enables low-volume, high-throughput measurement of diffusion coefficients and derived viscosity for concentrated antibody solutions. |
| Codon-Optimized Gene Fragments | For rapid synthesis of variant antibody sequences identified by the BO algorithm, accelerating the build phase of the cycle. |
| Bayesian Optimization Software (e.g., BoTorch, GPyOpt) | Python libraries to build, train, and query the Gaussian Process models that drive the iterative design process. |
Troubleshooting Guides & FAQs
Q1: Our lead antibody candidate shows acceptable potency but exhibits unacceptably high viscosity (>50 cP at 150 mg/mL) for subcutaneous delivery. What are the primary sequence or structural attributes we should investigate first?
A: High viscosity in mAb solutions is often linked to self-association driven by specific molecular interactions. Primary investigation targets should include:
- Net Surface Charge and Charge Distribution: A low net positive charge or asymmetric charge patches can increase viscosity. Calculate the isoelectric point (pI) and analyze 3D electrostatic surface maps.
- Hydrophobic Patches: Surface-exposed hydrophobic residues, particularly in the Complementarity-Determining Regions (CDRs), can drive aggregation and increase viscosity. Use tools like CamSol or Hydrophobic Interaction Chromatography (HIC) retention time to assess.
- Flexible Regions: High conformational entropy in the Fab or hinge region can contribute. Analyze molecular dynamics simulations or hydrogen-deuterium exchange mass spectrometry (HDX-MS) data for flexible segments.
Experimental Protocol: Cross-Interaction Chromatography (CIC) for Assessing Self-Association Potential
- Column: Use a commercially available human IgG column (e.g., HiTrap Protein G column coupled with pooled human IgG).
- Sample Prep: Dialyze your antibody candidate into a standard buffer (e.g., 20 mM Histidine, pH 6.0).
- Run Conditions: Load 50 µg of antibody at a low flow rate (0.2 mL/min). Elute with a linear pH gradient from pH 6.0 to 2.5 over 40 column volumes.
- Analysis: Monitor UV absorbance at 280 nm. A later elution peak (lower pH) indicates stronger self-interaction. Compare the retention time to a non-viscous control antibody.
Q2: We have generated a library of variants. How should we set up a Bayesian optimization loop to efficiently screen for the optimal stability-viscosity trade-off?
A: Bayesian optimization (BO) is ideal for navigating high-dimensional biologic design spaces with expensive measurements (like viscosity). The loop is structured as follows:
Experimental Protocol: Bayesian Optimization Workflow for mAb Engineering
- Initial Dataset: Characterize a small, diverse set of variants (20-50) for key attributes: Viscosity (at target concentration, e.g., 150 mg/mL), Thermal Stability (Tm1, Tm2 by DSC), Binding Affinity (KD by SPR or BLI), and Expression Titer.
- Model Training: Use a Gaussian Process (GP) model to learn the complex relationships between your input features (e.g., sequence descriptors, physicochemical properties) and the multi-dimensional output space (viscosity, stability, etc.).
- Acquisition Function: Apply an acquisition function (e.g., Expected Improvement) to the GP model. This function identifies the next most informative variant to test by balancing exploration (testing in uncertain regions of the space) and exploitation (testing near predicted optima).
- Iteration: The selected variant is experimentally characterized, and its data is added to the training set. The GP model is updated, and the loop repeats (Steps 2-4) until a candidate meeting all target profiles is identified.
Q3: During formulation development, viscosity of our optimized candidate spikes unexpectedly in a specific buffer condition (e.g., phosphate vs. histidine). What is the likely mechanism and how can we diagnose it?
A: This is typically indicative of a charge-mediated reversible self-association. Phosphate ions can specifically interact with positively charged residues (Arg, Lys, His), potentially bridging antibody molecules.
Diagnostic Protocol: Ion-Specific Viscosity Profiling
- Buffer Matrix: Prepare the antibody at 150 mg/mL in a series of buffers: 20 mM Histidine-HCl (pH 6.0), 20 mM Sodium Phosphate (pH 6.0), and 20 mM Citrate (pH 6.0). Keep ionic strength constant by adding NaCl.
- Measurement: Measure viscosity in triplicate using a micro-viscometer (e.g., capillary-based or rheometer with cone-plate geometry) at 25°C.
- Dynamic Light Scattering (DLS): Run DLS on the same samples to measure the hydrodynamic radius (Rh). A significant increase in Rh in phosphate buffer confirms reversible oligomerization.
- Mitigation: If phosphate is necessary, consider fine-tuning pH or adding excipients like arginine-HCl (100-200 mM), which can disrupt electrostatic interactions.
Data Presentation
Table 1: Bayesian Optimization Iteration Results for Lead Candidate ABC123
| Variant ID | CDR Mutations | Viscosity @ 150 mg/mL (cP) | Tm1 (°C) | KD (nM) | Expression (g/L) | Iteration |
|---|---|---|---|---|---|---|
| WT | -- | 58.2 | 67.5 | 5.1 | 2.1 | Initial |
| V-12 | H100aG, S100bR | 35.6 | 66.1 | 5.5 | 2.0 | 1 |
| V-45 | S31T, H102eY | 25.4 | 68.3 | 4.8 | 1.8 | 2 |
| V-78 | S31T, H100aG, H102eY | 19.1 | 69.0 | 5.0 | 2.3 | 3 (Optimal) |
| V-79 | S31T, H100aR | 42.1 | 65.5 | 120.0 | 2.1 | 3 |
Table 2: Formulation Screen Impact on Optimal Variant (V-78)
| Formulation Buffer (pH 6.0) | Ionic Strength (mM) | Viscosity (cP) | Aggregation (%) SEC-HPLC | Observation |
|---|---|---|---|---|
| 20 mM Histidine-HCl | 50 (w/ NaCl) | 19.1 | 0.8 | Clear, low viscosity |
| 20 mM Sodium Phosphate | 50 | 32.7 | 0.9 | Clear, elevated viscosity |
| 20 mM Citrate | 50 | 21.5 | 0.8 | Clear, low viscosity |
| 20 mM Histidine-HCl + 150mM Arg-HCl | 200 | 15.2 | 0.7 | Clear, lowest viscosity |
Mandatory Visualization
Bayesian Optimization Workflow for mAb Screening
Mechanism of Ion-Mediated Antibody Self-Association
The Scientist's Toolkit: Research Reagent Solutions
| Item | Function in Optimization | Example/Notes |
|---|---|---|
| Microcapillary Viscometer | Measures viscosity of small-volume (µL), high-concentration protein samples. Essential for high-throughput screening. | ViscoJet 2 (RheoSense). Requires < 50 µL sample. |
| Differential Scanning Calorimetry (DSC) | Quantifies thermal stability (Tm) of Fab and Fc domains. A key constraint in optimization. | MicroCal PEAQ-DSC. Used for measuring Tm1 & Tm2. |
| Surface Plasmon Resonance (SPR) / BLI | Measures binding kinetics (KD, kon, koff) to ensure potency is maintained during engineering. | Biacore 8K (SPR) or Octet RED384 (BLI). |
| Cross-Interaction Chromatography (CIC) Column | Pre-packed column for assessing self-association propensity via HPLC. Predictive of viscosity. | YMC BioPro CIC Column or in-house prepared human IgG column. |
| High-Throughput Protein Expression System | Rapid production of variant libraries for initial screening (e.g., in 96-well format). | Expi293F or CHO transient systems; Ambr 250 bioreactors. |
| Bayesian Optimization Software | Implements Gaussian Process modeling and acquisition functions to guide iterative design. | Custom Python (GPyTorch, BoTorch) or commercial platforms like GINKGO (Synthace). |
| Arginine-HCl | Common formulation excipient that suppresses viscosity via competitive charge shielding and hydrophobic interaction disruption. | Use at 100-250 mM in histidine buffer. |
Overcoming Pitfalls in Bayesian Optimization: Advanced Troubleshooting and Model Refinement
Troubleshooting Guides & FAQs
Noisy Data
Q1: Our high-throughput stability (Tm) measurements show high replicate variance, corrupting the BO surrogate model. How can we diagnose and mitigate this? A1: Noisy label data, common in biophysical assays, misleads the Gaussian Process (GP). Implement the following protocol:
- Diagnosis: For a control sample, run ≥10 replicates in the same assay plate. Calculate the Coefficient of Variation (CV). A CV > 10% indicates problematic noise levels.
- Mitigation - Replicate Strategy: Actively allocate a portion of your experimental budget for replicates. A suggested rule is to perform 3 replicates for points the GP model is most uncertain about (high prediction variance).
- Mitigation - Noise-Aware Modeling: Explicitly model the noise by using a GP likelihood that incorporates a
WhiteKernelorHeteroscedasticKernelin libraries likeGPyTorchorBoTorch. This prevents the model from overfitting to spurious measurements.
Q2: What experimental protocols minimize noise in antibody viscosity measurements? A2: Key methodologies for consistent capillary viscosity assessment:
- Instrument: Use a stabilized-temperature (e.g., 25°C ± 0.1°C) micro-viscometer (e.g., Viscologic).
- Sample Prep: Dialyze all samples into an identical formulation buffer (e.g., Histidine-Sucrose) to eliminate ionic strength artifacts.
- Control: Include a monoclonal antibody with known low viscosity (e.g., 5 cP at 50 mg/mL) as an inter-plate calibrator.
- Replicates: Perform four consecutive measurements per sample, discarding the first as a conditioning run, and report the mean of the remaining three.
Q3: How do we quantify noise to adjust our BO acquisition function? A3: Integrate estimated noise levels directly into the Expected Improvement (EI) or Upper Confidence Bound (UCB). First, characterize noise per experimental region:
| Experimental Condition | Suggested Replicates (n) | Estimated SD (σ) | Impact on Acquisition Function |
|---|---|---|---|
| Initial Random Screen | 2 | High (~2°C for Tm) | Use Noisy EI, increase exploration parameter (ξ). |
| High-Promise Region (Exploitation) | 4 | Medium (~1°C for Tm) | Standard EI. |
| High-Uncertainty Region (Exploration) | 3 | Propagated from model | UCB with β tuned for noise. |
Table 1: Replication strategy and noise integration for BO.
Model Mismatch
Q4: The GP model with a standard RBF kernel fails to capture sharp "cliffs" in the viscosity landscape when a single residue is mutated. How can we fix this? A4: This is a classic kernel mismatch. The smooth RBF kernel cannot model discontinuous relationships. Implement a composite kernel:
RBFKernel: Models the smooth, global effects across most dimensions.Matern12Kernel: Added for the specific dimension (e.g., charge at position 103H) known to cause sharp changes. This kernel allows for less smooth, more abrupt functions.*(Multiplication): Creates an interaction between the smooth and non-smooth kernels.- Protocol: Perform kernel selection via cross-validation on historical data before starting the BO loop.
Q5: Our antibody sequence space is combinatorial. How do we choose a model for such a structured, high-dimensional input? A5: Move beyond a standard GP with one-hot encoding. Use a latent embedding GP.
- Protocol: Pre-train a variational autoencoder (VAE) on a large corpus of antibody sequences (e.g., from OAS database).
- Model: Use the low-dimensional latent vector from the VAE as the input
xto your GP model. - Advantage: The VAE learns a continuous, semantically meaningful space where similar sequences are clustered, making the landscape much smoother and easier for the GP to model.
Diagram 1: Latent space modeling for antibody sequences.
Search Space Limitations
Q6: Our BO search is confined to 3 mutations, but we suspect global optima require 5-6 mutations. How can we expand the search space efficiently? A6: Use a trust region or adaptive expansion strategy.
- Define Initial Region: Start BO in a small, promising region (e.g., 3 mutations around CDR loops).
- Convergence Check: When EI falls below threshold
τ(e.g., 0.01 * max observed improvement), trigger expansion. - Expansion Protocol: Use the GP model to identify the most impactful unexplored mutation direction (highest predicted improvement at boundary) and add it to the search space. This prevents combinatorial explosion.
Q7: How do we balance exploring a vast sequence space with limited wet-lab experiments (≤100)? A7: Implement a multi-fidelity BO approach.
- Low-Fidelity (Cheap): Use in silico stability predictors (e.g.,
RosettaΔΔG,ABACUS) or rapid expression titer. - High-Fidelity (Expensive): Capillary viscosity and thermal shift (Tm) assays.
- Protocol: The GP model integrates data from both fidelities, using the cheap data to explore broadly and guiding expensive experiments to the most promising regions identified.
Diagram 2: Multi-fidelity BO workflow for efficient search.
The Scientist's Toolkit: Research Reagent Solutions
| Item | Function in Antibody Stability/Viscosity BO |
|---|---|
| Histidine-Sucrose Buffer (pH 6.0) | Standardized formulation buffer for viscosity measurements; eliminates confounding ionic effects. |
| Thermal Shift Dye (e.g., SYPRO Orange) | Fluorescent dye for high-throughput thermal denaturation (Tm) assays in 96/384-well plates. |
| Capillary Viscometer (e.g., Viscologic) | Measures kinematic viscosity of low-volume (≤100 µL) antibody samples at high concentration. |
| Octet RED96e / Biacore 8K | For rapid binding kinetics (KD) screening; can be used as a secondary fidelity objective. |
| HEK293 or CHO Transient Expression Kit | Enables rapid, small-scale (1-10 mL) antibody production for preliminary stability screening. |
| GP Library (BoTorch/GPyTorch) | Python libraries for building flexible, noise-aware Gaussian Process models for BO. |
| Antibody-Specific VAE Model | Pre-trained sequence model to embed antibodies into a continuous, optimization-friendly space. |
Optimizing Hyperparameters for Your Gaussian Process Surrogate Model
FAQs & Troubleshooting Guides
Q1: My Gaussian Process (GP) model is overfitting to the noisy viscosity measurements from my antibody stability screens. How can I adjust the hyperparameters to handle this?
A: Overfitting in GPs for biological data often stems from an incorrectly specified noise model. You need to explicitly model the observation noise by optimizing the alpha or noise hyperparameter.
- Protocol: When constructing your GP surrogate (e.g., using
scikit-learn'sGaussianProcessRegressor), setalphato the estimated variance of your experimental noise (e.g., from assay replicates). Alternatively, use a kernel that includes aWhiteKernelcomponent (e.g.,ConstantKernel() * RBF() + WhiteKernel()). During fitting, theWhiteKernel'snoise_levelparameter will be learned, explicitly accounting for measurement noise in your viscosity data. - Action: Implement kernel composition and re-optimize all hyperparameters via marginal log-likelihood maximization.
Q2: The optimization algorithm gets stuck in a local optimum when searching for hyperparameters (e.g., length scales) of my GP model. What optimization routine should I use?
A: Maximizing the marginal log-likelihood (MLL) is non-convex. Use a multi-start strategy to mitigate local optima.
- Protocol:
- Define reasonable bounds for your kernel hyperparameters (e.g., length scales between 0.1 and 100 times the feature range).
- Randomly sample 10-50 starting points from these bounds using a Latin Hypercube or uniform sampling.
- Run a local optimizer (e.g., L-BFGS-B) from each starting point.
- Select the hyperparameter set that yields the highest MLL.
- Action: Replace a single optimization call with a robust multi-start protocol.
Q3: My input features (e.g., antibody sequence descriptors, formulation conditions) are on different scales. How should I preprocess them for the GP's Radial Basis Function (RBF) kernel?
A: The RBF kernel is sensitive to input scale. You must standardize your features. The length scale hyperparameter becomes interpretable only after scaling.
- Protocol:
- Split your experimental data (e.g., stability vs. viscosity trade-off measurements) into training/validation sets.
- Compute the mean and standard deviation using the training set only for each input feature.
- Standardize both training and validation sets:
z = (x - mean_train) / std_train. - Fit the GP on the standardized training data. The optimized length scales will now reflect the relative importance of each standardized feature.
- Action: Implement feature standardization prior to GP model instantiation.
Q4: How do I choose the right kernel function for modeling the complex, non-linear relationship between antibody sequence/formulation and the stability-viscosity outcome?
A: For the high-dimensional, complex landscapes in biologics engineering, start with a flexible standard kernel and consider composition.
- Recommendation: Begin with an Automatic Relevance Determination (ARD) RBF kernel (
RBF(length_scale_bounds=(1e-2, 1e2))in scikit-learn). ARD assigns a different length scale to each feature, automatically inferring its relevance. For capturing different types of variation, use a Matérn 5/2 kernel (less smooth than RBF, often more realistic for physical phenomena) or combine kernels via addition (e.g.,RBF() + WhiteKernel()for noise).
Q5: What quantitative metrics should I use to validate my tuned GP surrogate model's performance before using it in Bayesian optimization?
A: Use standardized metrics on a held-out validation set of experimental measurements.
Table 1: Key Validation Metrics for GP Surrogate Models
| Metric | Formula (Approx.) | Ideal Value | Interpretation in Biologics Context |
|---|---|---|---|
| Standardized Mean Squared Error (SMSE) | (MSE / Var(y_true)) | ~0 | Fraction of variance not explained. <0.3 is often good. |
| Mean Standardized Log Loss (MSLL) | See [1] | ≤0 | Accounts for both predictive mean & uncertainty. Negative is better than a simple baseline. |
| Predictive Correlation | Corr(ypredmean, y_true) | ~1 | How well the predictive mean tracks the true experimental trend. |
| Coverage of 95% CI | % of y_true within pred. interval | ~95% | Calibration of uncertainty estimates. Critical for BO trust. |
Key Experimental Protocols
Protocol 1: Robust Hyperparameter Optimization via Marginal Log-Likelihood
- Define Kernel: Select and compose a kernel (e.g.,
C * RBF()). - Set Bounds: Define plausible bounds for all hyperparameters (C, length scales).
- Multi-Start Optimization: Sample
N(e.g., 25) random points from the bounds. - Optimize: For each start point, run a gradient-based optimizer (L-BFGS-B) to maximize Log Marginal Likelihood.
- Select: Choose the hyperparameter set with the highest optimized likelihood.
Protocol 2: k-Fold Cross-Validation for GP Model Selection
- Partition Data: Split your
nexperimental data points intok(e.g., 5) folds. - Iterate: For each fold
i:- Train GP on the other
k-1folds. - Predict mean and variance for fold
i. - Calculate validation metrics (SMSE, MSLL) on fold
i.
- Train GP on the other
- Aggregate: Compute the average validation metric across all
kfolds. Use this to compare different kernels or preprocessing methods.
The Scientist's Toolkit
Table 2: Research Reagent Solutions for Antibody Stability-Viscosity Experiments
| Item | Function in Experiment |
|---|---|
| Differential Scanning Calorimetry (DSC) | Measures thermal unfolding temperature (Tm), a key metric for antibody conformational stability. |
| Dynamic Light Scattering (DLS) | Assesses colloidal stability by measuring size distribution and aggregation propensity in solution. |
| Capillary Viscometer | Precisely measures intrinsic viscosity of low-volume, high-value antibody samples. |
| Formulation Buffers (Histidine, Succinate, etc.) | Systematically vary pH and ionic strength to probe their effect on the stability-viscosity trade-off. |
| Excipients (Sucrose, Arginine, Polysorbate 80) | Tool molecules to perturb protein-protein interactions and modify viscosity. |
| High-Throughput Stability Assays (e.g., Tycho) | Provide rapid, nano-scale thermal stability profiles for screening large design spaces. |
Visualizations
Diagram 1: GP Hyperparameter Optimization Workflow
Diagram 2: Kernel Composition for Antibody Data
This technical support center is designed within the context of a Bayesian optimization framework for antibody development, where researchers must simultaneously optimize stability, viscosity, and affinity—objectives that are often in direct competition. This guide provides troubleshooting and FAQs for common experimental and computational challenges.
Troubleshooting Guides & FAQs
FAQ 1: During high-concentration formulation screening, my lead candidate shows a sudden, unexpected increase in viscosity. What are the primary factors to investigate?
Answer: A sharp, non-linear increase in viscosity at high concentration (>100 mg/mL) is often driven by protein-protein self-association. Investigate these factors in order:
- Net Surface Charge: Measure the isoelectric point (pI) and compare it to your formulation pH. Operating at or near the pI reduces electrostatic repulsion.
- Hydrophobic Patches: Analyze the complementarity-determining regions (CDRs) and Fc interface for surface-exposed hydrophobic residues (e.g., Phe, Trp, Leu, Ile).
- Colloidal Interactions: Use dynamic light scattering (DLS) to measure the interaction parameter (kD). A negative kD indicates attractive interactions.
Troubleshooting Protocol: Perform a rapid buffer matrix screen.
- Prepare 5 formulation variants of your antibody at 150 mg/mL:
- Control: Histidine buffer, pH 6.0.
- Variant A: +100 mM NaCl (screens electrostatic shielding).
- Variant B: +200 mM Arginine-HCl (screens hydrophobic & electrostatic interactions).
- Variant C: +10% w/v Sucrose (screens preferential exclusion).
- Variant D: pH adjusted to 5.5 (adjusts net charge).
- Measure viscosity using a micro-viscometer (e.g., microliter capillary viscometer).
- Measure kD via DLS for each variant.
- Correlate viscosity reduction with kD shift toward positive values.
FAQ 2: My Bayesian optimization algorithm converges on solutions that improve viscosity but drastically reduce thermal stability (Tm drops >10°C). How can I constrain the model?
Answer: This indicates your objective function or acquisition function is not properly penalizing stability loss. You must implement a constrained or penalty-based Bayesian optimization approach.
Troubleshooting Protocol: Implement a Hard Constraint in Your Optimization Loop.
- Define your objectives and constraint:
- Objective 1: Minimize viscosity at 150 mg/mL (cP).
- Objective 2: Maximize affinity (pKD).
- Constraint: Tm1 must be >= 65°C (a hard boundary for developability).
- Modify your acquisition function (e.g., Expected Improvement) to evaluate only candidate points predicted to satisfy the Tm constraint by your surrogate model (Gaussian Process).
- In each experimental iteration, prioritize measuring Tm before viscosity and affinity for new variants. Discard variants failing the constraint from the main objective analysis.
FAQ 3: When performing cross-interaction chromatography (CIC) to assess polyspecificity, how do I interpret a broad, asymmetric peak?
Answer: A broad, tailing peak on a CIC column (often with immobilized human Fab or IgG) indicates heterogeneous, polyvalent interactions with the immobilized ligand, a strong risk signal for high viscosity and rapid clearance in vivo.
Troubleshooting Protocol: CIC Peak Deconvolution Analysis.
- Run Conditions: Use a standard CIC column (e.g., Capto L or Fab-coupled resin) with a linear gradient from 0 to 500 mM NaCl over 40 column volumes at pH 7.4.
- Data Analysis: Fit the elution peak to multiple Gaussian distributions. A single symmetric Gaussian suggests homogeneous, low-affinity interaction. The need for 2 or more Gaussians indicates sub-populations with different interaction strengths.
- Follow-up: Subject the early-eluting (weakest interacting) and late-eluting (strongest interacting) fractions from a preparative run to Surface Plasmon Resonance (SPR) against the same target to confirm the heterogeneity is due to non-specific binding.
Data Presentation
Table 1: Impact of Formulation Excipients on Key Developability Parameters
| Excipient (at standard dose) | Viscosity at 150 mg/mL (% vs Control) | Tm1 Shift (°C) | kD Change (mL/g) | Primary Mechanism of Action |
|---|---|---|---|---|
| Control (His, pH 6.0) | 100% (baseline ~15 cP) | 0.0 | 0.0 | Baseline |
| 100 mM NaCl | 85% | -0.5 | +2.5 | Electrostatic Shielding |
| 200 mM Arg-HCl | 55% | -3.0 | +5.0 | Complex: Hydrophobic Masking & Shielding |
| 10% w/v Sucrose | 110% | +2.0 | -0.5 | Preferential Exclusion, Minor Volume Exclusion |
| 0.02% PS-80 | 95% | 0.0 | 0.0 | Surface Adsorption (prevents aggregation) |
Table 2: Bayesian Optimization Results for a Model Antibody Library (Iteration 20)
| Variant ID | Mutations (Fv) | Predicted Viscosity (cP) | Measured Viscosity (cP) | Predicted Tm (°C) | Measured Tm (°C) | Affinity pKD |
|---|---|---|---|---|---|---|
| WT | - | 21.5 | 22.1 | 67.2 | 66.8 | 9.0 |
| BO-14 | S30R, H35Q | 12.1 | 11.7 | 64.5 | 63.9 | 9.2 |
| BO-17 | N54S, Q100kR | 9.8 | 10.5 | 69.1 | 68.5 | 8.8 |
| BO-19 | S30R, Q100kR | 8.3 | 18.5* | 66.0 | 58.2* | 9.5 |
Outlier: Measurement error suspected; highlighted for re-testing.
Experimental Protocols
Protocol: High-Throughput Stability and Viscosity Profiling for Bayesian Optimization Input Objective: Generate reliable, high-quality data for training Gaussian Process models on stability-viscosity trade-offs. Materials: See Scientist's Toolkit below. Method:
- Sample Preparation: Express and purify antibody variants in a 96-well format. Buffer exchange into a standard formulation (e.g., 20 mM Histidine, pH 6.0) using desalting plates.
- Concentration Normalization: Concentrate all variants to 100 mg/mL using a 96-well spin concentrator (30kDa MWCO).
- Thermal Shift Assay (Stability):
- Dispense 10 µL of each sample (100 mg/mL) into a 96-well PCR plate.
- Add 1x SYPRO Orange dye.
- Run a thermal ramp from 25°C to 95°C at 1°C/min in a real-time PCR machine.
- Record Tm1 as the inflection point of the fluorescence curve.
- Micro-scale Viscosity Estimation (Kinematic):
- Using a liquid handling robot, aspirate 5 µL of each 100 mg/mL sample.
- Dispense as a droplet onto a hydrophobic, gridded slide.
- Capture time-lapse images for 60 seconds.
- Calculate the droplet spreading rate. Use a pre-calibrated curve to convert spreading rate to kinematic viscosity. Correlate to dynamic viscosity (cP) using known density approximations.
- Data Integration: Compile Tm1 and viscosity estimates into a CSV file for direct input into the Bayesian optimization algorithm.
Visualizations
Diagram 1: Bayesian Optimization Workflow for Antibody Developability
Diagram 2: Key Antibody Self-Interaction Pathways Driving Viscosity
The Scientist's Toolkit: Research Reagent Solutions
| Item / Reagent | Function in Optimization | Example Product / Vendor |
|---|---|---|
| Histidine Buffer System (pH 5.5-7.0) | Standard formulation buffer for screening; allows pH adjustment to modulate charge. | MilliporeSigma Histidine Buffers |
| Arginine-HCl | Multi-purpose excipient; disrupts hydrophobic and electrostatic interactions to reduce viscosity. | Thermo Fisher Scientific |
| Sodium Chloride (NaCl) | Ionic excipient for electrostatic shielding; screens charge-charge attractions. | Generic, USP grade |
| SYPRO Orange Dye | Fluorescent dye for thermal shift assays; detects protein unfolding (Tm). | Thermo Fisher Scientific (S6650) |
| Capto L Affinity Resin | Ligand for Cross-Interaction Chromatography (CIC); assesses polyspecificity risk. | Cytiva |
| 96-Well Spin Concentrator (30kDa MWCO) | Enables high-throughput concentration to >100 mg/mL for viscosity screening. | Pall Corporation (MacroSep) |
| Micro-viscometer | Measures viscosity of small volumes (50-100 µL) at high concentration. | RheoSense m-VROC |
| Dynamic Light Scattering (DLS) Plate Reader | Measures hydrodynamic radius, polydispersity (PDI), and interaction parameter (kD). | Wyatt Technology (DynaPro Plate Reader) |
Incorporating Prior Knowledge and Domain Expertise to Accelerate Convergence
Troubleshooting Guides & FAQs
Q1: The optimization loop is stuck exploring random, high-viscosity antibody variants despite our input that certain hydrophobic patches are known to increase viscosity. Why is the model ignoring this prior knowledge?
A: This is often a result of incorrectly scaled or overly confident prior specification.
- Check: The mean and standard deviation of your Gaussian Process (GP) prior functions. A standard deviation that is too small (e.g., 0.01) can make the model overly confident, preventing it from updating beliefs with new data. Conversely, a standard deviation that is too large dilutes the prior's influence.
- Solution: Re-scale your prior knowledge to probabilistic "pseudo-observations." Instead of a hard rule, encode the knowledge as a set of virtual data points with associated uncertainty. For example, a prior belief that "mutations at positions X, Y, Z increase viscosity" can be entered as several simulated data points with moderate viscosity values and a carefully chosen noise term (e.g., ± 5 cP).
- Protocol: Use the
BayesianOptimizationpackage'sadd_priormethod or similar in BoTorch. Define your prior mean functionmu(X)to output higher viscosity for sequences with the hydrophobic patch, and set a kernelK(X, X')with a length scale reflecting your confidence.
Q2: After incorporating expert-designed scoring functions for "developability" into the acquisition function, convergence has slowed dramatically. What went wrong?
A: The combined acquisition function may be dominated by the exploitative (development score) term, killing exploration.
- Check: The weighting parameter (λ) balancing the Expected Improvement (EI) and the custom development score.
- Solution: Implement an adaptive weighting scheme. Start with a higher weight on EI for exploration and gradually increase the weight on the development score as iterations proceed.
- Protocol: Modify the acquisition function to
α(x) = (1-λ(t)) * EI(x) + λ(t) * S_dev(x), whereλ(t) = min(1, t / T), andTis the iteration at which you want full weight on the development score. Monitor the proportion of suggested points that are purely exploitation versus exploration.
Q3: My domain knowledge consists of complex, non-linear rules about stable Fc region configurations. How can I incorporate these beyond simple point priors?
A: Use a composite kernel in your Gaussian Process that explicitly encodes these structural relationships.
- Check: The default kernel (e.g., Matérn) may not capture domain-specific symmetries or constraints.
- Solution: Construct a custom kernel. For instance, if certain residue swaps are known to have additive effects, use an additive kernel. If stability depends on pairwise interactions within a region, incorporate a polynomial or a dedicated interaction kernel for that subset of features.
- Protocol (Conceptual): In GPyTorch or scikit-learn, define a kernel:
kernel = ScaleKernel( RBFKernel(active_dims=[positions_in_Fc]) + WhiteKernel() ). This directs the model to learn complex patterns specifically within the Fc region indices.
Key Quantitative Data in Antibody Stability-Viscosity Optimization
Table 1: Impact of Prior Strength on Convergence Metrics
| Prior Knowledge Type | Convergence Iteration (#) | Best Found Viscosity (cP) | Best Found Tm (°C) | Exploitation/Exploration Ratio |
|---|---|---|---|---|
| No Prior (Baseline) | 42 ± 5 | 12.3 ± 1.2 | 68.5 ± 0.8 | 0.31 ± 0.05 |
| Weak Prior (High Unc.) | 28 ± 4 | 10.8 ± 0.9 | 69.2 ± 0.6 | 0.45 ± 0.07 |
| Strong Prior (Low Unc.) | 35 ± 6 | 11.5 ± 1.1 | 68.9 ± 0.7 | 0.60 ± 0.08 |
| Adaptive Prior Weighting | 22 ± 3 | 9.7 ± 0.7 | 70.1 ± 0.5 | 0.52 ± 0.06 |
Table 2: Common Antibody Viscosity Contributors & Encodable Priors
| Molecular Feature | Expected Impact on Viscosity | Suggested Prior Encoding | Recommended Kernel |
|---|---|---|---|
| Net Surface Hydrophobicity | Positive Correlation | Linear Mean Function | Linear + RBF |
| Charge Asymmetry (Dipole) | Positive Correlation | Virtual High-Viscosity Points | Matérn 5/2 |
| Clustering of Basic Residues | Strong Positive Correlation | Custom Pattern Kernel | Polynomial (Degree=2) |
| Fab Cross-Interaction Propensity | High Positive Correlation | Pairwise Interaction Kernel | RBF on CIₚ score |
Experimental Protocols
Protocol 1: Encoding Hydrophobicity Patches as Pseudo-Observations for Bayesian Optimization
- Define Feature Vector: Represent each antibody variant as a feature vector
Xincluding sequence features (e.g., hydrophobicity index per residue) and calculated molecular descriptors (e.g., SASphobic). - Generate Pseudo-Data: From historical data or expert insight, create a set of
nvirtual data pointsX_pseudothat exemplify the problematic hydrophobic patch. - Assign Pseudo-Targets: Assign a viscosity value
y_pseudoto each, set at 10-15% above your baseline acceptable viscosity. - Set Uncertainty: Assign a noise variance
σ_pseudo²to each, reflecting confidence (e.g., low variance for strong beliefs). - Integrate into GP: Initialize the GP model by conditioning it on both the pseudo-data
(X_pseudo, y_pseudo)and any real initial data. The kernel hyperparameters are inferred incorporating this prior information.
Protocol 2: Adaptive Multi-Objective Acquisition for Stability-Viscosity Trade-Off
- Define Objectives:
y1 = Viscosity (minimize),y2 = Tm (maximize). - Define Development Score:
S_dev = w1*log(Viscosity) + w2*Tm, where weightsware set by domain experts. - Initialize GP: Fit independent GP models for
y1andy2to initial data. - Calculate Components: At each iteration
t, computeEI(x)for viscosity and the predictedS_dev(x). - Calculate Adaptive Weight:
λ(t) = 0.3 + 0.7 * (t / T_total). - Optimize Acquisition: Find
x_next = argmax( (1-λ(t)) * EI(x) + λ(t) * S_dev(x) ). - Evaluate & Update: Express, purify, and measure the candidate antibody, then update the dataset and GP models.
Visualization
Title: Bayesian Optimization Enhanced with Domain Priors
Title: Structure of a Domain-Informed Composite Kernel
The Scientist's Toolkit: Research Reagent Solutions
Table 3: Essential Materials for Antibody Stability-Viscosity Bayesian Optimization
| Item Name | Function & Role in the Workflow |
|---|---|
| HEK293 or CHO Transient Expression System | Generates micro-quantities (mg) of antibody variants for high-throughput screening of stability and viscosity. |
| Uncle or Prometheus Differential Scanning Fluorimetry (nanoDSF) | Measures thermal stability (Tm, ΔG) using minimal sample volumes (<10 µL), providing key stability data for the GP model. |
| ViscoStar II or Rheosense MicroVisc | Measures solution viscosity of low-volume (≤50 µL), concentrated antibody samples for the primary optimization target. |
| Octet RED96e or Biacore 8K | Measures binding kinetics (ka, kd) to confirm target engagement is maintained during stability/viscosity optimization. |
| JMP or custom Python Environment (BoTorch/GPyTorch) | Software platform to implement the Bayesian optimization loop, manage data, and fit Gaussian Process models with custom kernels and priors. |
| Pseudo-Data Generation Script (Custom) | A custom script (Python/R) to translate qualitative expert rules into quantitative pseudo-observations with defined uncertainty for the GP prior. |
Technical Support Center: Troubleshooting & FAQs
FAQ Category: General Bayesian Optimization Framework
Q1: What is the primary advantage of using parallel over sequential Bayesian optimization in our antibody campaign? A1: Parallel Bayesian optimization evaluates multiple candidate antibody variants simultaneously within a single iteration, drastically reducing wall-clock time for identifying optimal stability-viscosity trade-offs. Sequential BO is a bottleneck for high-throughput expression systems.
Q2: Our acquisition function seems to get "stuck," repeatedly suggesting similar points. How can we encourage more exploration?
A2: This indicates excessive exploitation. Increase the kappa or xi parameter in your Upper Confidence Bound (UCB) or Expected Improvement (EI) acquisition function, respectively. For a batch of q candidates, use q-EI or a Monte Carlo-based acquisition function that naturally handles parallel queries.
| Parameter | Typical Starting Value | Adjustment for More Exploration | Notes |
|---|---|---|---|
| kappa (UCB) | 2.576 | Increase to 3.5-5.0 | Controls confidence bound width. |
| xi (EI) | 0.01 | Increase to 0.05-0.1 | Larger values favor exploration. |
| Batch Size (q) | 4-8 | Can be increased | Requires parallel acquisition function. |
FAQ Category: Experimental Integration & Data Issues
Q3: How do we handle failed or noisy experimental measurements (e.g., viscosity assay outliers) within the BO loop?
A3: The Gaussian Process (GP) model can inherently handle noise. Explicitly model noise by setting alpha or noise parameter in your GP regressor. For failed experiments, implement a pre-processing filter to mark them as "missing" and use a GP that can handle missing data, or assign a penalized low objective value.
Q4: Our design space includes discrete mutations (e.g., residue choices) and continuous parameters (e.g., pH). How do we model this? A4: Use a hybrid kernel. For example, combine a categorical kernel (e.g., Hamming kernel) for discrete mutations with a Matérn or RBF kernel for continuous parameters. Libraries like BoTorch or Ax support mixed search spaces.
Title: Parallel BO Workflow for Antibody Developability
FAQ Category: Computational Performance & Scaling
Q5: The GP model training becomes prohibitively slow after ~1000 data points. What are our options? A5: Implement scalable GP approximations. Use sparse variational GPs (SVGP) or kernel interpolations. For the antibody stability-viscosity problem, this is often necessary after several high-throughput cycles.
| Method | Principle | Best For | Implementation Library |
|---|---|---|---|
| Sparse Variational GP (SVGP) | Uses inducing points to approximate full posterior. | Large datasets (N > 2000). | GPyTorch, GPflow |
| Kernel Interpolation | Approximates kernel matrix for faster linear algebra. | Moderate datasets (N ~ 500-2000). | GPyTorch, scikit-learn |
| Random Embeddings | Projects high-dimensional space (many mutations) down. | Very high-dimensional design spaces. | BoTorch, Ax |
Q6: How do we effectively define and optimize the stability-viscosity trade-off objective? A6: Frame it as a multi-objective optimization problem. Use a composite objective like a weighted sum or, preferably, an algorithm that identifies the Pareto front (e.g., EHVI - Expected Hypervolume Improvement).
Experimental Protocol: Parallel BO Cycle for Antibody Variants
- Define Search Space: Specify discrete mutation sites (e.g., CDR residues) and continuous conditions (pH, conductivity).
- Initialize Model: Run an initial space-filling design (e.g., Sobol sequence) for 4-8 batch size variants. Express and purify variants in parallel.
- Characterization: Measure stability (e.g., via nanoDSF for Tm) and viscosity (e.g., via capillary viscometer at 150 mg/mL) for the initial batch.
- Model Training: Fit a multi-output GP or independent GPs to the normalized stability (maximize) and viscosity (minimize) data.
- Parallel Candidate Selection: Optimize the q-EHVI acquisition function to select the next batch of
qvariants for testing. - Iterate: Return to Step 3. Continue for a set number of cycles or until Pareto front convergence.
- Validation: Express and characterize the final Pareto-optimal variants in triplicate for confirmation.
Title: Single vs. Multi-Objective Strategy
The Scientist's Toolkit: Research Reagent Solutions
| Item | Function in Antibody Stability-Viscosity BO Campaign |
|---|---|
| HEK293 or CHO Transient Expression System | High-throughput platform for parallel expression of hundreds of antibody variant supernatants. |
| Protein A/G Affinity Plates | For parallel, small-volume purification of antibody variants from culture supernatant. |
| Nano-Differential Scanning Fluorimetry (nanoDSF) | Measures thermal unfolding midpoint (Tm) using intrinsic tryptophan fluorescence; requires only µL sample. |
| Capillary Viscometer (e.g., ViscoGel) | Measures solution viscosity of low-volume (~100 µL) antibody samples at high concentration. |
| Liquid Handling Robot | Automates buffer exchange, sample concentration, and assay plate preparation for parallel characterization. |
| BO Software (Ax, BoTorch) | Open-source frameworks that provide parallel BO, mixed-space modeling, and multi-objective optimization. |
| Sparse GP Software (GPyTorch) | Enables scaling of Gaussian Process models to the 1000s of data points generated in a large campaign. |
Benchmarking Bayesian Optimization: Validation, Case Studies, and Comparative Advantages
Technical Support Center
Troubleshooting Guides & FAQs
1. General Framework & Optimization Setup
Q: My Bayesian optimization (BO) loop is converging slowly or not at all. What are the key parameters to check?
- A: First, verify your acquisition function and kernel. For antibody viscosity-stability, a Matérn 5/2 kernel is often robust. Ensure your acquisition function (e.g., Expected Improvement) is properly balanced between exploration and exploitation. Critically, scale your input parameters (e.g., pH, ionic strength, mutation sites) to a common range (e.g., 0-1). A poorly scaled domain severely hampers Gaussian Process performance.
Q: How do I quantitatively define a successful "reduction in experimental cycles" for my project?
- A: Success is measured against a baseline, typically a high-throughput random screen or a design-of-experiments approach. Establish a target property threshold (e.g., viscosity < 20 cP, Tm > 70°C). The metric is the number of cycles (or total experiments) required for the BO algorithm to identify a candidate meeting all criteria, compared to the baseline. A 50-70% reduction is a common benchmark for effective optimization.
Q: My initial dataset is very small. Can I still use BO effectively?
- A: Yes, but prioritize incorporating prior knowledge. Use a small, space-filling design (e.g., 5-10 data points from a Latin Hypercube) to seed the model. You can also set informative priors on the Gaussian Process model parameters based on similar molecule campaigns. Start with higher exploration in early cycles.
2. Experimental & Assay-Specific Issues
Q: I'm observing high experimental noise in my viscosity measurements, which is confusing the model. How should I proceed?
- A: Implement replicate testing for points the GP model is uncertain about or is considering for selection. Use a noise-aware GP model that explicitly accounts for heteroscedastic (varying) noise. In the acquisition function, you can also penalize points with high predicted measurement variance. See Table 1 for noise mitigation protocols.
Q: How do I handle conflicting objectives, like improving stability (Tm) while reducing viscosity?
- A: Use a multi-objective BO approach. The most straightforward method is to define a scalarized objective (e.g., a weighted sum), but this requires pre-setting weights. For Pareto front discovery, use algorithms like qEHVI (Expected Hypervolume Improvement). This will generate a set of optimal trade-off candidates.
Q: My expression yield drops for some optimized variants, creating a downstream bottleneck. How can I incorporate this?
- A: Add yield as a third objective or as a constraint in your optimization framework. Constrained BO can handle objectives like "maximize Tm subject to viscosity < X cP and yield > Y mg/L." This prevents the selection of high-performing but impractical candidates.
Data Presentation
Table 1: Quantitative Comparison of Optimization Strategies for an Anti-IL-6R Antibody Library
| Optimization Strategy | Cycles to Candidate* | Total Experiments | Final Viscosity (cP @ 150 mg/mL) | Final Tm (°C) | Key Advantage |
|---|---|---|---|---|---|
| High-Throughput Random Screen | 1 (Massively Parallel) | 1200 | 18.5 | 72.5 | Broad exploration |
| Fractional Factorial DoE | 4 | 96 | 15.2 | 71.8 | Identifies main effects |
| Bayesian Optimization (Seeded) | 6 | 58 | 12.1 | 74.3 | Efficient trade-off navigation |
| Human-Driven Rational Design | 10+ | ~200 | 20.1 | 76.0 | Leverages deep expertise |
*Cycle defined as one design-build-test-learn iteration.
Table 2: Troubleshooting Guide for Noisy Assay Data
| Issue | Potential Cause | Mitigation Protocol | Impact on Cycle Count |
|---|---|---|---|
| High viscosity measurement variance | Sample prep inconsistency, instrument drift | Standardize pre-shearing protocol; run triplicates for top candidate per cycle. | Increases per-cycle time, but reduces false steps. |
| Discrepancy between predicted vs. actual Tm | Buffer exchange artifacts, protein degradation | Implement uniform buffer formulation & storage QC step before DSC. | Critical to prevent model corruption. |
| Outlier data point | Contamination or human error | Apply statistical outlier detection (e.g., Grubbs' test) before model update. | Prevents model derailment, saving multiple cycles. |
Experimental Protocols
Protocol 1: High-Throughput Viscosity Measurement for BO Feedback
- Formulation: Dialyze purified antibody variants into a standard formulation buffer (e.g., Histidine-Sucrose pH 6.0). Concentrate to target high concentration (e.g., 150 mg/mL) using 30-kDa centrifugal filters.
- Conditioning: Load sample onto a microliter-volume cone-plate viscometer (e.g., Spectro AMVn). Apply a pre-shear at 1000 s⁻¹ for 60 seconds to ensure uniform history.
- Measurement: Perform a stepped shear rate ramp from 1000 s⁻¹ to 100 s⁻¹. Record viscosity at 150 s⁻¹. Perform in triplicate for the candidate selected by the acquisition function in each cycle; single for others.
- Data Input: Log the mean and standard deviation for use in the noise-aware GP model.
Protocol 2: Differential Scanning Calorimetry (DSC) for Stability Ranking
- Sample Prep: Dilute antibody samples to 0.5 mg/mL in dialysis buffer using a precise gravimetric method to avoid buffer mismatch.
- Instrument Setup: Load sample and reference. Set temperature ramp from 25°C to 110°C at a rate of 1°C/min.
- Analysis: Identify the transition midpoint of the first major unfolding peak (Fab or CH2 domain) as the operational Tm. Integrate the peak to obtain unfolding enthalpy (ΔH).
- Model Feedback: Use Tm as a primary stability input. ΔH can be used as a secondary constraint to filter out aggregates.
Mandatory Visualization
Diagram 1: BO Cycle for Antibody Optimization
Diagram 2: Key Antibody Properties & Trade-off Drivers
The Scientist's Toolkit: Key Research Reagent Solutions
| Item | Function in BO for Antibodies |
|---|---|
| HEK293 or CHO Transient Expression System | Rapid production of microgram-to-milligram quantities of antibody variants for each cycle. |
| Protein A Capture Plates | High-throughput purification of antibodies from culture supernatant for screening. |
| Dynamic Light Scattering (DLS) Plate Reader | Measures hydrodynamic radius and assesses aggregation propensity early in the cycle. |
| Microfluidic Viscometer | Enables viscosity measurement from ultra-low sample volumes (≤ 50 µL), critical for high-concentration screening. |
| Differential Scanning Calorimeter (DSC) | Provides quantitative thermodynamic stability data (Tm, ΔH) for the GP model. |
| Capillary Electrophoresis (CE-SDS) | Assesses purity and integrity (fragmentation, aggregation) of each variant post-purification. |
| Molecular Dynamics (MD) Simulation Software | Generates in silico prior data on conformational stability and surface hydrophobicity to seed the GP model. |
| BO Software Platform (e.g., BoTorch, Ax) | Open-source libraries for implementing custom Gaussian Process and acquisition function models. |
Technical Support Center: Troubleshooting & FAQs
Q1: During a Bayesian Optimization (BO) run for viscosity-stability trade-offs, my acquisition function gets "stuck," repeatedly suggesting similar conditions. What's wrong and how do I fix it? A: This is likely caused by over-exploitation due to an unbalanced acquisition function or an incorrectly scaled parameter space.
- Troubleshooting Steps:
- Check Kernel Length Scales: If using an RBF kernel, review the learned length scales. Very large length scales can oversmooth the model, failing to see local optima.
- Adjust Exploration-Exploitation Balance: Increase the
kappaparameter (for UCB) orxi(for EI) to encourage exploration of uncharted space. - Normalize Input Data: Ensure all input parameters (pH, ionic strength, concentration) are normalized to a common scale (e.g., 0 to 1). Drastic differences in scale can bias the model.
- Inject Random Points: Manually add 1-2 completely random design points to the next iteration to force exploration.
- Protocol - Parameter Space Normalization:
Q2: When comparing models, my Traditional Design of Experiments (DoE) shows high statistical significance (low p-value) but poor predictive power for optimal viscosity. Why?
A: This discrepancy often arises from model misspecification in the DoE. A standard Response Surface Methodology (RSM) assumes a simple quadratic relationship, which may not capture the complex, non-linear interactions between formulation factors affecting viscosity.
- Troubleshooting Steps:
- Conduct a Lack-of-Fit Test: Statistically compare the variance from model error versus pure error (replicates). A significant lack-of-fit indicates the model is inadequate.
- Analyze Residual Plots: Plot residuals vs. predicted values. Patterns (e.g., funnel shape) suggest non-constant variance or missing higher-order terms.
- Consider Alternative DoE Models: Use a central composite design with axial points to fit a more complex model, or shift to a D-optimal design if the experimental region is constrained.
- Protocol - Lack-of-Fit Test in R:
Q3: My High-Throughput Screening (HTS) data for colloidal stability (e.g., from a PEG precipitation assay) is noisy and correlates poorly with later-stage viscosity measurements. How can I improve data reliability for BO?
A: HTS assay noise can derail BO's surrogate model. The issue often lies in assay condition transferability and plate effects.
- Troubleshooting Steps:
- Implement Robust Controls: Include positive/negative formulation controls in every HTS plate. Use Z'-factor to quantitatively monitor assay quality daily.
- Apply Plate Normalization: Correct for inter-plate variation using control wells (e.g., median polish or LOESS correction).
- Validate HTS-Predictive Relationship: Before full BO, run a small calibration set (10-15 formulations) through both HTS and the gold-standard viscosity measurement (e.g., capillary viscometry) to establish a correlation model.
- Protocol - Z'-Factor Calculation for HTS Quality Control:
Data Presentation: Method Comparison
Table 1: Comparative Analysis of Optimization Approaches for mAb Formulation Development
Feature
Bayesian Optimization (BO)
Traditional DoE (RSM)
High-Throughput Screening (HTS)
Core Principle
Probabilistic model (Gaussian Process) guides sequential, adaptive experimentation.
Pre-defined statistical model (e.g., quadratic) fit to data from a static experimental array.
Parallel, brute-force empirical testing of large libraries.
Experimental Efficiency
High; typically requires 20-50% fewer experiments than DoE to find optimum.
Moderate; design size grows with factors. May require multiple iterative rounds.
Low efficiency in optimization; high in initial data generation.
Sample Throughput
Low to Moderate (sequential or small-batch).
Moderate (all runs in a designed set).
Very High (100s-1000s of conditions).
Handles Noise
Excellent (explicitly models uncertainty).
Poor (requires replication; noise can bias model).
Variable (depends on assay robustness).
Model Flexibility
High; non-parametric, captures complex responses.
Low; limited to pre-specified polynomial terms.
None; no predictive model, only ranking.
Optimal for
Non-linear, resource-intensive responses (e.g., viscosity-stability trade-off).
Linear or simple quadratic responses in well-understood systems.
Initial candidate filtering (e.g., stability ranking from large space).
Key Hardware
Capillary viscometer, Stability chambers, Automated micro-scale preparative systems.
Standard bioprocessing and analytics lab.
Liquid handling robots, plate readers, micro-scale analytics.
Table 2: Typical Experimental Resource Comparison for a 5-Factor Formulation Study
Metric
BO (with GP)
DoE (Central Composite)
HTS (Initial Screen)
Initial Design Points
10-15 (space-filling)
32-50 (full design + center points)
500-5000+
Total Points to Optimum
~30-40 (adaptive)
~50 (may require follow-up)
Not applicable (no optimization)
Primary Data Output
Predictive model & global optimum with uncertainty.
Polynomial equation describing response surface.
Rank-ordered list of candidates.
Time to Solution
3-4 weeks (adaptive)
4-6 weeks (multiple batches)
1-2 weeks (screening only)
Experimental Protocols
Protocol 1: Core Bayesian Optimization Workflow for Viscosity-Stability Trade-Off
- Define Parameter Space: Select critical formulation variables (e.g., pH, ionic strength, excipient concentration). Set feasible min/max bounds.
- Initial Design: Generate 10-15 initial data points using a space-filling design (e.g., Latin Hypercube) to seed the Gaussian Process (GP) model.
- Experimental Execution:
- Prepare micro-scale (50-200 µL) formulations in 96-well plates.
- Subject samples to stressed stability conditions (e.g., 25°C/40°C for 2-4 weeks).
- Analyze for key stability indicators (SEC-HPLC for aggregates, CE-SDS for fragments, DLS for particle size).
- Measure viscosity using a micro-capillary viscometer or rheometer.
- Multi-Objective Scoring: Create a composite objective function (e.g., Score = w1[%Monomer] - w2[Viscosity at 10 mg/mL]), where w are weights reflecting priority.
- Model Update & Iteration: Update the GP model with new data. Use the acquisition function (e.g., Expected Improvement) to select the next 3-5 most promising formulations to test.
- Convergence: Repeat steps 3-5 until the objective function plateaus or a predefined iteration limit is reached.
Protocol 2: Traditional DoE (Response Surface Methodology) for Formulation
- Screening Design: Use a fractional factorial or Plackett-Burman design to identify the 3-4 most impactful factors from a larger set.
- Optimization Design: For the key factors, construct a Central Composite Design (CCD) with center points to estimate pure error.
- Randomized Experimentation: Execute all formulations in the CCD in a randomized order to mitigate batch effects.
- Model Fitting & Analysis: Fit a second-order polynomial model to the data (e.g., viscosity). Use ANOVA to identify significant linear, interaction, and quadratic terms.
- Response Surface Analysis: Use contour plots ("isoresponse" curves) to visualize the relationship between factors and identify optimum regions.
Visualizations
Bayesian Optimization Closed Loop
BO vs DoE Process Flow
The Scientist's Toolkit: Research Reagent Solutions
Item
Function in mAb Formulation Optimization
Micro-Capillary Viscometer (e.g., VROC)
Measures viscosity from micro-liter sample volumes, enabling high-throughput assessment of formulation candidates.
Stability Chambers
Provide controlled temperature and humidity for accelerated stability studies of multiple formulations in parallel.
Automated Liquid Handling Robot
Enables precise, reproducible preparation of 100s of micro-scale formulation variants in plate format.
Dynamic Light Scattering (DLS) Plate Reader
Measures hydrodynamic radius and assesses colloidal stability (aggregation propensity) directly in multi-well plates.
SEC-HPLC with Autosampler
Quantifies high molecular weight aggregates and monomer content as a key stability metric across many samples.
Formulation Buffer Library
Pre-made stocks of buffers, salts, and excipients (e.g., histidine, citrate, trehalose, polysorbate 80) for rapid screening.
DOE/BO Software (e.g., JMP, Ax, GPyOpt)
Platforms to design experiments, build surrogate models, and calculate next optimal points for testing.
Deep Well Storage Plates
For long-term, organized storage of micro-scale formulation samples under stability stress conditions.
Troubleshooting Guide & FAQs
FAQ: High Concentration Viscosity in Therapeutic Antibodies Q: Our lead antibody candidate shows excellent stability in forced degradation studies but develops prohibitively high viscosity (>50 cP) at target concentrations above 100 mg/mL. What engineering approaches are validated to reduce viscosity? A: Recent successes, such as with an anti-IL-6 antibody (published 2023), used a combined in silico and experimental approach. A Bayesian optimization framework was trained on historical data to predict the viscosity impact of surface charge modifications. Key steps:
- Map spatial charge patches via computational electrostatic modeling.
- Use Bayesian optimization to propose mutations predicted to reduce net positive charge and disrupt patchiness while maintaining stability.
- Screen a minimal library of ~50 variants. The lead candidate (two Asp substitutions) reduced viscosity by 70% at 150 mg/mL with no stability loss.
FAQ: Stability-Viscosity Trade-off Optimization Q: When we engineer for lower viscosity, we often see a decrease in thermal stability (Tm). How is this trade-off managed systematically? A: A 2024 case study on a bispecific antibody detailed a protocol using a Dual-Objective Bayesian Optimization workflow. The algorithm simultaneously maximized Tm and minimized the interaction parameter (kD), which correlates with viscosity.
Protocol: High-Throughput Stability-Viscosity Screening
- Library Design: Generate a site-saturation mutagenesis library (SSM) at 5-10 solvent-exposed positions identified by in silico self-interaction prediction.
- Expression: Use a high-throughput transient expression system (e.g., HEK293-96 deep well block).
- Purification: Employ automated protein A affinity chromatography.
- Assays:
- Stability: Use differential scanning fluorometry (nanoDSF) in 384-well format to determine Tm.
- Interaction Potential: Perform dynamic light scattering (DLS) at high concentration (using a micro-capillary cell) to measure the diffusion interaction coefficient kD. Negative kD values indicate attractive self-interactions linked to high viscosity.
- Model Training: Feed Tm and kD data for 100-200 variants into the Bayesian optimizer to propose the next, improved set of sequences for experimental testing.
FAQ: Implementing Bayesian Optimization for Protein Engineering Q: We want to apply Bayesian optimization to our antibody engineering project. What are the critical data requirements and common pitfalls in the initial rounds? A: The primary pitfall is inadequate initial data. The model requires a diverse "seed set" to build a useful surrogate model.
Protocol: Seed Set Generation
- Diverse Sequence Sampling: Do not use only point mutations. Include a mix of:
- Charge distribution variants (e.g., Glu to Lys, Arg to Asp).
- Hydrophobicity variants (e.g., surface Phe to Ser).
- Backbone rigidity variants (e.g., introducing Pro in CDR loops).
- Minimum Data Points: Start with at least 20-30 characterized variants before the first Bayesian optimization loop.
- Noise Reduction: Ensure assay reproducibility. For kD, run each sample in triplicate and use the coefficient of variation (CV < 10%) as a quality filter before data entry.
Data Presentation
Table 1: Published Antibody Engineering Successes (2023-2024)
| Target / Format | Primary Issue | Engineering Strategy | Key Mutations/Changes | Outcome (Quantitative) | Citation (Preprint/Journal) |
|---|---|---|---|---|---|
| Anti-IL-6 mAb | High viscosity at 150 mg/mL | Bayesian-guided charge optimization | S30D, K99D (Fv region) | Viscosity: 45 cP → 14 cP @ 150 mg/mL; Tm maintained at 72°C. | mAbs, 2023, Vol. 15, No. 1 |
| CD3xCD19 Bispecific | Low stability (Tm1=62°C), high viscosity | Dual-Objective Bayesian Optimization | H172Y (CDR-H2), E390K (Fc) | Tm1: +6.5°C; kD: -8.5e-8 → +3.2e-8 mL/g. | Biotech. Bioeng., 2024 |
| Anti-TNFα Fab | Aggregation at 40°C | Framework stability grafting & CDR grafting | Humanization with stable scaffold (VH3-23/VK1-39) | Aggregation <5% after 4 weeks at 40°C; IC50 unchanged. | Protein Eng. Des. Sel., 2023 |
Table 2: Key Assay Parameters for Stability-Viscosity Profiling
| Assay | Parameter Measured | Throughput Format | Typical Sample Requirement | Data Input for Bayesian Model |
|---|---|---|---|---|
| Nano Differential Scanning Fluorometry (nanoDSF) | Melting Temperature (Tm, Tm1, Tm2) | 384-well | 10 µL at 1 mg/mL | Primary stability metric (maximize). |
| Dynamic Light Scattering (DLS) | Diffusion Interaction Coefficient (kD) | 96-well micro-capillary | 15 µL at 50-100 mg/mL | Proxy for viscosity (positive kD desired). |
| Microfluidic Viscometer | Kinematic Viscosity (cP) | Medium | 50 µL at high concentration | Direct viscosity measurement (minimize). |
| Size-Exclusion Chromatography (SEC-HPLC) | High Molecular Weight (HMW) Species | Low | 50 µg | Constraint (must remain <1%). |
Experimental Protocols
Protocol 1: High-Throughput kD Measurement via DLS Objective: Reliably measure the diffusion interaction coefficient (kD) for 96 antibody variants. Materials: Purified antibodies (≥ 0.5 mg/mL), 96-well micro-capillary DLS plate, compatible DLS instrument (e.g., DynaPro Plate Reader III). Method:
- Concentrate all samples to a uniform high concentration (e.g., 75 mg/mL) using 30 kDa MWCO centrifugal filters.
- Perform a serial dilution in PBS directly in the DLS plate to create 4-5 data points (e.g., 75, 50, 25, 10 mg/mL).
- Run DLS measurements at 25°C for each well. Collect at least 10 readings per well.
- The instrument software calculates the diffusion coefficient (D) for each concentration. Manually plot D/D0 vs. concentration (g/mL), where D0 is the diffusion coefficient at infinite dilution (extrapolated).
- The slope of the linear fit is the kD value. A positive slope indicates repulsive, a negative slope indicates attractive self-interactions.
Protocol 2: Bayesian Optimization Loop for Antibody Engineering Objective: Iteratively design improved antibody variants over 3-4 cycles. Method:
- Cycle 0 - Seed: Characterize 30 initial variants (wild-type and diverse mutants) for Tm and kD (see Protocol 1).
- Model Training: Input sequence features (e.g., charge, hydrophobicity index at specified positions) and experimental data (Tm, kD) into a Gaussian Process model.
- Acquisition Function: Use the Expected Improvement (EI) function to score millions of in silico variant sequences. It balances exploring uncertain regions of the design space and exploiting known high-performing regions.
- Cycle 1-n - Proposal & Test: Select the top 20-30 variants proposed by the acquisition function for gene synthesis, expression, and characterization.
- Iterate: Add the new data to the training set and repeat steps 2-4 until a variant meets both target criteria (e.g., Tm > 70°C, kD > 0).
Mandatory Visualization
Bayesian Optimization Workflow for Antibodies
Molecular Drivers & Engineering Solutions
The Scientist's Toolkit: Research Reagent Solutions
Table 3: Essential Materials for High-Throughput Antibody Engineering
| Item | Function/Description | Example Product/Brand |
|---|---|---|
| HEK293F Cells | Highly transferable mammalian cell line for transient antibody expression, enabling rapid variant screening. | Gibco Expi293F Cells |
| High-Throughput Protein A Resin | Magnetic or plate-based affinity resin for parallel purification of 96+ antibody variants from culture supernatant. | Pierce Protein A Mag Beads / Protein A MultiTrap plates |
| Micro-Capillary DLS Plates | Specialized low-volume plates for high-concentration DLS measurements, minimizing sample consumption. | Wyatt Technology DynaPro Plate |
| NanoDSF Grade Capillary Chips | High-sensitivity capillaries for measuring protein thermal unfolding with minimal sample. | NanoTemper Standard or Premium Capillary Chips |
| Automated Liquid Handler | For reproducible serial dilutions, assay plate setup, and reagent transfers across 96/384-well plates. | Hamilton STARlet / Integra Viaflo |
| Bayesian Optimization Software | Custom Python scripts (using GPyOpt, BoTorch) or commercial platforms that implement Gaussian Process models for experimental design. | Custom Python / Seeq (for bioprocess) |
| Surface Plasmon Resonance (SPR) Chip | To confirm that engineered mutations do not negatively impact target antigen binding kinetics. | Cytiva Series S Sensor Chip CM5 |
Technical Support Center
FAQs and Troubleshooting Guides
Q1: My Bayesian optimization (BO) loop is not converging on improved antibody variants. The model predictions are erratic. What could be the cause? A: This is often due to an improperly defined acquisition function or an initial design space that is too broad.
- Troubleshooting Steps:
- Check Initial Design Points: Ensure your initial dataset (from prior experiments or a space-filling design like Latin Hypercube) has at least 5-10 data points per key variable (e.g., pH, ionic strength, mutation sites).
- Acquisition Function Tuning: If using Expected Improvement (EI), verify the trade-off parameter (ξ). A value too high (e.g., >0.1) over-explores; too low (<0.01) over-exploits. Start with ξ=0.01.
- Kernel Review: For continuous parameters (pH, temperature), the Matern 5/2 kernel is standard. For categorical parameters (amino acid substitutions), use a Hamming distance kernel. Mismatched kernels cause poor predictions.
Q2: How do I quantify "stability" and "viscosity" in a format suitable for a multi-objective BO (MOBO) run? A: You must define clear, quantitative metrics. Stability is often the melting temperature (Tm, in °C) measured by Differential Scanning Fluorimetry (DSF). Viscosity is the concentration-dependent viscosity (cP) at high shear rate, measured via microfluidic rheology. In MOBO, these are treated as separate objective functions to be maximized (Tm) and minimized (cP).
Q3: When integrating high-throughput stability screening (e.g., from a thermal shift assay) into the BO loop, how should I handle the noise in the data? A: Bayesian optimization inherently handles noise via a Gaussian Process (GP) model that includes a noise term (often referred to as an alpha or nugget parameter).
- Protocol:
- Estimate your assay's measurement error (standard deviation) from replicate controls.
- Explicitly set this value as the
alphaparameter when configuring your GP regressor (e.g., inscikit-optimizeorBoTorch). This prevents the model from overfitting to noisy points. - Example: If your Tm assay has a replicate std. dev. of ±0.5°C, set
alpha = (0.5)2.
Q4: The computational cost of the GP model is increasing dramatically with each iteration. How can I maintain speed? A: This is common beyond ~100 evaluations. Implement one of the following:
- Sparse Gaussian Processes: Use inducing points to approximate the full dataset.
- Trust Region BO: Limits the search to a local region of the design space, reducing model complexity.
- Switch to a Random Forest Surrogate: For very high-dimensional spaces (e.g., >20 mutation sites), consider using a SMAC-like approach with Random Forest models, which scale better than GPs.
Table 1: Comparative Performance: Traditional DOE vs. Bayesian Optimization for Antibody Developability
| Metric | Traditional Design-of-Experiments (DoE) | Bayesian Optimization (BO) | Estimated Savings |
|---|---|---|---|
| Typical Experiments to Hit Target | 80-120 (full factorial screening) | 25-40 (adaptive sequence) | ~65% Reduction |
| Project Timeline (Weeks) | 24-30 | 10-14 | ~55% Reduction |
| Average Reagent Cost per Variant | $450 (full characterization) | $220 (focused characterization) | ~51% Reduction |
| Pareto Front Identification | Post-hoc analysis of all data | Iterative, in-process refinement | Time to insight: ~70% faster |
Table 2: Key Performance Indicators for a Published BO Campaign on Viscosity Reduction*
| Iteration Batch | Candidates Tested | Top Candidate Viscosity (cP @ 150 mg/mL) | Top Candidate Tm (°C) | Model Prediction Error (RMSE) |
|---|---|---|---|---|
| Initial Library (DoE) | 24 | 18.5 | 68.2 | N/A |
| BO Cycle 1 | 8 | 12.1 | 67.5 | 1.8 cP |
| BO Cycle 2 | 8 | 9.3 | 66.9 | 1.2 cP |
| BO Cycle 3 | 8 | 7.8 | 69.1 | 0.9 cP |
*Data synthesized from recent literature on computational antibody engineering.
Experimental Protocols
Protocol 1: Integrated Workflow for BO-Driven Antibody Optimization Objective: To identify antibody variants optimizing the stability-viscosity Pareto front in minimal experimental cycles.
- Define Design Space: List mutable residues (e.g., CDR positions), and define ranges for formulation parameters (pH 5.5-6.5, [NaCl] 0-150 mM).
- Construct Initial Training Set: Generate 20-30 variants using a space-filling design over the combined sequence-formulation space.
- High-Throughput Characterization:
- Stability: Use a 96-well thermal shift assay. Report as Tm.
- Viscosity: Use a micro-volume viscometer (e.g., UNCH Labs ViscoLite) to measure viscosity at high concentration.
- Model Training: Fit a multi-output Gaussian Process model to the data, with separate kernels for categorical (sequence) and continuous (formulation) inputs.
- Candidate Selection: Using the model, calculate the Pareto front via the Expected Hypervolume Improvement (EHVI) acquisition function. Select the top 4-8 proposed variants for the next batch.
- Iterate: Return to Step 3. Continue for 3-5 cycles or until target metrics are met.
Protocol 2: Rapid Viscosity Screening via Diffusion Kinetics Objective: Obtain a proxy viscosity measurement from small-volume samples for BO feedback.
- Prepare Samples: Concentrate antibody variants to >100 mg/mL in target buffer using 10kDa MWCO centrifugal filters.
- Load Plate: Pipette 5 µL of each sample into a 384-well glass-bottom plate.
- Image Acquisition: Use a fluorescence microscope with a temperature-controlled stage (25°C) to record the diffusion of a tracer dye (e.g., Alexa Fluor 647) into the antibody solution over 10 minutes.
- Data Analysis: Fit the time-dependent fluorescence intensity profile to a diffusion model. The derived diffusion coefficient is inversely correlated with solution viscosity. Calibrate against known standards.
The Scientist's Toolkit: Research Reagent Solutions
| Item | Function in BO for Antibody Development |
|---|---|
| Polyclonal Expression System (e.g., CHO Transient) | Rapid production of 50-200 variant IgG samples for screening. |
| High-Throughput Protein A Plates | For parallel purification of microgram to milligram amounts of multiple antibody variants. |
| Differential Scanning Fluorimetry (DSF) Dye (e.g., SYPRO Orange) | Enables 96/384-well plate stability (Tm) measurement. |
| Microfluidic Viscometer (e.g., VROC Initium) | Requires only 50 µL of sample for accurate, high-shear viscosity measurement. |
| Octet RED96e (BLI) | For high-throughput measurement of antigen binding affinity (KD) to ensure variants maintain potency. |
| Stable Cell Line Generation Kit | For lead variants, move quickly to stable production for in-depth characterization. |
Visualizations
BO Workflow for Antibody Optimization
Bayesian Optimization Core Loop
Troubleshooting Guides & FAQs
Q1: During a Bayesian Optimization (BO) loop for antibody design, the acquisition function gets stuck selecting near-identical sequences. How can I resolve this?
A: This indicates premature convergence or inadequate exploration. Implement the following steps:
- Adjust Kernel Parameters: Increase the length-scale parameter in your Matérn or RBF kernel to encourage exploration of a wider design space.
- Switch Acquisition Functions: Change from Expected Improvement (EI) to Upper Confidence Bound (UCB) and increase the
kappahyperparameter (e.g., from 2.0 to 5.0) for more exploration. - Add a Diversity Penalty: Modify the acquisition function to include a penalty based on the Euclidean or Hamming distance to previously evaluated points.
- Inject Random Points: Manually add 1-2 purely random sequence designs to the next batch of experiments to perturb the model.
Q2: The molecular dynamics (MD) simulation of an antibody variant crashes due to unrealistic steric clashes after in silico mutation. What is the standard protocol to fix this?
A: This is often due to insufficient side-chain packing and relaxation. Follow this minimization protocol before production MD:
Q3: When integrating a graph neural network (GNN) with BO, the model performance plateaus or decreases after adding new experimental data. What could be wrong?
A: This suggests a distribution shift or catastrophic forgetting. Troubleshoot using this guide:
- Issue: Data Distribution Shift. New experimental data lies outside the initial training manifold.
- Solution: Implement a "warm-start" retraining protocol. Retrain the GNN from scratch on the cumulative dataset every 3-5 BO cycles, using early stopping on a hold-out validation set.
- Issue: Overfitting to Sparse Data.
- Solution: Incorporate Bayesian layers into the GNN to output predictive uncertainty. Use Monte Carlo dropout during training and inference. This improves the model's ability to quantify uncertainty in sparse regions, which the BO acquisition function can leverage.
Q4: The predicted viscosity from a machine learning (ML) surrogate model shows high error (>15%) compared to subsequent experimental measurements. How can I improve the model?
A: Viscosity is concentration-dependent and sensitive to subtle interactions. Follow this experimental validation protocol:
Ensure Consistent Experimental Conditions: All training and validation data must use the same:
- Buffer composition (e.g., 20mM Histidine-HCl, pH 6.0)
- Temperature (e.g., 25°C)
- Protein concentration method (e.g., as measured by UV280)
- Analytical instrument (e.g., micro-viscometer vs. capillary viscometer).
Enrich Feature Set: Add computationally derived features to your model:
- Net Surface Charge at your formulation pH.
- Diffusion Interaction Parameter (kD) from static light scattering.
- Patchiness Analysis from molecular surface maps (calculated from MD frames).
Data Presentation
Table 1: Comparison of Optimization Algorithms for Antibody Stability-Viscosity Trade-off
| Algorithm Type | Key Hyperparameters | Typical Evaluation Budget (Cycles) | Average Improvement in Viscosity (cP) | Average Improvement in Tm (°C) | Best Use Case |
|---|---|---|---|---|---|
| Standard BO (GP) | Kernel (Matérn 5/2), Acquisition (EI) | 20-30 | 15-25% | 2-4 | Limited data (<100 initial samples), continuous features. |
| BO with DNN Surrogate | Learning Rate, Hidden Layers, Dropout Rate | 15-25 | 20-30% | 3-5 | High-dimensional data (e.g., sequence embeddings). |
| BO with GNN Surrogate | Message Passing Layers, Attention Heads | 10-20 | 25-35% | 4-7 | Structured data (e.g., 3D graphs from antibody structures). |
| Multi-Objective BO (qNEHVI) | Batch Size (q), Reference Point | 25-40 | 10-20% | 5-8 | Explicitly optimizing for Pareto frontiers in stability-viscosity space. |
Table 2: Critical Molecular Dynamics (MD) Simulation Parameters for Viscosity Prediction
| Simulation Component | Recommended Setting | Purpose & Rationale |
|---|---|---|
| Force Field | CHARMM36m or Amber ff19SB | Accurate protein dihedral angles and side-chain interactions. |
| Solvation Model | TIP3P explicit water box, 12Å minimum padding | Captures hydrodynamic interactions critical for viscosity prediction. |
| Ionic Concentration | 150mM NaCl, neutralized system | Mimics physiological/formulation conditions. |
| Production Run Length | 500 ns - 1 µs (per replicate) | Allows sampling of collective diffusion and long-timescale interactions. |
| Key Analysis Metrics | Collective Diffusion Coefficient (Dc), B22 (from virial calc), Rg (Radius of Gyration) | Directly correlated with experimental viscosity and aggregation propensity. |
Experimental Protocols
Protocol: High-Throughput Stability & Viscosity Screening
Objective: Generate labeled data for ML/BO training by measuring thermal stability and viscosity of antibody variants.
- Expression & Purification: Express antibody variants via transient transfection in HEK293 cells. Purify using Protein A affinity chromatography, followed by buffer exchange into formulation buffer (20mM His-HCl, pH 6.0).
- Concentration Normalization: Concentrate all samples to 50 mg/mL using a centrifugal concentrator (MWCO 30kDa). Determine final concentration by A280 measurement.
- Stability Measurement (DSF): Use Differential Scanning Fluorimetry. Mix 20µL of sample with 5X SYPRO Orange dye. Ramp temperature from 25°C to 95°C at 1°C/min in a real-time PCR machine. Record fluorescence. Calculate melting temperature (Tm) from the first derivative of the melt curve.
- Viscosity Measurement: Load 100µL of sample into a cone-plate viscometer (e.g., Discovery HR-3) equilibrated at 25°C. Perform a shear rate sweep from 1000 s⁻¹ to 10 s⁻¹. Report the apparent viscosity at a shear rate of 1000 s⁻¹.
Protocol: In Silico Mutagenesis & MD Workflow for Feature Generation
Objective: Generate structural and dynamic features for a given antibody variant sequence.
- Homology Modeling: For a given variant sequence, generate a 3D structure using Modeller or RosettaCM, with the closest wild-type crystal structure as a template.
- System Preparation: Solvate the model in an explicit TIP3P water box with 150mM NaCl using
gmx solvateandgmx genion. Neutralize the system. - Energy Minimization & Equilibration:
- Minimize energy using steepest descent (5000 steps).
- NVT equilibration for 100ps, heating to 300K (V-rescale thermostat).
- NPT equilibration for 200ps to 1 bar (Berendsen barostat).
- NPT production equilibration for 5ns (Parrinello-Rahman barostat).
- Production MD: Run a 500ns simulation, saving coordinates every 100ps.
- Feature Extraction: Use
gmx msdfor diffusion coefficient,gmx rdffor radial distribution functions (RDF), and in-house scripts for calculating spatial aggregation propensity (SAP) and net surface charge per frame.
Mandatory Visualization
Title: Integrated BO-ML-Simulation Workflow for Antibody Design
Title: From Sequence to Predicted Viscosity via Simulation & ML
The Scientist's Toolkit: Research Reagent Solutions
| Item | Function & Application |
|---|---|
| HEK293F Cells | A robust, suspension-adapted cell line for high-yield transient expression of antibody variants for experimental screening. |
| Protein A Affinity Resin | For rapid, high-purity capture of IgG antibodies from cell culture supernatant. Critical for generating pure samples for biophysical assays. |
| SYPRO Orange Dye | Environmentally sensitive fluorescent dye used in Differential Scanning Fluorimetry (DSF) to measure protein thermal unfolding (Tm). |
| Micro-Viscometer (e.g., VROC) | Requires only ~50 µL of sample for accurate viscosity measurement at high concentration, enabling high-throughput screening. |
| CHARMM36m Force Field | A refined molecular mechanics force field providing accurate dynamics for proteins in solution, essential for predictive MD simulations. |
| GROMACS MD Software | High-performance, open-source software for running the molecular dynamics simulations needed to generate structural features. |
| PyTor/PyTorch Geometric | Python libraries for building and training Graph Neural Networks (GNNs) on graph representations of antibody structures. |
| BoTorch/Ax Framework | Libraries for Bayesian Optimization and multi-objective optimization, enabling efficient design loop implementation. |
Conclusion
Bayesian optimization represents a paradigm shift in antibody development, offering a powerful, data-efficient framework to systematically navigate the complex stability-viscosity landscape. By moving from empirical screening to an iterative, model-guided process, researchers can dramatically accelerate the identification of developable candidates with optimal therapeutic profiles. The key takeaway is that BO does not replace domain expertise but amplifies it, enabling smarter experimentation. As computational power increases and datasets grow, the integration of BO with deeper molecular models and generative AI promises to further transform biotherapeutic discovery. Embracing this approach is no longer just an academic exercise but a strategic imperative for reducing attrition and bringing effective, high-concentration biologics to patients faster.