Beyond Animal Testing: A Comprehensive Guide to 3D Skin Model Dendritic Cell Sensitization Assays
This article provides researchers, toxicologists, and drug development professionals with a detailed examination of 3D skin model dendritic cell (DC) sensitization testing.
Beyond Animal Testing: A Comprehensive Guide to 3D Skin Model Dendritic Cell Sensitization Assays
Abstract
This article provides researchers, toxicologists, and drug development professionals with a detailed examination of 3D skin model dendritic cell (DC) sensitization testing. It explores the foundational biology of epidermal dendritic cells (Langerhans cells) within reconstructed human epidermis (RHE), outlines step-by-step protocols for performing and interpreting the assay, addresses common troubleshooting and optimization challenges, and validates the method through comparative analysis with traditional animal tests and other in vitro alternatives. The content serves as a current, practical resource for implementing this key non-animal method for skin sensitization hazard identification.
The Biology of Sensitization: Understanding Dendritic Cell Function in 3D Reconstructed Human Skin
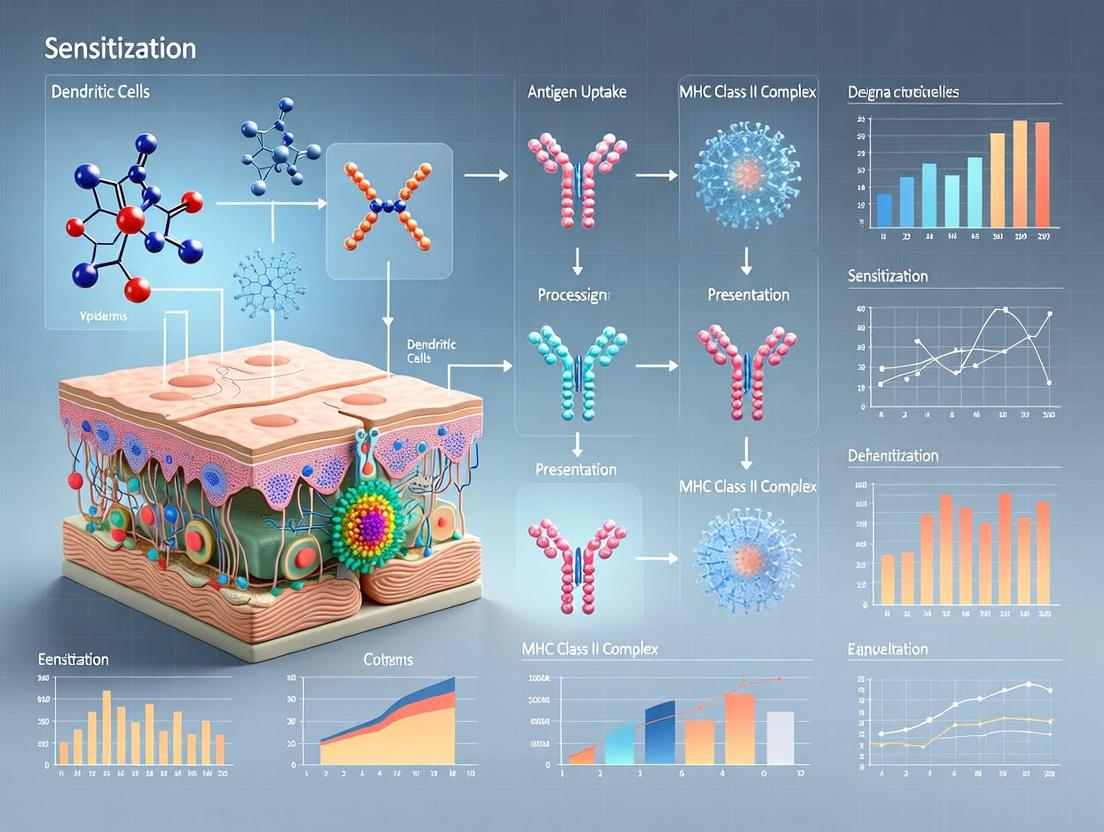
Skin sensitization is a key toxicological endpoint for chemical and drug safety assessment. The Adverse Outcome Pathway (AOP) framework provides a mechanistic understanding, linking a Molecular Initiating Event (MIE) through key biological events to an adverse outcome: allergic contact dermatitis. This Application Note details the principles, protocols, and contemporary tools for studying sensitization using advanced in vitro models, particularly focusing on 3D skin models with integrated dendritic cells, within the context of next-generation risk assessment.
The AOP for Skin Sensitization: A Structured Framework
The OECD-endorsed AOP for skin sensitization is a cornerstone for non-animal testing strategies. It outlines a sequence of measurable key events (KEs).
Table 1: Key Events in the Skin Sensitization AOP
| Key Event (KE) | Biological Description | Common In Vitro Assays / Readouts |
|---|---|---|
| KE1: Molecular Initiating Event | Covalent binding of electrophilic chemicals to skin proteins (haptenation). | Direct Peptide Reactivity Assay (DPRA), amino acid depletion. |
| KE2: Keratinocyte Response | Inflammation, gene expression associated with specific cell signaling pathways (e.g., Nrf2, NF-κB). | KeratinoSens (ARE-Nrf2 luciferase), LuSens, IL-8/IL-18 secretion. |
| KE3: Dendritic Cell (DC) Activation | Phenotypic maturation (upregulation of surface markers) and functional maturation (cytokine release) of dendritic cells. | h-CLAT (CD86, CD54), U937-SENSI (CD86, CD54), IL-8 secretion from DC. |
| KE4: T-cell Proliferation | Activation and clonal expansion of allergen-specific T lymphocytes. | T-cell priming assays (e.g., from lymph nodes in mice), not fully replaced in vitro. |
| Adverse Outcome | Allergic Contact Dermatitis (ACD) in humans. | Diagnostic patch test (human). |
Research Reagent Solutions Toolkit
Table 2: Essential Materials for 3D Skin Model DC Sensitization Testing
| Item / Reagent | Function / Explanation |
|---|---|
| Reconstructed Human Epidermis (RHE) or Full-Thickness Skin Models | Provides a physiologically relevant barrier and keratinocyte compartment for chemical application. Examples: EpiDerm, SkinEthic, EpiCS. |
| Immature Monocyte-Derived Dendritic Cells (MoDC) or Cell Lines (e.g., U937, THP-1) | Source of dendritic cells for integration into models; respond to sensitizers via activation markers. |
| Flow Cytometry Antibodies (anti-human CD86, CD54, HLA-DR, CD83) | Quantify DC surface maturation markers. Fluorochrome-conjugated for precise phenotyping. |
| Cytokine ELISA/Kits (IL-8, IL-1β, IL-18, TNF-α) | Measure secreted pro-inflammatory cytokines as functional markers of DC and keratinocyte activation. |
| Prototype Sensitizers & Non-Sensitizers (for Controls) | e.g., Sensitizers: DNCB, Cinnamaldehyde. Non-Sensitizers: Lactic Acid, Glycerol. Irritant: SDS. Essential for assay validation. |
| Cell Viability Assay (e.g., MTT, MTS, ATP-based) | Assess cytotoxicity of test chemicals; critical for interpreting activation data (response must be non-cytotoxic). |
| Chemical Delivery Vehicle (e.g., DMSO, Acetone:Olive Oil) | Solubilizes test chemicals for reproducible topical application on 3D models without damaging the stratum corneum. |
| Serum-Free Dendritic Cell Culture Media | Supports DC viability and function without inducing unwanted maturation via serum components. |
Detailed Experimental Protocols
Protocol 4.1: Integrated 3D Skin Model / Dendritic Cell Co-culture Sensitization Test
Objective: To assess the sensitization potential of a chemical by measuring dendritic cell activation following topical exposure on a reconstructed human epidermis model.
Materials:
- 3D RHE model (e.g., EpiDerm).
- Immature MoDCs or U937 cells differentiated to dendritic-like cells.
- Test chemical, vehicle control, positive control (e.g., 0.1% DNCB), negative control.
- Culture plates (6- or 24-well inserts).
- Flow cytometry buffer, antibodies, viability stain.
Method:
- Pre-conditioning: Equilibrate RHE models in assay medium for 1 hour at 37°C, 5% CO₂.
- Chemical Exposure:
- Dilute test chemical in appropriate vehicle (e.g., DMSO, then in medium). Ensure final vehicle concentration is non-cytotoxic (e.g., ≤1% DMSO).
- Gently apply 10-20 µL of the test solution topically to the surface of each RHE model. For irritant controls, use 1% SDS.
- Incubate for 24 ± 2 hours at 37°C, 5% CO₂.
- Co-culture Establishment:
- After exposure, carefully transfer the RHE model to a new well containing immature DCs (e.g., 1x10⁵ cells/well in a 24-well plate) in fresh medium.
- Ensure the basal side of the RHE is in contact with the medium bathing the DCs. Co-culture for an additional 24 hours.
- DC Harvest and Analysis:
- Collect the DC suspension from the basal compartment.
- Wash cells and stain with fluorochrome-conjugated antibodies against CD86 and CD54, plus a viability dye.
- Analyze by flow cytometry. Gate on live, single cells.
- Data Interpretation:
- Calculate the relative fluorescence intensity (RFI) or % positive cells for markers vs. vehicle control.
- Positive Criteria (based on h-CLAT): RFI of CD86 ≥ 150% and/or RFI of CD54 ≥ 200% at any non-cytotoxic concentration.
- Viability Threshold: Cell viability must be > 50% for data to be considered.
Protocol 4.2: Direct Peptide Reactivity Assay (DPRA)
Objective: To measure the molecular initiating event (KE1) by quantifying the depletion of cysteine and lysine synthetic peptides after chemical exposure.
Materials:
- Synthetic peptides: Ac-RFACAA-COOH (Cysteine) and Ac-RFAAKA-COOH (Lysine).
- Test chemical, positive control (Cinnamaldehyde for Cys, Hexyl Cinnamic Aldehyde for Lys), negative control.
- HPLC system with UV detector (220 nm).
- Phosphate buffer (0.1 M, pH 7.5 for Cys; pH 10.2 for Lys).
Method:
- Reaction Setup: Prepare 0.5 mM peptide solution in appropriate buffer. Mix peptide solution with test chemical (at 5 mM or lower non-precipitating concentration) in a 1:1 ratio (e.g., 100 µL each). Include peptide-only and chemical-only controls.
- Incubation: Incubate mixtures at 25°C for 24 hours.
- HPLC Analysis: Inject samples onto reverse-phase HPLC. Integrate the peak areas for the remaining peptide.
- Calculation:
% Depletion = [(Mean Peak Area peptide control - Mean Peak Area test sample) / Mean Peak Area peptide control] * 100- Calculate mean depletion for both cysteine and lysine peptides.
- Prediction Model:
- Calculate the combined mean depletion (Cys and Lys).
- Classification: > 6.38% = Sensitizer; ≤ 6.38% = Non-sensitizer (per OECD TG 442C).
Visualizations of Pathways and Workflows
Diagram 1: Skin Sensitization AOP Workflow
Diagram 2: 3D Model DC Co-culture Protocol
Diagram 3: Nrf2-Keap1 Pathway in Keratinocytes (KE2)
The Pivotal Role of Langerhans Cells in Epidermal Immune Surveillance
Within the thesis research on 3D skin model dendritic cells sensitization testing, Langerhans Cells (LCs) are the cornerstone epidermal antigen-presenting cells. Their pivotal role in immune surveillance—capturing, processing, and presenting haptens and allergens to naive T cells—makes them the primary target for in vitro sensitization assays. These Application Notes detail protocols for quantifying LC responses in reconstructed human epidermis (RHE) models, a critical step in predicting chemical sensitization potential without animal testing.
Table 1: LC Biomarker Expression Changes Following Sensitizer Exposure in 3D RHE Models
| Biomarker | Baseline Expression (MFI*) | Expression after Moderate Sensitizer (MFI*) | Fold Change | Key Function in Sensitization |
|---|---|---|---|---|
| CD1a | 150-300 | 450-900 | 3.0 | Hapten lipid complex presentation |
| HLA-DR | 200-400 | 800-1600 | 4.0 | Peptide antigen presentation to TCR |
| CD86 (B7-2) | 50-100 | 300-600 | 6.0 | T-cell co-stimulation signal |
| CCR7 | 10-30 | 100-200 | 10.0 | Migration towards lymph node chemokines |
| IL-18 | 5-15 pg/ml | 40-80 pg/ml | 8.0 | Inflammasome activation, Th1 polarization |
*MFI: Mean Fluorescence Intensity by flow cytometry of extracted LCs.
Table 2: Predictive Accuracy of LC-Based 3D RHE Sensitization Tests
| Test Method (Endpoint Measured) | Sensitivity (%) | Specificity (%) | Accuracy (%) | Reference Model |
|---|---|---|---|---|
| CD86 Upregulation (OECD TG 442E) | 89 | 85 | 87 | KeratinoSens / LuSens |
| IL-18 Secretion (IL-18 Luc assay) | 92 | 89 | 91 | GARDskin / h-CLAT |
| Multi-parametric (CD86, HLA-DR, CCR7) | 95 | 93 | 94 | SENS-IS / U-SENS |
Detailed Experimental Protocols
Protocol 1: Isolation and Phenotypic Analysis of LCs from Treated 3D RHE Purpose: To extract and characterize LCs from RHE following chemical exposure. Materials: See "Research Reagent Solutions" below. Procedure:
- Exposure: Apply 20 µL of test chemical (non-cytotoxic concentration, determined by MTT assay) topically to the RHE surface (n=3 tissues per group). Incubate for 24h at 37°C, 5% CO₂.
- Tissue Dissociation: Rinse tissues, incubate in Dispase II (2.4 U/mL, 4°C, 30 min) to separate epidermis. Minced epidermis is digested in RPMI-1640 containing Collagenase IV (1 mg/mL) and DNAse I (0.1 mg/mL) at 37°C for 90 min with agitation.
- Cell Extraction: Pass digest through 70 µm strainer. Wash cells in PBS/2% FBS.
- LC Enrichment: Use a CD1a+ LC magnetic bead isolation kit per manufacturer's instructions (purity >90% typical).
- Flow Cytometry: Stain enriched cells with fluorescent antibodies against CD1a-APC, HLA-DR-FITC, CD86-PE, CCR7-PE-Cy7. Use 7-AAD for viability. Acquire on a flow cytometer, analyzing at least 10,000 live singlet events.
- Analysis: Calculate Mean Fluorescence Intensity (MFI) fold change over vehicle control.
Protocol 2: Quantifying LC Migratory Capacity in a 3D Model Purpose: To assess CCR7-mediated LC migration from epidermis, a key event in sensitization. Procedure:
- Exposure & Culture: Treat RHE as in Protocol 1. After 24h exposure, transfer tissues to fresh medium containing CCL19 (200 ng/mL), the ligand for CCR7, in the lower chamber of a transwell system.
- Migration Assay: Culture for 48h. Collect cells that have migrated into the lower chamber and medium.
- Quantification: Count migrated CD1a+ HLA-DR+ cells by flow cytometry using counting beads. Express as a percentage of total LCs extracted from an identical, non-migrated control tissue.
Protocol 3: Cytokine Secretion Profiling Purpose: To measure soluble mediators released by LCs/RHE upon sensitizer challenge. Procedure:
- Conditioned Media Collection: After 24h chemical exposure on RHE, replace with fresh medium for a further 24h. Collect this conditioned medium.
- Multiplex Analysis: Analyze medium using a LEGENDplex human Th cytokine panel (or similar) for IL-18, IL-1β, IL-6, IL-8, IL-12p70, IL-23, TNF-α per kit protocol.
- Data Normalization: Normalize cytokine concentrations to total tissue protein content (via BCA assay).
Visualizations
The Scientist's Toolkit: Research Reagent Solutions
Table 3: Essential Materials for LC Research in 3D RHE Models
| Item | Function & Rationale |
|---|---|
| Reconstructed Human Epidermis (RHE) (e.g., EpiDerm, SkinEthic RHE) | In vitro 3D tissue with stratified epidermis and functional LCs. Provides a physiologically relevant microenvironment. |
| CD1a MicroBead Kit (human) | Magnetic-activated cell sorting (MACS) for the positive selection and enrichment of LCs from digested RHE for downstream analysis. |
| Anti-human CD1a, HLA-DR, CD86, CCR7 Antibodies (fluorochrome-conjugated) | Essential for phenotypic characterization of LC maturation state via flow cytometry. |
| Recombinant Human CCL19/MIP-3β | Chemokine ligand for CCR7. Used in migration assays to stimulate and quantify LC migratory capacity. |
| LEGENDplex Human Proinflammatory Chemokine Panel | Multiplex bead-based assay to quantify key cytokines (IL-18, IL-1β, etc.) from conditioned media with high sensitivity. |
| Dispase II (Neutral Protease) | Enzyme used to separate the intact epidermal sheet from the dermal equivalent or culture insert without damaging cell surface markers. |
| Collagenase IV | Further digests the epidermal sheet into a single-cell suspension for LC extraction. |
| Cell Counting Beads (flow cytometry) | Absolute quantification of cell populations (e.g., migrated LCs) without a hemocytometer. |
Within the broader thesis on dendritic cell (DC) sensitization testing using 3D skin models, the transition from traditional 2D monocultures to sophisticated 3D tissue equivalents represents a paradigm shift. Full-thickness (FT) and reconstructed human epidermis (RHE) models offer physiologically relevant platforms for assessing chemical sensitization, drug penetration, and inflammatory responses. These models recapitulate the stratified architecture of native skin, providing a more accurate microenvironment for resident immune cells, including Langerhans cells (LCs) and dermal dendritic cells.
Table 1: Comparative Analysis of 2D vs. 3D Skin Models for Immunotoxicity Testing
| Parameter | Traditional 2D Keratinocyte/Langerhans Cell Co-culture | Reconstructed Human Epidermis (RHE) | Full-Thickness (FT) Skin Model |
|---|---|---|---|
| Architectural Complexity | Monolayer; no stratification | Multi-layered, differentiated epidermis (stratum basale to corneum) | Fully differentiated epidermis plus a fibroblast-populated dermal compartment |
| Presence of Basement Membrane | Absent | Present (Type IV collagen, laminin) | Present and more mature |
| Langerhans Cell Integration | Co-cultured, non-native positioning | Integrated at suprabasal layers; dendritic morphology | Integrated at suprabasal layers; can include dermal dendritic cells in FT |
| Barrier Function (Transepidermal Electrical Resistance - TEER) | Low or not applicable | 2-4 kΩ·cm² (mimics in vivo) | 3-6 kΩ·cm² (often higher than RHE) |
| Key Endpoint for Sensitization (Typical IL-18 Secretion) | 50-200 pg/mL upon strong sensitizer exposure | 200-600 pg/mL upon strong sensitizer exposure | 300-800 pg/mL upon strong sensitizer exposure |
| Predictive Accuracy for Human Sensitization (LLNA concordance) | ~70% | ~85% (e.g., EpiSensA assay) | ~90% (potential for mechanistic integration) |
| Standardized Test Guideline | None | OECD TG 498 (Key Event 2) | Under validation (EFSA, ICCVAM) |
Table 2: Commercially Available 3D Skin Models for Dendritic Cell Research
| Model Name (Supplier) | Type | Contains Immune Cells? | Typical Culture Period | Primary Use in Sensitization |
|---|---|---|---|---|
| EpiDerm (MatTek) | RHE | Optional (LC-like cells available) | 12-18 days | Skin irritation, corrosion, sensitization (ET-50) |
| SkinEthic RHE (Episkin) | RHE | Can be integrated | 17 days | OECD TG 498, phototoxicity |
| LabCyte EPI-MODEL (Japan Tissue) | RHE | Standard or with MUTZ-3 derived LCs | 10-14 days | IL-8/IL-18 assays for sensitization |
| StrataTest (Stratatech) | FT | No (but can be co-cultured) | 14-21 days | Penetration, chronic toxicity |
| Full-Thickness Model (MatTek) | FT | No (but can be co-cultured) | 14-21 days | Sensitization, wound healing |
| Phenion FT (Henkel) | FT | Contains CD1a+ Langerhans Cells | 21-28 days | Gold standard for DC sensitization studies |
Detailed Application Notes
Langerhans Cell Maturation and Migration in FT Models
In the context of the sensitization thesis, the key advantage of FT models is the presence of a dermal compartment. This allows for the study of the complete "Langerhans cell cycle": from resting state in the epidermis, to antigen uptake and maturation, to migration through the basement membrane into the dermis. Metrics include:
- Upregulation of surface markers (CD86, CD83, HLA-DR) quantified via flow cytometry of cells emigrated from the model.
- Migration rate: Typically, 5-15% of integrated LCs emigrate from the epidermis after 24-48h exposure to a strong sensitizer like DNCB.
- Cytokine secretion profile: IL-18 is a key epidermal cytokine; FT models also allow analysis of dermal cytokines like IL-6, IL-8, and CCL2.
Barrier Integrity and Its Role in Sensitization Potency
The more robust barrier in 3D models, especially FT, allows for differentiation between sensitizers based on penetration kinetics. Protocols often pair sensitization endpoints with Transepidermal Electrical Resistance (TEER) and Transepidermal Water Loss (TEWL) measurements. A sensitizer that rapidly breaches the barrier (causing a >30% drop in TEER) often correlates with stronger DC activation.
Experimental Protocols
Protocol 1: Assessing Chemical Sensitization Using a Phenion FT Model with Integrated LCs
Objective: To evaluate the sensitizing potential of a test chemical by measuring DC activation markers and cytokine release. Materials: See "Research Reagent Solutions" below. Procedure:
- Pre-conditioning: Upon receipt, acclimate Phenion FT models in 6-well plates with 1.5 mL/well maintenance medium at 37°C, 5% CO₂ for 24h.
- Treatment:
- Negative Control: Apply 20 µL of vehicle (e.g., acetone:olive oil, 4:1) topically.
- Positive Control: Apply 20 µL of 0.1% DNCB (in vehicle).
- Test Article: Apply 20 µL of test chemical at 3 non-cytotoxic concentrations (determined by prior MTT assay).
- Incubate for 24h.
- Migration Assay:
- After 24h, transfer models to new plates with fresh medium.
- Incubate for an additional 48h to allow for DC migration.
- Harvest and Analysis:
- Emigrated Cells: Collect medium from the dermal compartment, pool with a PBS wash. Pellet cells, stain for CD1a, CD86, HLA-DR, and analyze by flow cytometry. Calculate the percentage of CD86+HLADRhi cells within the CD1a+ population.
- Cytokine Analysis: Use the remaining conditioned medium from step 4 to quantify IL-18, IL-6, and CCL2 via ELISA.
- Tissue Analysis: Fix models in formalin for histology (H&E) or snap-freeze for gene expression (e.g., CYP1A1, KEAP1).
Protocol 2: MUTZ-3 Derived Langerhans Cell Integration into RHE Models
Objective: To generate an immunocompetent RHE model for sensitization screening. Procedure:
- Differentiation of MUTZ-3 cells: Culture MUTZ-3 progenitor cells in medium supplemented with GM-CSF (100 ng/mL), TGF-β1 (10 ng/mL), and TNF-α (2.5 ng/mL) for 5-7 days to obtain LC-like cells (MUTZ-LC).
- Integration: Trypsinize a pre-cultured RHE model (e.g., LabCyte) to gently lift the epidermis. Seed 1-2 x 10⁵ MUTZ-LC cells onto the basal side of the epidermal construct. Culture air-liquid interface for 2-3 days to allow integration.
- Sensitization Test: Follow a topical application protocol similar to Protocol 1, focusing on IL-18 release (OECD TG 498) and surface marker analysis of cells recovered from the model by trypsinization.
Diagrams
Diagram Title: 3D Skin Sensitization Test Workflow
Diagram Title: Key Sensitization Pathways in 3D Skin
The Scientist's Toolkit: Research Reagent Solutions
Table 3: Essential Materials for 3D Skin DC Sensitization Assays
| Reagent/Material | Supplier Examples | Function in the Protocol |
|---|---|---|
| Phenion Full-Thickness Model with LCs | Henkel/Phenion | Provides a ready-to-use, immunocompetent 3D skin model with integrated, functional Langerhans cells. |
| MUTZ-3 Progenitor Cell Line | DSMZ | A renewable source for generating human Langerhans-like cells (MUTZ-LC) for integration into RHE models. |
| Recombinant Human GM-CSF, TGF-β1, TNF-α | PeproTech, R&D Systems | Cytokine cocktail required for the differentiation of MUTZ-3 cells into the LC phenotype. |
| Anti-human CD1a APC, CD86 PE, HLA-DR FITC Antibodies | BioLegend, BD Biosciences | Flow cytometry panel for identifying and assessing the activation state of Langerhans/dendritic cells. |
| Human IL-18 ELISA Kit | MBL, Invitrogen | Quantifies the key keratinocyte-derived cytokine predictive of sensitization potential (OECD TG 498). |
| 3D-Insert for 6-well plates (e.g., 0.9 cm²) | Greiner, CELLNTEK | Permeable support for the air-liquid interface culture essential for epidermal stratification. |
| Maintenance Medium (e.g., EPI-100-NMM-113) | MatTek, Phenion | Optimized, serum-free medium for the long-term health and differentiation of 3D skin models. |
| MTT Assay Kit (for Cytotoxicity) | Sigma-Aldrich, Roche | Determines non-cytotoxic concentrations of test chemicals prior to sensitization assays. |
Within the context of 3D skin model dendritic cell (DC) sensitization testing research, the reliable assessment of DC activation is paramount for predicting the skin sensitizing potential of chemicals and novel drug formulations. The activation status of DCs is characterized by the upregulation of specific cell surface markers and the secretion of soluble mediators. Among these, CD86, CD54 (ICAM-1), OX40L (CD252), and IL-8 (CXCL8) have been validated as key biomarkers correlating with the sensitization process. This application note details quantitative data, experimental protocols for their measurement, and essential reagents for integrating these assays into 3D epidermal models.
Quantitative Biomarker Data
The following table summarizes the typical expression profiles and functional relevance of the four key biomarkers in the context of DC activation within skin sensitization research.
Table 1: Key Biomarkers of Dendritic Cell Activation in Sensitization
| Biomarker | Alternate Name | Type | Primary Function in DC Sensitization | Typical Readout Method | Relative Upregulation (Strong Sensitizer vs. Control)* |
|---|---|---|---|---|---|
| CD86 | B7-2 | Surface Co-stimulatory Molecule | T-cell priming signal 2; essential for effector T-cell activation. | Flow Cytometry, Immunofluorescence | 3- to 8-fold |
| CD54 | ICAM-1 | Surface Adhesion Molecule | Enhances DC-T cell adhesion and immunological synapse formation. | Flow Cytometry, Immunofluorescence | 2- to 6-fold |
| OX40L | CD252 | Surface Co-stimulatory Molecule | Promotes survival and clonal expansion of activated T-cells. | Flow Cytometry, qPCR | 2- to 5-fold |
| IL-8 | CXCL8 | Secreted Chemokine/Cytokine | Recruits neutrophils and T-cells; amplifies inflammatory response. | ELISA, Luminex/MSD | 5- to 20-fold |
*Values are indicative ranges based on literature for human monocyte-derived DCs or DC-like cells within 3D models exposed to reference sensitizers (e.g., DNCB, NiSO₄). Actual fold changes depend on model system, sensitizer potency, and exposure time.
Experimental Protocols
Protocol 1: Flow Cytometric Analysis of Surface Markers (CD86, CD54, OX40L) from 3D Skin Model-Derived Cells
Objective: To isolate and quantify the expression of activation markers on DCs (Langerhans cells or dermal dendritic cells) from a reconstructed human epidermis (RHE) or full-thickness skin model after chemical exposure.
Materials:
- Treated and control 3D skin models.
- Dispase II solution (for RHE) or collagenase D solution (for full-thickness models).
- Cell dissociation medium (e.g., TrypLE).
- Flow cytometry buffer (PBS + 1% BSA + 0.1% sodium azide).
- Fluorescently conjugated antibodies: anti-CD86, anti-CD54, anti-OX40L, anti-HLA-DR, anti-CD1a/CD14 for DC gating, viability dye.
- Appropriate isotype controls.
- 70μm cell strainer.
- Flow cytometer.
Method:
- Model Exposure: Treat 3D skin models topically with test chemical, vehicle control, and reference sensitizer/irritant for 24-48h.
- Cell Isolation: a. Rinse models to remove residual chemical. b. For RHE: Incubate in Dispase II to separate epidermis. Mechanically dissociate epidermal sheet into single-cell suspension using TrypLE. c. For full-thickness models: Mince tissue and digest in collagenase D. Filter suspension through a 70μm cell strainer.
- Staining: a. Wash cells twice in flow buffer. b. Resuspend cells in buffer containing viability dye. Incubate 15 min, 4°C. c. Wash, then resuspend in Fc receptor blocking solution (optional) for 10 min. d. Add antibody cocktail (including DC lineage markers and activation markers). Incubate 30 min, 4°C, protected from light. e. Wash twice and resuspend in buffer for acquisition.
- Acquisition & Analysis: a. Acquire data on a flow cytometer. Collect a minimum of 10,000 events in the live cell gate. b. Gate on live, single cells, then on HLA-DR+/CD1a+ (epidermal) or HLA-DR+/CD14+ (dermal) DC populations. c. Analyze median fluorescence intensity (MFI) of CD86, CD54, and OX40L on gated DCs. Calculate fold change relative to vehicle control.
Protocol 2: Quantification of Secreted IL-8 via ELISA from 3D Skin Model Culture Supernatants
Objective: To measure IL-8 protein secretion as a soluble biomarker of DC/keratinocyte activation following sensitizer exposure.
Materials:
- Conditioned cell culture supernatant from treated 3D models.
- Human IL-8 ELISA kit (e.g., DuoSet or equivalent).
- Microplate reader capable of measuring absorbance at 450 nm (with 540/570 nm correction).
Method:
- Supernatant Collection: At the end of the exposure period (e.g., 48h), carefully collect the underlying culture medium from each 3D model without disturbing the tissue. Centrifuge to remove any debris. Store at -80°C if not used immediately.
- ELISA Procedure: Perform assay strictly according to manufacturer’s instructions. Typically: a. Coat plate with capture antibody overnight. b. Block plate for 1 hour. c. Add standards and undiluted/diluted samples to plate. Incubate 2 hours. d. Add detection antibody. Incubate 2 hours. e. Add streptavidin-HRP. Incubate 20 minutes. f. Add substrate solution. Incubate in the dark for 20 minutes. g. Add stop solution.
- Measurement & Analysis: a. Read absorbance at 450 nm (with wavelength correction). b. Generate a standard curve from the known IL-8 standards using a 4- or 5-parameter logistic curve fit. c. Interpolate sample concentrations from the standard curve. Report as pg/mL. Normalize to tissue viability (e.g., MTT assay) if required.
Diagram: Sensitization Pathway & Biomarker Induction
Diagram Title: DC Activation Pathway in Skin Sensitization
Diagram: Experimental Workflow for Biomarker Assessment
Diagram Title: 3D Model Biomarker Analysis Workflow
The Scientist's Toolkit: Research Reagent Solutions
Table 2: Essential Materials for DC Activation Studies in 3D Skin Models
| Item | Example Product/Catalog | Primary Function in Protocol |
|---|---|---|
| Reconstructed Human Epidermis (RHE) | EpiDerm (EPI-200), SkinEthic RHE | Gold-standard 3D tissue model containing keratinocytes and Langerhans cells for sensitization testing. |
| Reference Sensitizers | DNCB (1-Chloro-2,4-dinitrobenzene), NiSO₄ | Positive controls known to reliably induce DC activation and biomarker upregulation. |
| Cell Recovery Solution | Dispase II, Collagenase D | Enzymes for the non-trypsin dissociation of 3D models to preserve surface antigen integrity. |
| Fluorochrome-conjugated Antibodies | Anti-human CD86 (FITC/PE), CD54 (APC), OX40L (PE-Cy7), HLA-DR (V450), CD1a (PerCP-Cy5.5) | Panel for the identification and phenotyping of activated DCs via multicolor flow cytometry. |
| High-Sensitivity ELISA Kit | R&D Systems DuoSet ELISA Human CXCL8/IL-8 | For the accurate quantification of low-abundance IL-8 in small volume model supernatants. |
| Flow Cytometry Viability Dye | Zombie Aqua, LIVE/DEAD Fixable Near-IR | Distinguishes live cells from dead cells during analysis, critical for accurate MFI measurement. |
| Luminex/Multi-Array Assay | Meso Scale Discovery (MSD) U-PLEX Biomarker Group 1 | Multiplex platform for simultaneous quantification of IL-8 with other cytokines/chemokines from a single sample. |
| Data Analysis Software | FlowJo, GraphPad Prism | For advanced flow cytometry data analysis and statistical comparison of biomarker expression. |
OECD Test Guideline 442E (In Vitro Skin Sensitisation) was formally adopted in 2023, marking a pivotal shift from traditional animal testing (e.g., the murine Local Lymph Node Assay, LLNA) to defined approaches using New Approach Methodologies (NAMs). This guideline specifically addresses the assessment of skin sensitization potential using in chemico and in vitro methods within integrated approaches to testing and assessment (IATA). The core objective is to achieve a mechanistic understanding of the Adverse Outcome Pathway (AOP) for skin sensitization, encompassing four key events: covalent binding to skin proteins (Key Event 1), keratinocyte activation (Key Event 2), dendritic cell (DC) activation (Key Event 3), and T-cell proliferation (Key Event 4). OECD TG 442E validates the use of NAMs targeting these key events, moving regulatory decision-making towards non-animal, human biology-relevant models.
Application Notes: Integration of 3D Skin Model DC Sensitization Testing
The incorporation of 3D reconstructed human epidermis (RhE) models containing functional dendritic cells (e.g., LC-like cells) represents a cutting-edge NAM that can address multiple key events within a single, physiologically relevant system. This approach aligns with the push for next-generation risk assessment (NGRA).
Advantages of 3D Skin Model DC Systems
- Physiological Relevance: Mimics the human skin's stratified epithelium and immune component.
- Multiple Endpoint Readout: Allows concurrent assessment of cytotoxicity (Key Event 2/4), biomarker release (Key Event 2), and DC activation/migration (Key Event 3).
- Compatibility with Complex Materials: Can test insoluble, volatile, or formulated substances better than monolayer assays.
Key Quantitative Performance Metrics for NAMs under TG 442E
The following table summarizes recent validation data for established and emerging assays relevant to a 3D DC model context.
Table 1: Performance Metrics of Key In Vitro Skin Sensitization Assays (Aligned with AOP)
| Assay Name (OECD TG) | AOP Key Event Targeted | Measured Endpoint | Average Sensitivity (%) | Average Specificity (%) | Accuracy (%) | Reference Chemicals (n) |
|---|---|---|---|---|---|---|
| DPRA (442C) | KE1 | Peptide depletion | 89 | 78 | 84 | 145 |
| KeratinoSens (442D) | KE2 | Nrf2-mediated luciferase induction | 77 | 85 | 81 | 145 |
| h-CLAT (442E) | KE3 | DC surface markers (CD86, CD54) | 85 | 82 | 84 | 142 |
| U-SENS (442E) | KE3 | DC surface marker (CD86) | 80 | 82 | 81 | 142 |
| IL-8 Luc Assay (442E) | KE3 | IL-8 promoter activity | 78 | 80 | 79 | 142 |
| 3D Model DC Migration (Emerging) | KE3 | DC migration & biomarker (e.g., CD86) | ~75-82* | ~80-88* | ~78-85* | Varies |
Estimated performance range based on recent pre-validation studies (2023-2024).
Detailed Experimental Protocols
Protocol: Sensitization Assessment Using a 3D Epidermis Model with Integrated Dendritic Cells
Objective: To evaluate the sensitization potential of a test chemical by measuring Dendritic Cell activation and migration in a reconstructed human epidermis model.
Materials:
- 3D RhE model with integrated LC-like dendritic cells (e.g., SkinEthic RHE-LC, EpiDerm SIT, or equivalent lab-grown model).
- Test substance and vehicle control.
- Maintenance medium for the 3D model.
- Positive controls: 1% (v/v) Triton X-100 (cytotoxicity), 0.1% Dinitrochlorobenzene (DNCB, sensitizer).
- Negative control: Phosphate Buffered Saline (PBS).
- Migration assay insert (e.g., 3.0 µm pore size).
- ELISA kits: Human IL-8, CD86, or other relevant biomarkers.
- Histology equipment (fixative, paraffin, H&E stain).
- Immunohistochemistry (IHC) antibodies: anti-CD1a, anti-CD86.
Procedure:
Day 1: Treatment
- Pre-equilibration: Transfer 3D tissues to 6-well plates with pre-warmed maintenance medium. Incubate for 1 hour at 37°C, 5% CO₂.
- Dosing: Prepare test substance at three concentrations in vehicle (e.g., culture medium, DMSO <0.5%). Include positive and negative controls.
- Apply 20 µL of each test solution directly to the apical surface of each tissue (n=3 per condition). Ensure even distribution.
- Incubate tissues for 24 hours at 37°C, 5% CO₂.
Day 2: Analysis of DC Activation & Migration
- Medium Collection: Collect the underlying maintenance medium. Centrifuge to remove debris. Aliquot supernatant for cytokine analysis (IL-8 ELISA).
- Migration Assay Setup: Place a cell culture receiver plate containing chemotactic medium (e.g., with CCL19) beneath a migration insert.
- Tissue Transfer: Gently place the treated 3D tissue onto the filter of the migration insert, apical side up.
- Incubation: Incubate for 48 hours at 37°C, 5% CO₂ to allow DC migration.
- Harvest Migrated Cells: Collect cells that migrated into the receiver plate. Count viable cells using a trypan blue exclusion assay or flow cytometry (staining for CD45+/CD1a+).
- Biomarker Analysis: Analyze harvested migrated cells via flow cytometry for activation markers (CD86, CD54) or analyze receiver medium for secreted factors.
Day 3-4: Tissue Analysis
- Viability Assessment (MTT assay): Follow standard MTT protocol for 3D tissues to determine tissue viability relative to controls (Key Event 2/4).
- Histology & IHC: Fix tissues in formalin, embed in paraffin, and section.
- Stain with H&E for general morphology and cytotoxicity.
- Perform IHC for CD1a (LC marker) and CD86 (activation marker). Semi-quantify staining intensity and cell number in the epidermis.
Data Interpretation:
- A sensitizer will typically induce a dose-dependent increase in DC migration, upregulation of CD86 on migrated cells, and release of IL-8, without excessive cytotoxicity (>50% viability at effective concentrations).
- Data should be integrated with other Key Event information using a defined approach, such as a Bayesian network or integrated testing strategy (ITS) as endorsed by OECD TG 442E.
Visualizations
Skin Sensitization AOP and NAMs
3D Skin Model DC Assay Workflow
The Scientist's Toolkit: Research Reagent Solutions
Table 2: Essential Materials for 3D Skin Model DC Sensitization Research
| Item / Reagent | Function / Application in Protocol | Example Vendor/Product |
|---|---|---|
| 3D Reconstructed Epidermis with Langerhans Cells | Physiologically relevant test system containing keratinocytes and functional immune cells. | Episkin SM, SkinEthic RHE-LC, MatTek EpiDerm SIT (EPI-212-LC) |
| Defined Sensitizer & Non-Sensitizer Controls | Necessary for assay validation and batch quality control per OECD TG 442E. | DNCB (Strong Sensitizer), Nickel Sulfate (Moderate), Glycerol (Non-Sensitizer) |
| Cell Migration / Chemotaxis Assay Plate | To quantify DC migration from the epidermis towards a chemokine. | Corning Transwell inserts (3.0 µm pore), µ-Slide Chemotaxis (ibidi) |
| Flow Cytometry Antibody Panel | To phenotype migrated cells and measure activation markers (Key Event 3). | Anti-human CD1a-FITC, CD86-PE, CD54-APC, HLA-DR-PerCP |
| Pro-Inflammatory Cytokine ELISA Kits | Quantify keratinocyte (IL-18, IL-8) and DC-derived cytokines. | DuoSet ELISA Kits (R&D Systems), LEGENDplex assays (BioLegend) |
| IHC Antibodies for Skin Sections | Visualize and semi-quantify LC presence and activation state in situ. | Anti-CD1a (Abcam, clone EP3622), Anti-CD86 (Cell Signaling) |
| MTT or XTT Viability Assay Kit | Standardized measurement of tissue viability after chemical exposure. | MTT Cell Proliferation Assay Kit (Cayman Chemical) |
| OECD-Validated In Vitro Assay Kits | For generating data for Defined Approaches (e.g., DPRA, KeratinoSens). | Sensi-IP DPRA Kit (Gentian), KeratinoSens Assay Kit (Gentian) |
Step-by-Step Protocol: Performing a DC Sensitization Assay with 3D Skin Models
Within the thesis on "Advancing In Vitro Sensitization Testing Using 3D Skin Models with Integrated Dendritic Cells," the selection of an appropriate epidermal or full-thickness skin model is foundational. This choice directly impacts the reproducibility, biological relevance, and predictive capacity of assays designed to assess the sensitization potential of chemicals, cosmetics, and pharmaceuticals. Commercially available reconstructed human epidermis (RhE) models offer standardization and regulatory acceptance, while in-house (laboratory-developed) models provide flexibility for incorporating specific immune cell types, such as Langerhans cells or dendritic cell precursors. These Application Notes provide a comparative analysis and detailed protocols to guide researchers in model selection and experimental application for sensitization endpoint analysis.
Comparative Analysis of Key 3D Skin Models
Table 1: Comparison of Commercially Available 3D Skin Equivalents
| Feature / Model | EpiDerm (EPI-200) | SkinEthic RHE | LabCyte EPI-MODEL |
|---|---|---|---|
| Manufacturer | MatTek Corporation | Episkin (L'Oréal) | Japan Tissue Engineering Co. |
| Model Type | Reconstructed Human Epidermis (RhE) | Reconstructed Human Epidermis (RhE) | Reconstructed Human Epidermis (RhE) |
| Tissue Format | 24-well inserts, 0.6 cm² | 12-well inserts, 0.5 cm² | 24-well inserts, 0.6 cm² |
| Basal Layer | Normal human-derived epidermal keratinocytes (NHEK) | Normal human-derived epidermal keratinocytes | Normal human-derived epidermal keratinocytes |
| Differentiation | Multi-layered, stratum corneum | Multi-layered, stratum corneum | Multi-layered, stratum corneum |
| Standardized Assay | EpiDerm SIT (Skin Irritation Test) | SkinEthic RHE for irritation | Not specified for standard irritation |
| Key Sensitization Relevance | OECD TG 439 accepted for irritation; used in research for cytokine profiling (IL-18, IL-1α) post-sensitizer exposure. | OECD TG 439 accepted for irritation; used in mechanistic studies for gene expression (e.g., antioxidant genes). | Used in research for chemical penetration and metabolism studies relevant to pro-hapten formation. |
| Typical Cost per Tissue (USD) | ~$150 - $200 | ~$150 - $200 | ~$100 - $150 |
| Lead Time | 1-2 weeks upon order | 1-2 weeks upon order | 2-3 weeks upon order |
Table 2: In-House 3D Skin Model Options & Characteristics
| Parameter | Air-Liquid Interface (ALI) Model | Full-Thickness Model (Dermal Equivalent + Epidermis) | Immune-Competent Model (with LC/DC) |
|---|---|---|---|
| Base Components | NHEKs, Collagen-coated inserts, defined media. | NHEKs, Human dermal fibroblasts (HDFs), Collagen type I matrix. | NHEKs, HDFs, CD34+ progenitor cells or monocyte-derived dendritic cells. |
| Culture Duration | 10-14 days at ALI for stratification. | 7 days for dermal contraction + 10-14 days for epidermal culture at ALI. | 14-21 days total; immune cells added at progenitor stage (~day 7) or atop matured epidermis. |
| Key Advantage | Full control over keratinocyte source and culture conditions; lower cost per model. | Includes dermal component for studying fibroblast-keratinocyte crosstalk in sensitization. | Direct incorporation of antigen-presenting cells enables mechanistic study of the sensitization initiation phase. |
| Primary Challenge | High inter-lab variability; requires significant protocol optimization. | More complex and time-consuming; variable matrix contraction. | Maintaining immune cell viability and phenotype in the 3D structure is technically demanding. |
| Relevance to Thesis | Platform for testing novel endpoints (e.g., oxidative stress markers) before protocol transfer to commercial models. | Essential for studying the role of dermal fibroblasts in the inflammatory response to sensitizers. | Core model for directly tracking dendritic cell maturation (CD86, HLA-DR), migration, and T-cell priming assays. |
| Estimated Cost per Model | ~$20 - $50 (excluding labor) | ~$50 - $100 (excluding labor) | ~$100 - $200 (excluding labor & cell sourcing) |
Application Notes for Sensitization Testing
Note 1: Endpoint Selection Based on Model
- Commercial RhE (EpiDerm, SkinEthic): Ideal for high-throughput screening of chemical libraries using OECD-validated viability endpoints (MTT assay) and robust quantification of secreted cytokines (IL-18, IL-1α, IL-8) via ELISA or multiplex assays. Gene expression panels (e.g., Nrf2, ARE pathway genes) can be reliably performed.
- In-House Immune-Competent Models: Required for direct assessment of dendritic cell activation. Key endpoints include:
- Flow Cytometry: Analysis of CD80, CD83, CD86, HLA-DR surface markers on migrated or extracted dendritic cells.
- Migration Assay: Quantification of DC migration from the epidermis to a "dermal" or collection chamber using chemotactic gradients (e.g., CCL19, CCL21).
- Co-culture with Naïve T Cells: Measurement of T-cell proliferation (CFSE dilution) and polarization (Th1/Th2 cytokine secretion).
Note 2: Chemical Exposure Considerations
- Solvent Selection: Use non-cytotoxic concentrations of solvents (e.g., DMSO <1%, acetone:water 1:1). Pre-test solvent effects on barrier integrity (Transepithelial Electrical Resistance - TEER) and viability.
- Exposure Time: Mimic real-life exposure: typically 24-48 hours for non-cytotoxic concentrations. For pro-haptens, consider a 6-hour exposure followed by a wash and a 42-hour incubation to allow metabolic activation.
- Positive Controls: Always include benchmark sensitizers (e.g., DNCB, NiSO₄) and non-sensitizers/irritants (e.g., SLS, benzalkonium chloride).
Detailed Experimental Protocols
Protocol 1: Dendritic Cell Activation Assessment in an In-House Immune-Competent 3D Model
Title: DC Maturation and Migration Assay in a 3D Skin Equivalent.
Objective: To evaluate the sensitization potential of a test compound by assessing dendritic cell maturation and migratory capacity within a reconstructed epidermis containing integrated dendritic cell precursors.
Materials & Reagents:
- 3D Immune-Competent Skin Model: Cultured for 14 days with CD34+ hematopoietic progenitor cells seeded at the basal layer on day 7.
- Test Compounds: Prepared in appropriate solvent at 10x final concentration.
- Culture Media: Epilife or equivalent keratinocyte growth medium, without growth factors for the assay duration.
- Migration Receiver Plate: 24-well plate with 0.5 mL of medium containing CCL19 (100 ng/mL).
- Flow Cytometry Antibodies: Anti-human CD11c-APC, CD86-FITC, HLA-DR-PE, and relevant isotype controls.
- Cell Dissociation Reagent: Dispase II (2.4 U/mL) and Trypsin/EDTA.
Procedure:
- Pre-conditioning: On day 14, transfer tissue inserts to a fresh 24-well plate with 0.5 mL/well of pre-warmed, assay-specific medium (lacking cytokines). Incubate for 1 hour at 37°C, 5% CO₂.
- Compound Application:
- Gently aspirate medium from the insert.
- Apply 50 µL of the test compound solution (or solvent control) directly onto the epidermal surface. Ensure even distribution.
- Incubate for 40 minutes at 37°C, 5% CO₂ to allow compound absorption.
- Carefully add 0.5 mL of fresh medium to the outer well (basal compartment) without disturbing the apical surface.
- Incubate for 24 hours.
- Migratory Cell Collection:
- After incubation, carefully transfer the tissue insert to the Migration Receiver Plate containing CCL19-supplemented medium.
- Incubate for an additional 24 hours to allow active DC migration.
- Harvest the medium from the receiver well, centrifuge (300 x g, 5 min), and resuspend the cell pellet (migrated cells) in PBS+2% FBS for flow cytometry.
- Resident Cell Extraction:
- Rinse the tissue insert with PBS.
- Incubate with Dispase II (0.5 mL/well, basal side) at 37°C for 1-2 hours to separate the epidermis.
- Isolate the epidermal sheet, dissociate into single cells using Trypsin/EDTA, and neutralize with serum-containing medium. Wash and resuspend cells (resident cells) for flow cytometry.
- Flow Cytometric Analysis:
- Stain both migrated and resident cell populations with antibody panels for DC markers (CD11c, CD86, HLA-DR).
- Acquire data on a flow cytometer. Gate on viable, CD11c+ cells and analyze the geometric mean fluorescence intensity (gMFI) of CD86 and HLA-DR.
- Compare activation levels (gMFI) and the percentage of migrated CD11c+ cells between treated and control groups.
Protocol 2: Cytokine Profiling Using Commercial EpiDerm Model
Title: IL-18 Release Assay for Sensitizer Identification.
Objective: To quantify the release of Interleukin-18, a key sensitization-associated biomarker, from EpiDerm tissues following chemical exposure.
Procedure:
- Tissue Acclimatization: Upon receipt, transfer EpiDerm tissues (EPI-200) to a 6-well plate with 0.9 mL/well of pre-warmed Maintenance Medium (EPI-100-NMM). Incubate overnight (37°C, 5% CO₂).
- Exposure: Following manufacturer guidelines, apply 40 µL of test article directly to the tissue surface. Incubate for 24±2 hours.
- Media Collection: After incubation, collect the basal culture medium from each well. Centrifuge at 1000 x g for 10 minutes to remove debris. Aliquot and store supernatant at ≤ -20°C until analysis.
- Viability Assay (MTT): Perform MTT assay on tissues per OECD TG 439 to ensure test concentration is non-cytotoxic (<50% reduction in viability).
- IL-18 Quantification: Use a commercial human IL-18 ELISA kit. Thaw samples on ice. Perform assay in duplicate according to kit instructions. Include a standard curve (typically 0-1000 pg/mL). Read absorbance and calculate IL-18 concentration in each sample.
- Data Normalization: Normalize IL-18 release to tissue viability (e.g., pg/mL/µg protein or pg/mL/relative viability unit) for accurate comparison.
Visualizations
Title: Decision Flow for Model Selection in Sensitization Testing
Title: Workflow for DC Activation Assay Protocol
The Scientist's Toolkit: Research Reagent Solutions
Table 3: Essential Materials for 3D Skin Sensitization Research
| Item / Reagent | Manufacturer Examples | Function in Sensitization Research |
|---|---|---|
| Reconstructed Human Epidermis (RhE) | MatTek (EpiDerm), Episkin (SkinEthic), J-TEC (LabCyte) | Provides a standardized, reproducible keratinocyte barrier for initial chemical exposure and biomarker (cytokine) release studies. |
| Normal Human Epidermal Keratinocytes (NHEK) | Lonza, Thermo Fisher, CELLnTEC | Essential cell source for building in-house ALI or full-thickness models, allowing customization. |
| CD34+ Hematopoietic Progenitor Cells | Lonza, StemCell Technologies | Source for generating Langerhans-like cells within in-house 3D skin models to create immune-competent equivalents. |
| Human Dendritic Cell Generation Kit | Miltenyi Biotec, R&D Systems | For generating monocyte-derived dendritic cells (moDCs) that can be integrated into or co-cultured with skin models. |
| Dispase II | Sigma-Aldrich, Roche | Enzyme used to separate the epidermal sheet from the dermis or culture insert for resident immune cell isolation. |
| CCL19/MIP-3β Recombinant Protein | PeproTech, R&D Systems | Key chemokine used in migration assays to attract mature dendritic cells from the epidermal model. |
| Anti-human CD86 / HLA-DR Antibodies | BioLegend, BD Biosciences | Critical flow cytometry antibodies for quantifying dendritic cell maturation status post-chemical exposure. |
| Human IL-18 ELISA Kit | MBL, R&D Systems, Invitrogen | Validated kit for quantifying a major "danger signal" cytokine released by keratinocytes upon sensitizer exposure. |
| MTT Assay Kit | Sigma-Aldrich, Abcam | Standard colorimetric assay for determining tissue viability after chemical treatment (OECD TG 439). |
| Collagen Type I, Rat Tail | Corning, Thermo Fisher | Major component for constructing the dermal equivalent in in-house full-thickness skin models. |
Within the broader thesis on advancing in vitro skin sensitization testing using 3D skin models incorporating dendritic cells (DCs), rigorous study design is paramount. This document details application notes and protocols for three foundational pillars: dose selection, control strategies, and the critical comparison of topical versus submerged exposure regimes. Accurate implementation of these elements ensures reproducible, predictive, and mechanistically relevant data for assessing the sensitization potential of chemicals and novel drug formulations.
Dose Selection Strategy
Rational dose selection is critical to avoid false negatives (dose too low) or cytotoxicity-driven false positives (dose too high). A tiered approach is recommended.
Initial Cytotoxicity Assessment (Tier 1)
Objective: Determine the cytotoxicity profile of the test article to establish a non-cytotoxic dose range for sensitization assays. Protocol: MTT Assay on 3D Skin Model
- Treatment: Apply test article in a minimum of 8 concentrations (e.g., 0.001% to 1% w/v for topical; 1 µM to 1000 µM for submerged) to the 3D model (n=3 per dose). Include vehicle and positive control (e.g., 1% SDS for cytotoxicity).
- Exposure: Apply topically (10 µL/cm²) or submerge per defined regime (Section 4).
- Incubation: 24h at 37°C, 5% CO₂.
- MTT Procedure: a. Rinse tissues with PBS. b. Incubate with 1 mg/mL MTT (3-[4,5-dimethylthiazol-2-yl]-2,5-diphenyltetrazolium bromide) for 3h. c. Extract formazan crystals with acidified isopropanol. d. Measure absorbance at 570 nm with a reference at 650 nm.
- Data Analysis: Calculate cell viability relative to vehicle control. Determine IC₅₀ and IC₂₀ (dose causing 50% and 20% reduction in viability).
Table 1: Example Cytotoxicity Data for Test Chemicals
| Chemical | Exposure Regime | IC₅₀ | IC₂₀ | Recommended Max Dose for Sensitization Assay |
|---|---|---|---|---|
| Nickel Sulfate | Submerged | 450 µM | 150 µM | 150 µM |
| Cinnamic Aldehyde | Topical | 0.15% | 0.05% | 0.05% |
| Sodium Lauryl Sulfate | Topical | 0.08% | 0.02% | Not tested (irritant) |
Dose Selection for Sensitization Endpoints (Tier 2)
Objective: Select 3-5 sub-cytotoxic doses (spanning from the limit of detection to just below IC₂₀) to evaluate concentration-dependent responses in key biomarkers (e.g., CD86, OX40L, cytokine release).
Control Strategies
A comprehensive control scheme validates system performance and results interpretation.
Table 2: Required Controls for 3D DC-Sensitization Assays
| Control Type | Example(s) | Purpose | Expected Outcome |
|---|---|---|---|
| Negative (Vehicle) | PBS, DMSO (<0.1%), Culture Medium | Baseline for biomarker expression. | Minimal biomarker induction. Viability >80%. |
| Positive (Sensitizer) | 1µM DNFB, 25µM NiSO₄, 0.03% Cinnamic Aldehyde | Confirm model responsiveness. | Significant upregulation of CD86, IL-8, etc. |
| Cytotoxicity Positive | 1% Sodium Dodecyl Sulfate (SDS) | Verify cytotoxicity assay function. | Viability <50%. |
| Irritant Control | 1% Benzalkonium Chloride | Distinguish sensitization from irritation. | Moderate cytokine release, low CD86. |
| Untreated | Media only | Baseline health of tissues. | Reference for all assays. |
Exposure Regimes: Topical vs. Submerged
The exposure method must reflect the intended application (dermal product) or relevant exposure pathway.
Detailed Protocols
Protocol A: Topical Application (Standard for Dermal Products)
- Pre-warming: Warm test article and vehicle solutions to ~32°C.
- Application: Pipette the calculated volume (typically 10 µL per 0.33 cm² tissue, equating to ~30 µL/cm²) directly onto the stratum corneum.
- Distribution: Gently spread using a positive displacement pipette tip without breaking the surface.
- Incubation: Place tissues in a humidified incubator (37°C, 5% CO₂) for the defined period (e.g., 6h, 24h, 48h).
- Termination: Gently rinse the tissue surface 3x with PBS to remove residual test article.
Protocol B: Submerged Exposure (For Water-Soluble Compounds/Mechanistic Studies)
- Preparation: Prepare test article in pre-warmed culture medium.
- Exposure: Completely submerge the 3D tissue in a well of a multi-well plate containing the test solution. Ensure no air bubbles are trapped.
- Incubation: Place plate in incubator (37°C, 5% CO₂) on an orbital shaker (gentle, ~15 rpm) for the defined period.
- Termination: Carefully remove tissue and rinse gently in a separate well containing PBS.
Table 3: Comparison of Exposure Regimes
| Parameter | Topical Application | Submerged Exposure |
|---|---|---|
| Physiological Relevance | High (mimics skin contact) | Low (bypasses stratum corneum) |
| Test Article Conservation | High (low volume used) | Low (requires more volume) |
| Suitable For | Creams, oils, insoluble materials, final formulations. | Water-soluble chemicals, precise concentration delivery. |
| Key Challenge | Variable penetration, evaporation. | Hyper-hydration of epidermis, potential hypoxia. |
| Impact on DC Activation | Reflects percutaneous sensitization. | May overestimate potency. |
Protocol for Comparative Study
Objective: To directly compare biomarker expression induced by the same chemical via different exposure routes.
- Dose: Use the same molar/concentration dose of test article (e.g., 25 µM NiSO₄) in both regimes.
- Application: Treat tissues (n=4 per group) either topically (Protocol A) or submerged (Protocol B).
- Duration: Standardize exposure time (e.g., 24h).
- Analysis: Post-exposure, process tissues for biomarker quantification (e.g., ELISA for IL-8, qPCR for CD86).
Signaling Pathway & Experimental Workflow
The Scientist's Toolkit: Research Reagent Solutions
Table 4: Essential Materials for 3D DC Sensitization Testing
| Item | Function in Study Design | Example Vendor/Product |
|---|---|---|
| Reconstructed Human Epidermis (RHE) with DCs | Core test system containing keratinocytes, fibroblasts, and integrated dendritic cells. | EpiDerm FT, SkinEthic RHE with Immune Cells. |
| Maintenance Medium (w/o supplements) | Base medium for tissue equilibration and preparation of test article solutions. | As provided by model vendor. |
| Assay Medium (defined supplements) | Medium used during exposure to maintain tissue viability without confounding activation. | As provided by model vendor. |
| MTT Reagent Kit | For quantifying tissue viability (cytotoxicity Tier 1). | MilliporeSigma MTT Cell Proliferation Assay Kit. |
| ELISA Kits (Human IL-8, IL-1β, etc.) | For quantifying secreted pro-inflammatory cytokines from harvested media. | R&D Systems DuoSet ELISA, Invitrogen ELISA kits. |
| RNA Isolation Kit (for fibrous tissue) | For extracting high-quality RNA from 3D tissues for qPCR analysis of CD86, etc. | Qiagen RNeasy Fibrous Tissue Mini Kit. |
| qPCR Master Mix & Primers/Probes | For gene expression analysis of DC maturation markers. | Bio-Rad iTaq Universal SYBR Green, TaqMan Assays. |
| Cell Recovery Solution | For dissociating 3D tissues into single-cell suspensions for flow cytometry. | Corning Cell Recovery Solution. |
| Flow Cytometry Antibodies | For phenotyping activated DCs (e.g., anti-CD86-APC, anti-HLA-DR-PE). | BioLegend, BD Biosciences. |
| Positive Control Sensitizers | Reference chemicals for assay validation (e.g., DNFB, NiSO₄, Cinnamic Aldehyde). | MilliporeSigma, with >99% purity. |
| Precision Positive Displacement Pipettes | For accurate and reproducible topical application of viscous/liquid test items. | Microman (Gilson), Eppendorf Xplorer. |
This protocol details the critical step of harvesting migratory dendritic cells (DCs) from reconstructed human epidermis (RhE) models within a broader thesis investigating sensitization potential in 3D skin models. Accurate cell retrieval is paramount for subsequent flow cytometric analysis of DC activation markers (e.g., CD86, CD54, OX40L), which are key endpoints in the assessment of skin sensitizers.
Research Reagent Solutions & Essential Materials
| Item | Function/Description |
|---|---|
| Dispase II Solution (≥5 U/mL) | Neutral protease; digests the basement membrane/dermo-epidermal junction to separate the epidermis from the underlying matrix without damaging cell surface epitopes. |
| Collagenase D (1-2 mg/mL) | Enzyme blend effective in dissociating cells from the remaining 3D collagen-based matrix post-Dispase treatment. |
| DNase I (50-100 µg/mL) | Degrades free DNA released from damaged cells, reducing cell clumping and improving single-cell suspension for flow cytometry. |
| Flow Cytometry Staining Buffer (PBS + 2% FBS + 1 mM EDTA) | Preserves cell viability, prevents non-specific antibody binding, and inhibits cell adhesion/aggregation during staining. |
| CD45 Microbeads (Human) | Magnetic-activated cell sorting (MACS) beads for positive selection of leukocytes (haematopoietic-derived DCs) from a heterogeneous cell mixture post-harvest. |
| Viability Dye (e.g., 7-AAD or Propidium Iodide) | Distinguishes live from dead cells during flow cytometry, ensuring analysis is gated on viable DCs. |
| Antibody Panel: Anti-human CD86-APC, CD54-FITC, HLA-DR-PerCP, CD11c-PE | Fluorochrome-conjugated monoclonal antibodies for detecting DC maturation/activation markers via flow cytometry. |
Experimental Protocol: Cell Harvesting & Preparation for Flow Cytometry
A. Separation of Epidermis from Dermal Compartment
- Transfer: Aseptically transfer the 3D skin model (e.g., EpiDerm, LabCyte EPI-MODEL) from the air-liquid interface culture insert to a sterile petri dish.
- Dispase Treatment: Add enough pre-warmed (37°C) Dispase II solution to fully submerge the model. Incubate for 1.5-2 hours at 37°C, 5% CO₂.
- Mechanical Separation: Using fine forceps and a scalpel, gently peel the epidermal layer (stratified epithelium) away from the dermal-equivalent matrix. Transfer each compartment to separate tubes for processing.
B. Enzymatic Dissociation to Single-Cell Suspension
- Epidermal Compartment Processing: Place the epidermal sheet in a tube with 2 mL of pre-warmed 0.25% Trypsin-EDTA. Incubate for 15-20 minutes at 37°C with gentle agitation. Neutralize with 4 mL of complete culture medium.
- Dermal Matrix/Residual Compartment Processing: Mince the remaining matrix finely with scissors. Add 3 mL of pre-warmed Collagenase D solution. Incubate for 1.5-2 hours at 37°C on a rocking platform.
- DNase Treatment & Filtration: To both cell suspensions, add DNase I to a final concentration of 50 µg/mL and incubate for 5 minutes at room temperature. Pass each suspension through a 70 µm sterile cell strainer. Wash cells with PBS.
- Pooling & Washing: Pool cell suspensions from epidermal and dermal origins. Centrifuge at 300 x g for 5 minutes. Resuspend pellet in 1 mL of Flow Cytometry Staining Buffer.
C. Enrichment for Dendritic Cells (Optional but Recommended)
- Perform positive selection for CD45+ leukocytes using the MACS system per manufacturer's protocol to enrich for migratory DCs prior to staining.
D. Staining for Flow Cytometry
- Viability Staining: Resuspend cell pellet in 100 µL buffer containing viability dye. Incubate 10 minutes in the dark, at 4°C.
- Surface Marker Staining: Add the pre-titrated antibody cocktail directly to the cells (without washing). Incubate for 30 minutes in the dark, at 4°C.
- Wash & Resuspend: Wash cells twice with 2 mL of buffer. Resuspend the final pellet in 200-300 µL of buffer for acquisition on the flow cytometer. Keep at 4°C in the dark until analysis.
| Parameter | Optimized Condition/Range | Rationale / Impact on Yield & Viability |
|---|---|---|
| Dispase II Incubation Time | 90-120 minutes | <90 min: Incomplete epidermal separation. >120 min: Reduced DC viability. |
| Collagenase D Concentration | 1.5 mg/mL | Balance between complete matrix dissociation (<1 mg/mL) and cell surface antigen preservation (>2 mg/mL). |
| Post-Harvest Cell Viability (Trypan Blue) | 85-95% | Critical for reliable flow cytometry data; dependent on gentle enzymatic and mechanical handling. |
| Expected DC Yield per Standard RhE Unit | 1.0 - 3.5 x 10³ CD45+CD11c+ cells | Varies with model, donor, and sensitizer exposure. Key for determining replicates. |
| Recommended Flow Cytometry Event Acquisition | 50,000 - 100,000 events per sample | Ensures sufficient DC events for robust statistical analysis of low-frequency populations. |
Experimental Workflow & Pathway Diagrams
Workflow for Harvesting DCs from 3D Skin Models
Sensitization Pathway to DC Marker Readout
Within the broader thesis on 3D skin model dendritic cells (DC) sensitization testing, accurate identification and analysis of viable, immunocompetent DCs is paramount. This protocol details the gating strategy to unequivocally identify viable CD45+ HLA-DR+ cells—the population encompassing dendritic cells—from single-cell suspensions derived from reconstructed human epidermis (RHE) or full-thickness skin models following xenobiotic exposure. This workflow is critical for downstream analyses of activation markers (e.g., CD86, CD54) to assess sensitization potential.
Key Research Reagent Solutions
| Reagent/Material | Function in Protocol |
|---|---|
| Live/Dead Fixable Near-IR Viability Dye | Distinguishes viable from non-viable cells based on intact membrane integrity. Impermeant dye covalently binds amines in dead cells. |
| Fc Receptor Blocking Solution (Human IgG) | Prevents non-specific, Fc-mediated antibody binding to cells, reducing background staining. |
| Anti-human CD45 Brilliant Violet 510 | Pan-leukocyte marker. Identifies all hematopoietic-derived cells, gating out non-immune skin cells (e.g., keratinocytes). |
| Anti-human HLA-DR Brilliant Violet 605 | MHC Class II marker. Constitutively expressed on antigen-presenting cells like dendritic cells. |
| Flow Cytometry Staining Buffer (PBS + 2% FBS) | Provides protein to minimize non-specific antibody binding and maintains cell stability. |
| Cell Dissociation Enzyme (e.g., Liberase TL) | Gently dissociates 3D skin models into single-cell suspensions while preserving cell surface epitopes. |
| 1X Phosphate Buffered Saline (PBS) | Washing and dilution buffer. |
| Flow Cytometer with 405nm, 488nm, 640nm lasers | Instrument capable of detecting the specified fluorochrome conjugates (Brilliant Violet, FITC, etc.). |
Detailed Protocol: From 3D Model to Gated Population
Part A: Generation of Single-Cell Suspension from 3D Skin Model
- Terminate Exposure: Following the sensitizer/control treatment period, carefully rinse the 3D skin model (e.g., EpiDerm, LabCyte EPI-MODEL) in pre-warmed PBS.
- Dissociation: Incubate model in a defined enzyme cocktail (e.g., Liberase TL in PBS, 1 mg/mL) for 60-90 minutes at 37°C.
- Mechanical Disruption: Gently pipette or scrape the epidermal layer to dissociate cells. Pass the suspension through a 70 µm nylon cell strainer.
- Wash: Centrifuge cells at 300 x g for 5 min. Resuspend pellet in 5 mL of complete culture medium. Perform a viable cell count using Trypan Blue.
Part B: Surface Marker Staining for Flow Cytometry
- Viability Staining: Resuspend up to 1x10^6 cells in 1 mL PBS. Add 1 µL of Live/Dead Fixable Near-IR dye. Incubate for 20 minutes at 4°C in the dark.
- Wash & Block: Add 2 mL staining buffer, centrifuge. Resuspend pellet in 100 µL staining buffer containing Fc Block (1 µg/10^6 cells). Incubate 10 min at 4°C.
- Surface Antibody Staining: Add pre-titrated antibody cocktail directly to the tube (e.g., anti-CD45, anti-HLA-DR). Do not wash out Fc Block. Vortex gently. Incubate 25 minutes at 4°C in the dark.
- Final Wash: Add 2 mL staining buffer, centrifuge. Aspirate supernatant. Resuspend cells in 300 µL of staining buffer for acquisition. Keep at 4°C and protected from light.
- Acquisition: Acquire samples on flow cytometer within 4 hours. Collect a minimum of 50,000 events per sample.
Part C: Sequential Gating Strategy for Viable CD45+ HLA-DR+ Cells
The logical gating hierarchy is visually summarized in the workflow diagram below.
Gating Workflow for Viable Dendritic Cells
Table 1: Representative Flow Cytometry Data from a Reconstructed Human Epidermis Model.
| Sample Condition | Total Viable Singlets | % CD45+ of Viable | % HLA-DR+ of CD45+ | Absolute # of Viable CD45+ HLA-DR+ Cells |
|---|---|---|---|---|
| Vehicle Control | 50,000 | 2.5% | 65% | ~813 |
| Reference Sensitizer (0.1% DNCB) | 48,000 | 8.1% | 78% | ~3,036 |
| Irritant (1% SDS) | 47,500 | 6.0% | 55% | ~1,568 |
Table 2: Key Panel Configuration for a 3-Laser Flow Cytometer.
| Parameter | Fluorochrome | Laser (nm) | Filter (nm) | Purpose |
|---|---|---|---|---|
| Viability | Near-IR Live/Dead | 640 | 780/60 | Live/Dead discrimination |
| CD45 | Brilliant Violet 510 | 405 | 525/50 | Pan-leukocyte gate |
| HLA-DR | Brilliant Violet 605 | 405 | 610/20 | Dendritic cell identification |
| FSC-A | N/A | 488 | N/A | Cell size |
| SSC-A | N/A | 488 | N/A | Cell complexity |
Critical Notes on Gating & Analysis
- Doublet Discrimination: Essential for accurate quantification. Always gate on singlets using FSC-A versus FSC-H before viability staining.
- Volatility of HLA-DR: HLA-DR expression can be sensitive to prolonged enzymatic digestion. Optimize dissociation time for each skin model type.
- Background Fluorescence: Include a fluorescence-minus-one (FMO) control for HLA-DR to accurately set the positive gate, especially on low-frequency populations.
- Downstream Analysis: The gated viable CD45+ HLA-DR+ population is the foundation for subsequent analysis of DC activation markers (e.g., CD86, CD54, CD83) to determine sensitizer potency within the 3D skin model system.
Within the context of 3D skin model dendritic cell (DC) sensitization testing research, accurate data interpretation is critical for classifying chemicals as sensitizers and non-sensitizers. This application note details the methodology for calculating biomarker fold changes, establishing statistically robust classification thresholds, and subsequently determining sensitizer potency categories. These protocols are designed for integration into a standard operating procedure for in vitro skin sensitization assessment.
Core Quantitative Metrics and Threshold Determination
The classification of a test substance is based on the upregulation of key DC activation biomarkers (e.g., CD86, CD54, IL-8) measured via flow cytometry or ELISA. The process involves calculating fold change, comparing it to thresholds, and applying prediction models.
Table 1: Example Benchmark Data for Threshold Setting (Based on LLNA & Human Data)
| Substance (Example) | Potency (LLNA) | Mean Fold Change (CD86) | Mean Fold Change (CD54) | Reference Class |
|---|---|---|---|---|
| 2,4-Dinitrochlorobenzene (DNCB) | Extreme | 4.5 | 6.2 | Sensitizer (S) |
| Hexyl Cinnamic Aldehyde (HCA) | Moderate | 2.8 | 3.1 | Sensitizer (S) |
| Isopropanol | Non-Sensitizer | 1.1 | 0.9 | Non-Sensitizer (NS) |
| Sodium Lauryl Sulfate (SLS) | Irritant | 1.3 | 5.0* | Non-Sensitizer (NS) |
*High CD54 with low CD86 may indicate pure irritation.
Table 2: Proposed Classification Matrix Based on Fold Change (FC)
| Biomarker | Negative/Vehicle Control Threshold | Positive Classification Threshold (Suggested) | Strong Positive Threshold (Suggested) |
|---|---|---|---|
| CD86 | FC ≤ 1.5 | FC ≥ 1.5 | FC ≥ 2.0 |
| CD54 | FC ≤ 2.0 | FC ≥ 2.0 | FC ≥ 3.0 |
| IL-8 (Secreted) | FC ≤ 1.5 | FC ≥ 1.5 | FC ≥ 2.5 |
Final thresholds must be statistically validated using receiver operating characteristic (ROC) analysis against a curated training set of known sensitizers and non-sensitizers.
Table 3: Interpreting Results for Potency Categorization
| Outcome Pattern | CD86 FC | CD54 FC | Interpretation & Potency Indication |
|---|---|---|---|
| Double Positive | ≥ 1.5 | ≥ 2.0 | Sensitizer. Potency may be extrapolated from magnitude of response (e.g., higher FC may correlate with stronger potency). |
| Single Positive (CD54 only) | < 1.5 | ≥ 2.0 | Potential Irritant / Weak Sensitizer. Requires caution and further assessment (e.g., cytokine profiling). |
| Single Positive (CD86 only) | ≥ 1.5 | < 2.0 | Possible Sensitizer. Less common; verify with additional endpoints. |
| Double Negative | < 1.5 | < 2.0 | Predicted Non-Sensitizer. |
Detailed Experimental Protocols
Protocol 1: Treatment of 3D Skin Model and DC Cell Harvest
- Pre-incubation: Equilibrate reconstructed human epidermis (RhE) models (e.g., EpiDerm, SkinEthic) in maintenance medium for 1 hour at 37°C, 5% CO₂.
- Test Substance Application: Prepare test chemicals in appropriate vehicle (DMSO, water, acetone:olive oil). Apply 20 µL of solution or 20 mg of solid to the epidermal surface. Include vehicle control and positive controls (e.g., 0.1% DNCB).
- Exposure: Incubate models for 24 ± 2 hours at standard culture conditions.
- Harvest of Epidermal Cells: Rinse surface gently to remove residual test material. Enzymatically dissociate epidermis using dispase (2 mg/mL, 2 hours, 37°C) followed by trypsin/EDTA to obtain a single-cell suspension containing epidermal Langerhans cells (LCs)/DCs.
- Cell Washing: Neutralize trypsin, wash cells twice in FACS buffer (PBS + 2% FBS). Proceed to staining or cryopreserve cells in 90% FBS/10% DMSO for batch analysis.
Protocol 2: Flow Cytometry Analysis of DC Activation Markers
- Cell Staining: Resuspend harvested cells (~1x10⁶ cells/tube) in FACS buffer. Incubate with human Fc block (10 min, 4°C). Add antibody cocktails against CD1a (DC marker), CD86, CD54, and viability dye (e.g., 7-AAD). Use isotype controls for gating.
- Incubation: Stain for 30 minutes in the dark at 4°C.
- Wash and Fix: Wash cells twice, fix in 1% paraformaldehyde (PFA) if not running immediately.
- Acquisition: Acquire data on a flow cytometer, collecting at least 10,000 viable, CD1a+ events per sample.
- Gating Strategy: Gate on single cells > viable cells > CD1a+ population. Analyze median fluorescence intensity (MFI) of CD86 and CD54 on the CD1a+ gate.
Protocol 3: Data Analysis, Fold Change Calculation, and Classification
- Calculate MFI Ratio: For each sample and control, determine the MFI for each biomarker on the viable CD1a+ population.
- Compute Fold Change (FC):
FC = (MFI_test substance) / (MFI_vehicle control)Use the mean MFI from replicate models (recommended n=3-4). - Statistical Analysis: Perform appropriate statistical tests (e.g., one-way ANOVA with Dunnett's post-hoc test) to compare test substance MFI to vehicle control.
- Apply Classification Thresholds: Compare calculated FC values to the validated lab-specific thresholds (see Table 2). A substance is classified as positive if the FC for one or more biomarkers meets or exceeds the threshold with statistical significance (p < 0.05).
- Potency Assessment: For positive substances, rank order based on the magnitude of FC response across multiple biomarkers relative to a set of benchmark chemicals (see Table 1). This allows for sub-categorization into e.g., weak, moderate, and strong sensitizers.
Pathway and Workflow Visualizations
Workflow for Sensitization Test Data Interpretation
Key Signaling Pathways in DC Activation
The Scientist's Toolkit: Research Reagent Solutions
Table 4: Essential Materials for 3D Skin Model DC Sensitization Testing
| Item | Function & Explanation |
|---|---|
| Reconstructed Human Epidermis (RhE) Models (e.g., EpiDerm SIT, SkinEthic RHE) | 3D tissue containing stratified keratinocytes and Langerhans cells/DCs. Provides a physiologically relevant model for topical exposure. |
| Defined Sensitizer & Non-Sensitizer Benchmark Chemicals | Critical for assay qualification, threshold determination, and ongoing positive/negative control use (e.g., DNCB, NiSO₄, HCA, SLS, Glycerol). |
| Fluorochrome-conjugated Antibodies (Anti-human CD1a, CD86, CD54) | For specific detection and quantification of DCs and their activation state via flow cytometry. |
| Viability Stain (e.g., 7-AAD, Propidium Iodide) | Distinguishes live from dead cells during flow analysis, ensuring data is derived from a healthy cell population. |
| Enzymatic Dissociation Kit (Dispase II, Trypsin/EDTA) | For gentle and effective separation of the epidermis and generation of a single-cell suspension containing LCs/DCs. |
| Flow Cytometry Buffer (PBS with 2% FBS and 0.1% Sodium Azide) | Preserves cell viability and reduces non-specific antibody binding during staining and acquisition. |
| ELISA Kits for Cytokines (Human IL-8, IL-1β) | Quantifies secreted pro-inflammatory cytokines from the model culture supernatant, providing additional activation data. |
| Statistical & ROC Analysis Software (e.g., R, Prism, specialised OECD QSAR Toolbox) | For robust statistical comparison of data, determination of optimal classification thresholds, and building prediction models. |
Solving Common Challenges: How to Optimize Your 3D Skin Sensitization Assay
This document provides detailed application notes and protocols, framed within a broader thesis on advancing the predictive power of 3D skin models for dendritic cell (DC) sensitization testing (e.g., for assessing skin sensitization potential of chemicals and drugs). A critical challenge in this field is experimental variability stemming from two primary sources: batch-to-batch consistency of commercially available 3D skin models and inherent donor-to-donor biological effects in primary cell-derived models. This variability can confound the interpretation of sensitization endpoints, such as DC activation markers (CD86, CD54), cytokine secretion (IL-8, IL-1β), and gene expression profiles. The following sections consolidate current methodologies, data, and protocols to identify, quantify, and mitigate these sources of variability.
Quantitative Data on Observed Variability
Table 1: Reported Variability in Key Sensitization Endpoints Across Donors & Batches
| Variability Source | Model Type | Endpoint Measured | Coefficient of Variation (CV) Range | Key Study / Observation |
|---|---|---|---|---|
| Donor Effect | Primary monocyte-derived DCs (MoDCs) | CD86 surface expression (MFI) | 25% - 60% | High inter-individual immune response diversity. |
| Donor Effect | PBMC-derived Langerhans Cells | IL-8 secretion | 30% - 70% | Genetic and epigenetic factors influence cytokine production. |
| Batch Effect | Commercial 3D Epidermal Model (e.g., EpiDerm) | Basal TEER (Transepithelial Electrical Resistance) | 10% - 20% | Quality control variability in manufacturing. |
| Batch Effect | Reconstructed Human Epidermis (RHE) | Viability (MTT assay) | 5% - 15% | Consistency in keratinocyte differentiation protocols. |
| Combined | Full-thickness 3D skin model with DCs | CD54 expression post-exposure | 35% - 80% | Summation of donor cell and model matrix variability. |
Table 2: Strategies for Mitigating Variability and Their Impact
| Strategy | Description | Effect on Variability (CV Reduction) |
|---|---|---|
| Donor Pooling | Using monocytes/DCs from ≥3 donors, pooled. | Reduces donor-specific CV by ~40-50%. |
| Reference Control Standardization | Including a benchmark sensitizer (e.g., NiSO₄, DNCB) in every run. | Allows normalization; improves inter-batch comparability. |
| Internal Biomarker Normalization | Expressing data relative to housekeeping genes (GAPDH) or constitutive markers. | Reduces technical CV to 10-15%. |
| Rigorous Pre-screening | Qualifying donor cells for consistent response to TLR agonists (e.g., LPS). | Filters out high/low responders, reducing donor CV by ~30%. |
Experimental Protocols
Protocol 1: Assessing Batch-to-Batch Consistency of a 3D Epidermal Model
Aim: To quantify variability in key physical and biological parameters between production lots of a commercial 3D skin model. Materials: Three separate production lots/batches of the 3D epidermal model (e.g., EpiDerm, SkinEthic), maintenance medium, positive control sensitizer (1% DNCB in vehicle), vehicle control, MTT assay kit, histological fixative, TEER measurement system. Procedure:
- Acclimatization: Upon receipt, transfer all models to maintenance medium and incubate at 37°C, 5% CO₂ for 24h.
- Physical Assessment (Day 1): a. Visually inspect each model (n=3 per batch) for integrity. b. Measure Transepithelial Electrical Resistance (TEER) for each model using chopstick electrodes. Record values in Ω·cm².
- Dosing & Exposure (Day 1): a. Apply 25 µL of vehicle control and positive control (DNCB) topically to the surface of separate models (n=3 per batch per treatment). b. Incubate for 24h.
- Viability Assessment (Day 2): a. Perform MTT assay according to kit/manufacturer instructions. b. Measure absorbance at 570 nm. Calculate viability as % of vehicle-treated control.
- Histological Analysis (Day 2): a. Fix models in neutral buffered formalin. Process for H&E staining. b. Measure epidermal thickness at 10 random points/section using image analysis software.
- Data Analysis: Calculate mean and CV for TEER, viability (% control), and epidermal thickness for each batch. Perform one-way ANOVA to identify statistically significant (p<0.05) inter-batch differences.
Protocol 2: Quantifying Donor-Derived DC Response Variability in a 3D Sensitization Test
Aim: To measure inter-donor variability in DC activation markers following exposure to a sensitizer within a 3D skin model. Materials: Primary human monocytes from at least 5 different donors, differentiation cytokines (GM-CSF, IL-4), 3D epidermal models (single batch), test article (sensitizer), flow cytometry antibodies (anti-CD86-FITC, anti-CD54-PE, anti-HLA-DR-APC), cell dissociation enzyme for 3D models. Procedure:
- DC Generation: Isolate CD14⁺ monocytes from each donor's PBMCs. Differentiate into immature DCs (iDCs) using 100 ng/mL GM-CSF and 50 ng/mL IL-4 for 5-7 days.
- DC Integration: Seed iDCs onto the basal side of the 3D epidermal model or incorporate into a full-thickness model dermal equivalent according to your established protocol. Allow to integrate for 24-48h.
- Exposure: Topically apply the test article or control to the model surface. Incubate for 48h.
- DC Harvest & Staining: a. Dissociate the entire model using a gentle enzyme cocktail (e.g., dispase + collagenase) to create a single-cell suspension. b. Stain cells with fluorescently conjugated antibodies against CD86, CD54, and HLA-DR. c. Include viability dye (e.g., 7-AAD).
- Flow Cytometry: Acquire data on a flow cytometer. Gate on viable, HLA-DR⁺ cells to identify the migrated/activated DC population.
- Data Analysis: Calculate the Mean Fluorescence Intensity (MFI) for CD86 and CD54 for each donor/treatment. Determine the CV across donors for each endpoint. Use a reference sensitizer to classify donors as "high," "medium," or "low" responders.
Visualization: Diagrams and Workflows
The Scientist's Toolkit: Research Reagent Solutions
Table 3: Essential Materials for 3D Skin DC Sensitization Assays
| Item Name | Function/Benefit | Example Supplier/Cat. No. (Illustrative) |
|---|---|---|
| Reconstructed Human Epidermis (RHE) | Provides a physiologically relevant, barrier-competent tissue for topical exposure. Reduces need for animal tissue. | EpiDerm (EPI-212), SkinEthic RHE, LabCyte EPI-MODEL. |
| Primary Human CD14+ Monocyte Isolation Kit | High-purity starting population for generating consistent batches of monocyte-derived DCs (MoDCs). | Miltenyi Biotec CD14 Microbeads (130-050-201). |
| GM-CSF & IL-4 Cytokines | Essential cytokines for the in vitro differentiation of monocytes into immature dendritic cells (iDCs). | PeproTech (300-03 & 200-04). |
| Flow Cytometry Antibody Panel | Multiplexed detection of DC activation markers (CD86, CD54, HLA-DR) and viability. | BioLegend: Anti-human CD86-FITC (305404), CD54-PE (353106), HLA-DR-APC (307610). |
| Reference Sensitizers & Irritants | Critical positive/negative controls for assay qualification and inter-batch normalization. | DNCB (2,4-Dinitrochlorobenzene), NiSO₄, Sodium Lauryl Sulfate (irritant control). |
| 3D Model Maintenance Medium | Specialized medium optimized for the health and barrier function of the specific epidermal model. | Provided by the model manufacturer (e.g., EpiDerm Maintenance Medium). |
| Gentle Cell Dissociation Enzyme | Enzymatic blend for recovering viable, single-cell suspensions from 3D models for downstream analysis. | STEMCELL Technologies Gentle Cell Dissociation Reagent (07174). |
| Multiplex Cytokine Assay Kit | Simultaneous quantification of multiple sensitization-relevant cytokines (IL-8, IL-1β, IL-18) from culture supernatants. | Meso Scale Discovery (MSD) U-PLEX Biomarker Group 1. |
Troubleshooting Weak or No Activation Signals
Within the broader thesis on dendritic cell (DC) sensitization testing in 3D reconstructed human skin models (e.g., EpiDerm, EpiSkin), robust activation signals are critical for predicting chemical sensitizers. Weak or absent activation signals—measured via surface marker upregulation (e.g., CD86, CD54), cytokine secretion (e.g., IL-8, IL-1β), or migration—compromise the predictive capacity of the assay, leading to false-negative outcomes. This document provides application notes for diagnosing and resolving these issues, ensuring reliable data for drug and chemical safety assessment.
Table 1: Factors Contributing to Weak DC Activation in 3D Skin Models
| Factor Category | Specific Parameter | Typical Impact (Quantitative Range) | Reference/Model |
|---|---|---|---|
| Test Compound | Low solubility (in vehicle) | >50% reduction in CD86 MFI | LLNA/3D DC Model Correlation |
| Sub-optimal dosing (too low/high) | EC50 shift of 1-2 logs | KeratinoSens/h-CLAT data | |
| Model Integrity | Compromaged epidermal barrier (high TEER) | >30% loss of cytokine signal | EpiDermFT QC data |
| Low donor-derived DC count | < 5% CD1a+ cells in epidermis | Flow cytometry analysis | |
| Protocol | Insufficient exposure time | 50-80% signal loss at 24h vs 48h | OECD TG 442E guidelines |
| Improper cytokine assay sensitivity | IL-8 detection limit >5 pg/mL | ELISA/MSD platform comparison | |
| Cell Health | High baseline apoptosis (e.g., >15%) | 60-75% reduction in CD54 expression | Annexin V/PI staining |
Table 2: Expected Positive Control Responses in Standardized Assays
| Assay Name | Positive Control (Concentration) | Expected CD86 MFI (Fold Increase) | Expected IL-8 Secretion (pg/mL) |
|---|---|---|---|
| h-CLAT (THP-1) | 2,4-Dinitrochlorobenzene (0.1 μg/mL) | 3.5 - 5.0 | 800 - 1200 |
| U-SENS (U937) | Cinnamic aldehyde (20 μg/mL) | 2.0 - 3.5 | 500 - 900 |
| 3D Model Integrated | Nickel Sulfate (0.5 mM) | 2.0 - 4.0 (in migrated cells) | 200 - 600 |
Experimental Protocols for Diagnosis
Protocol 3.1: Baseline Model Quality Control
Objective: Verify the viability, barrier integrity, and innate DC population of the 3D skin model prior to sensitizer exposure.
- Barrier Function (TEER): Using chopstick electrodes, measure Transepithelial Electrical Resistance (TEER) of the model. Acceptable values: >500 Ω·cm² for full-thickness models.
- Viability (MTT Assay): Incubate model with 1 mg/mL MTT for 3 hours at 37°C. Extract formazan crystals with isopropanol. Measure absorbance at 570 nm. Viability should be >70% of negative control (vehicle).
- DC Population Check (Pre-Study): For one representative model per batch, dissociate epidermis enzymatically (Dispase II, 2 U/mL, 2h, 4°C). Label single-cell suspension with anti-CD1a-FITC and anti-HLA-DR-APC. Analyze via flow cytometry. Acceptable range: CD1a+HLA-DR+ cells should be 5-15% of epidermal cells.
Protocol 3.2: Optimization of Compound Application
Objective: Ensure test compound properly reaches the epidermal dendritic cells.
- Vehicle & Solubility Check: Prepare compound at 100x final desired top concentration in candidate vehicle (e.g., DMSO, acetone:olive oil (4:1), culture medium). Centrifuge at 15,000g for 10 min. Inspect for pellet. Use soluble fraction only. Final vehicle concentration on model must be non-cytotoxic (<0.5% for DMSO).
- Topical Application: Apply 25 µL/cm² of test formulation evenly to the model surface using a positive displacement pipette. Allow to dry for 15-30 min in a laminar flow hood before transferring to fresh medium.
- Alternative: Intradermal Injection (for model troubleshooting): Using a 30G needle and micro-syringe, inject 10 µL of compound solution directly into the dermal compartment of a full-thickness model. This bypasses barrier issues to confirm compound activity.
Protocol 3.3: Enhanced Signal Detection via Migratory DC Assay
Objective: Isolate and analyze migrated dendritic cells, which often exhibit stronger activation markers.
- Migration and Collection: Following 24-48h compound exposure, place the 3D model in a transwell insert with fresh medium in the lower chamber. Add 100 ng/mL CCL19 (MIP-3β) to the lower chamber as a chemoattractant. Incubate for 24h.
- Harvest Cells: Collect cells from the lower chamber and wash with PBS.
- Flow Cytometry Staining: Label cells with anti-CD1a-PE, anti-CD86-FITC, anti-CD54-APC, and a viability dye (e.g., 7-AAD). Use isotype controls. Analyze on flow cytometer. Gate on viable, CD1a+ cells to quantify MFI of CD86 and CD54.
Signaling Pathways and Workflow Diagrams
Title: Dendritic Cell Activation Pathways in Skin Sensitization
Title: Systematic Troubleshooting Workflow
The Scientist's Toolkit: Key Research Reagent Solutions
Table 3: Essential Materials for 3D Skin DC Sensitization Assays
| Item | Function/Benefit | Example Product/Catalog |
|---|---|---|
| Reconstructed Human Epidermis (RHE) or Full-Thickness Model | Provides 3D structure with keratinocytes, functional barrier, and resident Langerhans cells/DC precursors. | EpiDerm (EPI-200), SkinEthic RHE, EpiSkin. |
| Defined DC Maturation Markers Antibody Panel | Flow cytometry detection of activation (CD86, CD54, CD83, HLA-DR). | BioLegend: Anti-human CD86-FITC (305406), CD54-APC (353110). |
| High-Sensitivity Cytokine Assay | Quantifies low levels of IL-8, IL-1β secreted by activated DCs and keratinocytes. | Meso Scale Discovery (MSD) U-PLEX Assays, Quansys Biosciences Q-Plex. |
| Chemoattractant for Migration | CCL19/MIP-3β directs migratory DCs to lower chamber for analysis. | PeproTech #300-29B. |
| Dispase II (Neutral Protease) | Gently dissociates epidermis from dermis for pre-study DC population analysis. | Sigma D4693. |
| Matrigel or Collagen I Matrix | For constructing custom full-thickness models with embedded DC precursors. | Corning #356231. |
| TEER Measurement System | Quantitative, non-destructive assessment of skin model barrier integrity pre-study. | Millicell ERS-2 Voltohmmeter. |
| Cytotoxicity Assay Kit | Parallel assessment of cell viability (e.g., via LDH release) to rule out false negatives from toxicity. | Roche LDH Cytotoxicity Detection Kit (11644793001). |
Application Notes
In the context of 3D skin model dendritic cell (DC) sensitization testing, a primary confounding factor is nonspecific activation due to excessive cytotoxicity. True skin sensitization involves the specific activation of DCs via haptenation and subsequent Danger-Associated Molecular Pattern (DAMP) signaling. Over-toxicity, however, leads to generalized cell death and inflammation, which can produce false-positive readouts in assays like IL-8 or IL-1β secretion. Current research emphasizes integrating multiple endpoints—viability, specific cytokine profiles (e.g., IL-8, IL-1β, CD86), and genomic biomarkers—to differentiate between these pathways. The table below summarizes key quantitative endpoints and their interpretation.
Table 1: Quantitative Endpoints for Differentiating Sensitization from Over-Toxicity in 3D Skin Models
| Endpoint | Typical Sensitizer Response | Over-Toxicity Response | Suggested Threshold (Example) |
|---|---|---|---|
| Cell Viability (MTT/WST-1) | >70-80% (at test concentration) | Often <70%, dose-dependent | Viability <70% flags potential over-toxicity. |
| IL-8 Secretion (ELISA) | Significant increase (e.g., 2-5 fold over baseline) | Sharp increase at cytotoxic doses, often plateauing or dropping at highest doses. | Fold-change >1.5 vs. vehicle, but must correlate with viability >70%. |
| CD86 Expression (Flow Cytometry) | Upregulation on viable DCs. | May increase on debris/dead cells (non-specific binding). | MFI increase >20% in viable cell gate. |
| IL-1β Secretion | Moderate, specific release. | Potentially high, non-specific release from pyroptosis/necrosis. | Level should be contextualized with cell death markers. |
| Genomic Biomarkers (qPCR) | Upregulation of AKR1C2, CCL2, CYP1A1. | Upregulation of general stress/ apoptosis genes (CHOP, NOXA). | Sensitization signature score vs. cytotoxicity signature score. |
| Histology (H&E) | Mild epidermal thickening, DC migration. | Severe epidermal damage, necrosis, vacuolization. | Qualitative assessment by pathologist. |
Detailed Experimental Protocols
Protocol 1: Tiered Assessment in a Reconstructed Human Epidermis (RhE) Model with Dendritic Cells
Objective: To evaluate a test substance for skin sensitization potential while controlling for cytotoxicity.
Materials:
- RhE model containing Langerhans cell-like dendritic cells (e.g., EpiDerm with DC, SkinEthic RHE with LC).
- Test substance and vehicle control.
- Positive controls: 0.1% DNCB (strong sensitizer), 1% SDS (irritant/cytotoxic control).
- Cell viability assay kit (e.g., MTT).
- ELISA kits for human IL-8 and IL-1β.
- RNA isolation kit and qPCR reagents.
- Dispersion medium (e.g., PBS or serum-free medium).
Procedure:
- Dose Range Finding: Perform a preliminary cytotoxicity assay (MTT) on the RhE model to determine the IC50 or the concentration that reduces viability to 70% (CV70).
- Main Exposure:
- Apply 20 µL of the test substance at three concentrations: a non-cytotoxic dose (e.g., 90% viability), a marginally cytotoxic dose (e.g., 75-80% viability), and the CV70. Include vehicle and controls.
- Incubate for 24h at 37°C, 5% CO₂.
- Post-Incubation Analysis:
- Viability: Perform MTT assay on the RhE model according to manufacturer's instructions.
- Cytokine Analysis: Collect culture medium. Centrifuge to remove debris. Analyze IL-8 and IL-1β levels via ELISA.
- Gene Expression: Isolate total RNA from the tissue. Perform reverse transcription and qPCR for a panel of sensitization (e.g., AKR1C2, CCL2) and cytotoxicity (e.g., ATF3, DDIT3/CHOP) biomarkers.
- Data Interpretation:
- A substance is considered a potential sensitizer if it induces a significant increase in IL-8 and sensitization biomarkers at a non- or marginally-cytotoxic concentration (viability >70%).
- A substance inducing IL-8/IL-1β only at concentrations below CV70 is likely acting via over-toxicity.
Protocol 2: Flow Cytometric Analysis of CD86 Expression on Viable DCs
Objective: To specifically measure DC activation in a mixed cell population, gating out dead cells.
Materials:
- Single-cell suspension from a dissociated 3D skin model.
- Anti-human CD86 antibody (fluorochrome-conjugated).
- Viability dye (e.g., propidium iodide or LIVE/DEAD fixable dye).
- Flow cytometry staining buffer (PBS + 2% FBS).
- Flow cytometer.
Procedure:
- After exposure, dissociate the 3D model enzymatically (e.g., dispase/ trypsin) to create a single-cell suspension.
- Wash cells twice with cold staining buffer.
- Stain with viability dye for 20-30 minutes on ice, in the dark.
- Wash cells, then block Fc receptors if necessary.
- Stain with anti-CD86 antibody for 30 minutes on ice, in the dark.
- Wash, resuspend in buffer, and analyze via flow cytometry.
- Gating Strategy: Gate on single cells > gate on viable cells (viability dye negative) > analyze CD86 mean fluorescence intensity (MFI) within the viable gate.
- Compare the MFI of treated viable cells to vehicle control. An increase specific to the viable population indicates true sensitization.
The Scientist's Toolkit
Table 2: Key Research Reagent Solutions for Sensitization Testing
| Item | Function in Assay |
|---|---|
| Reconstructed Human Epidermis (RhE) with DCs | 3D, physiologically relevant model containing keratinocytes and resident dendritic/Langerhans cells for integrated toxicity and immunology testing. |
| MTT (3-(4,5-Dimethylthiazol-2-yl)-2,5-Diphenyltetrazolium Bromide) | Tetrazolium salt reduced by metabolically active cells to a purple formazan; standard measure of cellular viability and cytotoxicity. |
| LIVE/DEAD Fixable Viability Dyes | Amine-reactive dyes that permanently stain non-viable cells before fixation, allowing for precise gating on live cells in downstream flow cytometry. |
| Human IL-8 (CXCL8) ELISA Kit | Quantifies secretion of a key pro-inflammatory chemokine robustly released by keratinocytes and DCs upon sensitizer exposure. |
| Sensitization Biomarker qPCR Array | Multiplexed panel for genes reliably upregulated by sensitizers (e.g., AKR1C2, CCL2, CYP1A1) to provide a genomic signature. |
| Anti-human CD86 (B7-2) Antibody | Marker for dendritic cell activation and maturation; measured via flow cytometry on viable cells to confirm specific immune activation. |
Visualizations
Mechanistic Pathways to Sensitization vs. Cytotoxicity
Integrated Workflow for Differentiated Assessment
Optimizing Exposure Times and Recovery Periods for Different Chemical Classes
Within the research context of a broader thesis on dendritic cell (DC) sensitization testing using 3D skin models, optimizing chemical exposure and subsequent recovery is paramount. This protocol outlines application notes for determining class-specific exposure times and recovery periods to reliably predict the sensitizing potential of chemicals, moving beyond traditional 2D assays.
Table 1: Recommended Exposure & Recovery Parameters for Key Chemical Classes in 3D Skin Model DC Assays
| Chemical Class | Representative Allergen(s) | Optimal Exposure Time (Hours) | Minimum Recovery Period (Hours) | Key Readout / Marker | Rationale |
|---|---|---|---|---|---|
| Pre-/Pro-Haptens | Cinnamaldehyde, Dinitrochlorobenzene | 24 - 48 | 24 - 48 | CD86, CD54, IL-8 | Requires oxidation or protein binding; sufficient time needed for conversion and DC maturation signal development. |
| Metal Salts | Nickel Sulfate, Potassium Dichromate | 48 - 72 | 48 - 72 | CD86, CD83, CXCL8, IL-1β | Often weak sensitizers; prolonged exposure needed for sufficient ion penetration and hapten-carrier complex formation in viable epidermis. |
| Oxidative Hair Dyes | p-Phenylenediamine (PPD) | 24 | 24 - 48 | CD86, CD54, HO-1, Nrf2 | Rapid oxidation and reaction; extended recovery allows for full manifestation of oxidative stress and maturation pathways. |
| Preservatives | Formaldehyde, Isothiazolinones | 24 | 24 | CD86, CD40, IL-6 | Direct protein reactivity; clear signal often detectable within standard timelines. |
| Fragrances | Hydroxycitronellal, Eugenol | 24 - 48 | 24 | CD86, CD54 | Variable potency; extended exposure may be needed for adequate penetration and response. |
Table 2: Impact of Recovery Period on Marker Expression for a Pro-Hapten (Cinnamaldehyde)
| Recovery Period (hrs) | CD86 MFI Fold Change | CD54 MFI Fold Change | IL-8 Secretion (pg/mL) | Viability (%) |
|---|---|---|---|---|
| 0 (Direct post-exposure) | 1.5 | 2.1 | 150 | 95 |
| 24 | 3.8 | 4.5 | 620 | 92 |
| 48 | 4.2 | 5.1 | 850 | 90 |
| 72 | 3.9 | 4.8 | 820 | 88 |
MFI: Mean Fluorescence Intensity; Data normalized to vehicle control.
Experimental Protocols
Protocol 1: Determining Class-Specific Exposure Time
Objective: To establish the minimum exposure duration required to initiate a consistent dendritic cell maturation signal for a new chemical within a known class. Materials: Reconstituted 3D epidermal model containing Langerhans cells (e.g., RHE-LC), test chemical in appropriate vehicle, maintenance medium, ELISA kits for cytokines, flow cytometry antibodies (anti-human CD86, CD54, HLA-DR). Procedure:
- Model Preparation: Acclimate 3D models per manufacturer's instructions (typically 24h in maintenance medium).
- Dosing: Apply 25 µL of test chemical solution (at sub-cytotoxic concentration, predetermined by MTT/ET-50) topically to the stratum corneum. Include vehicle control and reference sensitizer (e.g., NiSO₄ for metals, Cinnamaldehyde for pro-haptens).
- Exposure Time Course: Incubate models at 37°C, 5% CO₂ for varying durations (e.g., 6h, 12h, 24h, 48h). Use separate models for each time point.
- Termination & Sample Collection: At each time point, carefully rinse the model surface. For immediate analysis: Proceed to step 5. For recovery analysis: Replace with fresh medium and incubate for a standard 24h recovery period.
- Dissociation & Cell Harvest: Enzymatically dissociate the epidermal model according to kit instructions to create a single-cell suspension.
- Staining & Flow Cytometry: Stain cells with fluorochrome-conjugated antibodies against CD86, CD54, HLA-DR, and a viability dye. Analyze by flow cytometry. Gate on viable, HLA-DR+ dendritic cells to assess maturation marker expression (MFI fold change).
- Data Analysis: Plot MFI fold change versus exposure time. The optimal exposure time is the point where the signal plateaus or reaches a statistically significant threshold (e.g., ≥1.5-fold increase over vehicle control) without a significant drop in viability (<70%).
Protocol 2: Optimizing the Recovery Period
Objective: To determine the post-exposure recovery period that maximizes the detection of DC maturation signals, particularly for pro-haptens and metal salts. Materials: As in Protocol 1, plus materials for qPCR (optional). Procedure:
- Standardized Exposure: Expose all models to the test chemical at the class-optimized exposure time (from Protocol 1) and a sub-cytotoxic concentration.
- Recovery Time Course: After exposure and surface rinse, incubate models in fresh medium for varying recovery periods (e.g., 0h, 6h, 24h, 48h, 72h).
- Harvest and Multi-Parameter Analysis: At each recovery time point, harvest cells as in Protocol 1.
- Flow Cytometry: Perform as in Protocol 1, step 6.
- Supernatant Analysis: Assess secreted IL-8, IL-1β via ELISA.
- Gene Expression (Optional): Isolate RNA for qPCR analysis of genes like HMOX1 (HO-1), IL8, CD83.
- Kinetic Profiling: For each key endpoint (e.g., CD86 MFI), plot values against recovery time. The optimal recovery period is typically at or just after the peak of the response, prior to any decline indicative of signal resolution.
Visualization: Pathways and Workflow
Title: Chemical Sensitization Pathways in 3D Model Dendritic Cells
Title: Workflow for Optimizing Exposure & Recovery Times
The Scientist's Toolkit: Key Research Reagent Solutions
Table 3: Essential Materials for 3D Skin Model DC Sensitization Assays
| Item / Reagent | Function & Rationale |
|---|---|
| Reconstructed Human Epidermis with Langerhans Cells (RHE-LC) | Physiologically relevant 3D model containing a stratified, differentiated epidermis and functional, immature dendritic cells. Essential for penetration and metabolism studies. |
| Defined Sub-cytotoxic Dosing Concentrations | Test chemicals prepared at concentrations that maintain >70% viability (via MTT assay). Prevents confusion of maturation signals with general cytotoxicity. |
| Flow Cytometry Antibody Panel (Anti-human CD86, CD54, HLA-DR) | Gold-standard for quantifying DC maturation. HLA-DR gates DCs, CD86/CD54 are key upregulated costimulatory/adhesion molecules. |
| IL-8 & IL-1β ELISA Kits | Quantifies secreted pro-inflammatory chemokines/cytokines. IL-8 is a robust, early marker; IL-1β indicates inflammasome activation, key for some sensitizers. |
| RNAlater Stabilization Solution & qPCR Kits | For preserving RNA and analyzing gene expression changes (e.g., HMOX1, CD83), providing mechanistic insight beyond surface protein changes. |
| Enzymatic Dissociation Kit (e.g., based on Dispase/Trypsin) | Gently dissociates the 3D model into a viable single-cell suspension without destroying surface markers, enabling accurate flow cytometry. |
| Reference Sensitizers & Vehicle Controls | Positive controls (e.g., NiSO₄, Cinnamaldehyde, DNCB) and appropriate solvents (e.g., DMSO, acetone:olive oil) are critical for assay validation and data normalization. |
Within a broader thesis investigating dendritic cell (DC) sensitization testing using advanced 3D skin models, the integrity of the epidermal barrier and the overall viability of the tissue are non-negotiable prerequisites. Compromised barrier function invalidates DC migration and activation assays by allowing uncontrolled penetration of test compounds, leading to false-positive or false-negative sensitization outcomes. This document provides detailed Application Notes and Protocols to standardize the assessment and maintenance of these critical parameters.
Quantitative Metrics for Barrier Integrity and Viability
The following key quantitative measures must be routinely monitored. Data should be recorded and compared against established historical control ranges.
Table 1: Key Quantitative Metrics for 3D Skin Model QC
| Metric | Method (Detailed Below) | Acceptable Range (Typical) | Interpretation & Impact on DC Sensitization Assay |
|---|---|---|---|
| Transepithelial Electrical Resistance (TEER) | Voltohmmeter / EVOM | 1500 - 5000 Ω·cm² | Primary direct measure of paracellular barrier integrity. Low TEER indicates leaky tissue, permitting non-physiological allergen influx. |
| Barrier Integrity via Dye Permeation | Lucifer Yellow (LY) Flux Assay | < 1.5 x 10⁻³ cm/h (Permeability Coefficient) | Functional assay correlating with TEER. High LY flux confirms barrier failure. |
| Tissue Viability | MTT or AlamarBlue Assay | > 70% relative to untreated controls | Global measure of metabolic activity. Low viability induces non-specific inflammation, confounding DC activation readouts. |
| Trans-Epidermal Water Loss (TEWL) | Tewameter | Model-specific; Low & stable baseline. | Measures functional lipid barrier. Elevated TEWL indicates compromised stratum corneum, affecting chemical dosing. |
| Histological Scoring | H&E Staining | Stratum Corneum: Compact, multi-layered. Viable Layers: >4-6 cell layers. | Gold standard for structural assessment. Essential for verifying model morphology pre- and post-exposure. |
| Proinflammatory Cytokine Baselines | ELISA (e.g., IL-1α, IL-8) | < 50 pg/mL (model-dependent) | Elevated baselines signal pre-assay stress or irritation, which can prime DCs and skew sensitization potential. |
Detailed Experimental Protocols
Protocol 2.1: TEER Measurement for 3D Skin Models Grown on Inserts
Purpose: To quantitatively assess paracellular barrier integrity. Materials: 3D skin model on cell culture insert, Epithelial Voltohmmeter (e.g., EVOM3) with "chopstick" electrodes, pre-warmed assay medium (e.g., PBS⁺⁺ or culture medium without serum).
Procedure:
- Equilibration: Transfer the tissue insert to a new plate. Add pre-warmed assay medium to both the apical (0.5 mL) and basolateral (1.0 mL) compartments. Incubate for 30 min at RT.
- Instrument Calibration: Calibrate the voltohmmeter according to manufacturer instructions.
- Measurement: a. Sterilize electrodes with 70% ethanol and air dry. b. Place the shorter (apical) electrode in the insert and the longer (basolateral) electrode in the well outside the insert. Ensure electrodes do not touch the membrane or tissue directly. c. Record the resistance value (in Ω). Repeat for at least 3 locations per insert.
- Calculation: Subtract the background resistance of a blank insert (with medium only). Multiply the net resistance (Ω) by the effective surface area of the insert (cm²) to obtain TEER in Ω·cm².
- Post-Measurement: Return inserts to culture medium and incubate for 1 hour before proceeding with experiments to ensure barrier recovery.
Protocol 2.2: Lucifer Yellow (LY) Permeability Assay
Purpose: To functionally validate barrier integrity via tracer flux. Materials: Lucifer Yellow CH (LY) solution (100 µg/mL in Hanks’ Balanced Salt Solution, HBSS), 3D skin model on insert, transport plate, fluorescence microplate reader.
Procedure:
- Preparation: Pre-warm HBSS to 37°C. Prepare LY working solution.
- Dosing: Aspirate medium. Add LY solution to the apical compartment (e.g., 0.2 mL). Add plain HBSS to the basolateral compartment (e.g., 0.8 mL).
- Incubation: Incubate the plate at 37°C, 5% CO₂ for 1-2 hours.
- Sampling: Remove a 100 µL aliquot from the basolateral compartment. Replace with fresh pre-warmed HBSS.
- Analysis: Measure fluorescence of the basolateral sample (Ex/Em: 428/540 nm). Calculate the apparent permeability coefficient (Papp) using the formula: Papp (cm/s) = (dQ/dt) / (A * C₀) where dQ/dt is the flux rate (mol/s), A is the insert surface area (cm²), and C₀ is the initial apical donor concentration (mol/mL).
Protocol 2.3: Tissue Viability Assessment (MTT Assay)
Purpose: To determine the metabolic activity of the 3D tissue model post-treatment. Materials: MTT reagent (3-(4,5-dimethylthiazol-2-yl)-2,5-diphenyltetrazolium bromide), prepared at 1 mg/mL in serum-free medium, extraction solution (e.g., acidic isopropanol: 0.04N HCl in isopropanol).
Procedure:
- MTT Exposure: After experimental treatment and rinsing, add MTT solution to both apical and basolateral compartments.
- Incubation: Incubate for 3 hours at 37°C. A purple formazan precipitate will form in viable tissues.
- Extraction: Carefully remove MTT solution. Transfer tissues to a new plate. Add extraction solution to fully submerge each tissue. Incubate for 2+ hours at RT in the dark with gentle shaking.
- Quantification: Transfer 100 µL of extracted formazan solution (in triplicate) to a 96-well plate. Measure absorbance at 570 nm with a reference at 650 nm. Express viability as a percentage of the mean absorbance of untreated control tissues.
Visualized Workflows and Pathways
Title: QC Workflow for 3D Skin Model Pre-Assay Validation
Title: Barrier Integrity Loss Triggers DC Sensitization Pathway
The Scientist's Toolkit: Research Reagent Solutions
Table 2: Essential Materials for Barrier & Viability Assessment
| Item / Reagent Solution | Function & Rationale |
|---|---|
| Epithelial Voltohmmeter (e.g., EVOM3) | Provides precise, non-destructive TEER measurements. The gold-standard instrument for tracking barrier development and integrity in real-time. |
| Lucifer Yellow CH | Small, hydrophilic fluorescent tracer (457 Da). Ideal for quantifying paracellular permeability; does not readily cross intact tight junctions. |
| MTT Cell Viability Assay Kit | Reliable colorimetric assay to measure mitochondrial activity in 3D tissues. Critical for assessing compound cytotoxicity prior to DC assays. |
| Precision Parafilm or Scaling Film | Used to create a tight seal around insert rims during permeability assays, preventing edge-diffusion artifacts and ensuring accurate P_app calculation. |
| Matrigel (Growth Factor Reduced) | Used for embedding DCs or supporting certain full-thickness model types. Provides a physiological 3D matrix that influences barrier formation and cell signaling. |
| Cytokine ELISA Kits (IL-1α, IL-8, TSLP) | Quantify baseline and induced proinflammatory cytokine release. Elevated levels are early indicators of model stress that can pre-activate DCs. |
| Tissue Histology Fixative (e.g., Neutral Buffered Formalin) | Essential for preserving tissue architecture for H&E staining, allowing direct visualization of stratum corneum and viable layer integrity. |
| Serum-Free, Phenol Red-Free Assay Medium | Used during TEER and permeability assays. Eliminates interference from serum proteins and dye during fluorescence/absorbance readings. |
Benchmarking Performance: Validation, Predictivity, and Comparison to Other Methods
Within the broader thesis investigating the application of 3D skin models for in vitro assessment of chemical sensitization potential, the validation of the test method is paramount. A key objective is to evaluate the performance of a novel protocol utilizing dendritic cell (DC) maturation markers (e.g., CD86, CD54, OX40L) in a reconstructed human epidermis (RhE) model containing Langerhans cells or DCs. This application note details the statistical outcomes—Sensitivity, Specificity, and Accuracy—that form the cornerstone of the validation study, providing researchers with a framework for protocol execution and data analysis.
Definitions & Quantitative Data Framework
Performance metrics are calculated from a 2x2 contingency table comparing the test method results against a defined reference set (e.g., LLNA, human data).
- Sensitivity (True Positive Rate): Proportion of actual sensitizers correctly identified.
- Formula: Sensitivity = TP / (TP + FN)
- Specificity (True Negative Rate): Proportion of actual non-sensitizers correctly identified.
- Formula: Specificity = TN / (TN + FP)
- Accuracy: Overall proportion of correct predictions.
- Formula: Accuracy = (TP + TN) / (TP + TN + FP + FN)
TP=True Positive, TN=True Negative, FP=False Positive, FN=False Negative.
Table 1: Example Validation Study Outcomes for a 3D Skin DC Sensitization Test
| Performance Metric | Calculated Value (%) | 95% Confidence Interval | Interpretation in Context |
|---|---|---|---|
| Sensitivity | 89 | 78 – 95 | Correctly identifies 89% of known skin sensitizers. |
| Specificity | 85 | 73 – 93 | Correctly identifies 85% of known non-sensitizers. |
| Accuracy | 87 | 80 – 92 | Overall, 87% of all tested chemicals are correctly classified. |
Experimental Protocol: DC Maturation Assay in 3D Skin Models
A. Key Research Reagent Solutions
| Item | Function in Experiment |
|---|---|
| Reconstructed Human Epidermis (RhE) with DCs | 3D tissue model providing a physiologically relevant microenvironment for chemical exposure and DC response. |
| Test Chemicals (Sensitizers/Non-Sensitizers) | Positive controls (e.g., DNCB, NiSO₄), negative controls (e.g., SLS, Glycerol), and compounds under investigation. |
| Cell Dissociation Reagent | Enzymatic solution for gentle disaggregation of the 3D model post-exposure to retrieve embedded DCs for flow cytometry. |
| Fluorochrome-conjugated Antibodies | Anti-human CD86, CD54, HLA-DR, CD1a, etc. for staining and quantifying DC surface marker expression. |
| Flow Cytometry Viability Stain | To exclude dead cells from the analysis, ensuring signal specificity. |
| Mathematical Prediction Model | Algorithm (e.g., derived from logistic regression) that converts marker expression data (MFI) into a binary prediction (Sensitizer/Non-Sensitizer). |
B. Detailed Methodology
- Chemical Exposure:
- Apply test chemicals (non-cytotoxic concentrations) topically to the surface of the RhE-DC model (n≥3 tissues per concentration).
- Incubate for a defined period (e.g., 24h) under standard cell culture conditions.
Single-Cell Suspension Preparation:
- Wash tissues and enzymatically dissociate using a validated protocol.
- Filter cell suspension through a 70µm strainer. Count cells.
Immunostaining & Flow Cytometry:
- Aliquot cells for staining panels.
- Incubate with viability dye and antibody cocktails targeting DC markers.
- Wash, fix, and acquire data on a flow cytometer.
Data Analysis & Classification:
- Gate on viable, single, CD1a+/HLA-DR+ dendritic cells.
- Calculate the Mean Fluorescence Intensity (MFI) for maturation markers (e.g., CD86) for each test condition.
- Input the MFI (or fold-change over vehicle control) into the predefined prediction model.
- Record the binary outcome (Positive/Negative) for each chemical.
Visualization of Experimental Workflow & Data Interpretation
Validation Study Workflow from Setup to Metrics
2x2 Table Driving Metric Calculations
This application note is framed within a broader thesis investigating the role of 3D reconstructed human epidermis (RhE) models containing functional Langerhans cells (LCs) for advanced sensitization testing. The research thesis posits that 3D models more accurately replicate the complex immunobiological events of skin sensitization—including chemical penetration, keratinocyte activation, LC maturation, and migration—compared to standalone 2D in vitro assays. While the OECD-adopted 2D assays KeratinoSens (KE-1, addressing the Keap1-Nrf2-ARE pathway) and h-CLAT (addressing CD86 and CD54 expression on THP-1 cells) provide valuable mechanistic data, they represent isolated key events (KE) 2 and 3, respectively, of the Adverse Outcome Pathway (AOP) for skin sensitization. This analysis compares the predictive performance, biological relevance, and practical application of these integrated 3D models against the established 2D battery.
Table 1: Predictive Performance Comparison (Based on Published Validation Studies)
| Assay System | AOP Key Event(s) Covered | Measured Endpoint(s) | Accuracy (%) | Sensitivity (%) | Specificity (%) | Throughput | Regulatory Status |
|---|---|---|---|---|---|---|---|
| KeratinoSens | KE2: Keratinocyte response | Nrf2-mediated luciferase gene activation (ICCVAM, 2015) | ~83% | ~85% | ~79% | High | OECD TG 442D |
| h-CLAT | KE3: Dendritic cell activation | Surface CD86 & CD54 expression (ECVAM-validated) | ~89% | ~88% | ~89% | Medium-High | OECD TG 442E |
| 2D Battery (KE1/KE2/KE3) | KE1,2,3 (Combined) | DPRA + KeratinoSens + h-CLAT | ~93% | ~95% | ~90% | Medium | OECD Integrated Approach |
| 3D Skin Model with LCs | KE1-4 (Integrated) | Cell viability, IL-18 release, LC markers (CD86, CD83, HLA-DR), migration | ~91-95%* | ~90-94%* | ~92-96%* | Low-Medium | Under Development/Validation |
*Data from recent peer-reviewed studies (2023-2024) on models like EpiDerm SIT, SkinEthic RHE-LC, and LabCyte Epi-Model. Performance varies by specific model and protocol.
Table 2: Biological Complexity and Practical Considerations
| Parameter | 3D Skin Model with LCs | 2D Assay Battery (KeratinoSens/h-CLAT) |
|---|---|---|
| Tissue Architecture | Stratified, differentiated epidermis, functional barrier, resident LCs. | Monolayer cultures of immortalized cell lines. |
| Biological Endpoints | Integrated: viability, cytokine release (e.g., IL-18), LC activation/migration. | Isolated: Nrf2 activation, surface marker expression. |
| Metabolic Capacity | Native keratinocyte metabolism; some models include fibroblasts. | Lacks native metabolic context unless co-cultured. |
| Chemical Applicability | Can test liquids, solids, creams; uses topical exposure. | Typically limited to soluble chemicals. |
| Cost per Test | High | Low to Moderate |
| Time to Result | 5-7 days (including culture) | 2-3 days |
Detailed Experimental Protocols
Protocol 3.1: Sensitization Assessment Using a 3D Epidermal Model with Langerhans Cells
Title: Assessment of Skin Sensitization Potential via Topical Exposure on a Reconstructed Human Epidermis Model Containing Langerhans Cells.
Principle: The test substance is applied topically to the 3D RhE-LC model. Following exposure and a recovery period, sensitizer-induced effects are measured via a combination of tissue viability (MTT assay), release of the inflammatory cytokine IL-18, and analysis of LC activation markers (e.g., via flow cytometry of migrated cells or immunohistochemistry).
Materials:
- RhE-LC model kits (e.g., EpiDerm SIT, SkinEthic RHE-LC).
- Test and control substances, vehicle.
- Maintenance/assay medium as per model supplier.
- MTT reagent (1 mg/mL) or other viability dye.
- IL-18 ELISA kit.
- Migration medium (e.g., containing CCL19/MIP-3β).
- Flow cytometry antibodies: anti-human CD1a, HLA-DR, CD86, CD83.
- Multi-well plates, topical exposure systems.
Procedure:
- Pre-conditioning: Equilibrate RhE-LC tissues in maintenance medium for 1-2 hours at 37°C, 5% CO₂.
- Topical Exposure: Apply 10-20 µL of the test substance (or vehicle control) directly to the epidermal surface. Include a positive control (e.g., 1% DNCB) and a negative control (vehicle). Incubate for a defined period (e.g., 24h ± 2h).
- Post-Exposure Recovery: Carefully wash the tissue surface to remove residual test substance. Transfer tissues to fresh medium and incubate for an additional 24-48 hours to allow for biological response.
- Viability Assessment (MTT): Transfer tissues to MTT solution. Incubate for 3 hours. Extract formazan crystals and measure absorbance at 570 nm. Calculate viability relative to negative control.
- Biomarker Analysis:
- IL-18 Release: Collect culture media from the recovery period. Quantify IL-18 concentration using a validated ELISA.
- LC Activation/Migration: For migration analysis, place tissues in a transwell system with migration medium in the lower chamber. After 24-48h, collect cells that have migrated into the lower chamber. Stain with fluorochrome-conjugated antibodies (CD1a, HLA-DR, CD86, CD83) and analyze by flow cytometry. Calculate the percentage of CD1a+ cells expressing activation markers.
- Data Interpretation: A substance is classified as a sensitizer if it significantly reduces viability (e.g., <50%) AND/OR significantly increases IL-18 release AND/OR induces a significant increase in LC activation markers compared to the negative control, based on pre-defined thresholds.
Protocol 3.2: The 2D KeratinoSens and h-CLAT Assay Battery
Title: Consecutive Testing for Skin Sensitization Using the KeratinoSens (KE2) and h-CLAT (KE3) Assays.
Principle: The KeratinoSens assay measures the activation of the Nrf2-mediated antioxidant response element (ARE) pathway in an immortalized keratinocyte cell line via a luciferase reporter. The h-CLAT assay measures the upregulation of the surface markers CD86 and CD54 on the human monocytic leukemia cell line THP-1, indicative of dendritic cell-like activation.
Materials:
- KeratinoSens: KeratinoSens cells (CVCL_S981), assay medium, luciferase lysis & assay reagents, reference sens/non-sens chemicals.
- h-CLAT: THP-1 cells (CVCL_0006), RPMI-1640 + 10% FBS, FITC-conjugated anti-human CD86 and CD54 antibodies, flow cytometer, reference chemicals.
- Common: 96-well cell culture plates, cytotoxicity detection reagents (e.g., MTT, Resazurin).
Procedure Part A: KeratinoSens (OECD TG 442D)
- Seed KeratinoSens cells in 96-well plates and incubate for 24h.
- Expose cells to 8 concentrations of test chemical (non-cytotoxic range) for 48h.
- Measure cell viability (e.g., via MTT) and luciferase activity.
- Interpretation: An inducer is positive if it causes a ≥1.5-fold induction of luciferase activity relative to solvent control at any concentration where viability is ≥70%.
Procedure Part B: h-CLAT (OECD TG 442E)
- Culture THP-1 cells in log-phase growth.
- Expose cells to 5-6 concentrations of test chemical for 24h. Determine the CV75 (concentration causing 25% cytotoxicity) using a viability assay (e.g., MTT).
- Perform a second exposure at the CV75, CV75/2, and CV75/4 concentrations for 24h.
- Harvest cells, stain with FITC-anti-CD86 and FITC-anti-CD54 antibodies.
- Analyze by flow cytometry. Calculate Relative Fluorescence Intensity (RFI).
- Interpretation: A chemical is positive if, at any test concentration, RFI for CD86 ≥150% or RFI for CD54 ≥200%.
Diagrams and Signaling Pathways
Title: AOP for Skin Sensitization & Assay Coverage Map
Title: 2D vs 3D Experimental Workflow Comparison
The Scientist's Toolkit: Essential Research Reagents and Materials
Table 3: Key Research Reagent Solutions for Skin Sensitization Testing
| Item | Function/Application | Example/Supplier Notes |
|---|---|---|
| Reconstructed Human Epidermis with LCs | Core test system for 3D assays. Provides a physiologically relevant tissue structure. | EpiDerm SIT (MatTek), SkinEthic RHE-LC (Episkin), LabCyte Epi-Model LC (Japan Tissue Eng.). |
| KeratinoSens Cell Line | Stably transfected HaCaT cells with a luciferase reporter under ARE control for KE2 testing. | Available from Givaudan. Requires specific assay medium. |
| THP-1 Cell Line | Human monocytic cell line used as a model for dendritic cell-like activation in h-CLAT. | Must be maintained in log-phase growth; monitor CD14/CD86 expression. |
| Interleukin-18 (IL-18) ELISA Kit | Quantifies a key keratinocyte-derived cytokine central to the sensitization cascade in 3D models. | Kits from MBL, R&D Systems, Invitrogen. Critical for 3D model endpoint. |
| Fluorochrome-conjugated Antibodies | Detection of LC/T-cell activation markers (CD1a, CD86, CD83, HLA-DR, CD54). | Antibodies from BD Biosciences, BioLegend, Miltenyi Biotec. Essential for flow cytometry. |
| MTT Assay Kit | Standard colorimetric assay for measuring cell/tissue viability (mitochondrial activity). | Widely available (Sigma, Thermo Fisher). Used in all described protocols. |
| Luciferase Assay System | Measurement of Nrf2/ARE pathway activation in KeratinoSens cells. | One-Glo or Bright-Glo systems (Promega) are commonly used. |
| Chemotaxis/Migration Medium | Contains chemoattractants (e.g., CCL19) to stimulate LC migration from 3D models for analysis. | Often prepared in-house with recombinant human chemokines (PeproTech, R&D Systems). |
| Reference Control Chemicals | Essential for assay standardization and validation (Positive/Negative controls). | E.g., DNCB (Strong sens), NiSO4 (Moderate sens), Glycerol (Non-sens). |
The development of advanced in vitro 3D skin models featuring functional dendritic cells (DCs) represents a pivotal advancement in skin sensitization testing. This research is central to a broader thesis aiming to replace traditional animal-based methods, like the murine Local Lymph Node Assay (LLNA), with human-relevant, mechanistic alternatives. Validating these complex models requires rigorous comparison against two historical "gold standards": the LLNA (the regulatory animal standard) and human data (the ultimate biological standard). This application note details the correlation data and protocols for such comparative analyses, essential for proving the predictive capacity of 3D DC-based test methods.
The accuracy of 3D skin model DC activation assays is benchmarked against LLNA results (EC3 values) and human potency classifications (from human repeat insult patch test (HRIPT) data or epidemiological evidence). Key predictive endpoints include the upregulation of specific DC surface markers (e.g., CD86, CD54, OX40L), secretion of chemokines (e.g., CCL18, CCL22), and genomic biomarkers.
Table 1: Correlation of 3D Model DC Biomarker with LLNA EC3 and Human Potency
| Test Chemical (Example) | LLNA Result (EC3% Category) | Human Potency (UN GHS) | 3D Model DC Response (e.g., CD86 MFI Fold-Change) | Prediction Accuracy vs. LLNA | Prediction Accuracy vs. Human |
|---|---|---|---|---|---|
| 2,4-Dinitrochlorobenzene (DNCB) | <0.1% (Extreme) | 1A (Strong) | >2.5 (Positive) | Correct | Correct |
| Hexyl Cinnamal | ~5.0% (Weak) | 1B (Moderate) | 1.8 - 2.5 (Positive) | Correct | Correct |
| Glycerol | >25% (Non-sensitizer) | Non-sensitizer | <1.5 (Negative) | Correct | Correct |
| Methyl heptine carbonate | 1.5% (Moderate) | 1B (Moderate) | >2.5 (Positive) | Correct | Correct |
| Salicylic Acid | Non-sensitizer (Irritant) | Non-sensitizer | <1.5 (Negative) | Correct (Discriminates irritant) | Correct |
Table 2: Performance Metrics of a Prototypical 3D DC Model Assay
| Comparative Benchmark | Sensitivity (%) | Specificity (%) | Accuracy (%) | Concordance |
|---|---|---|---|---|
| vs. LLNA (n=XX chemicals) | 89 | 85 | 88 | 87% |
| vs. Human Potency (n=XX chemicals) | 85 | 95 | 89 | 90% |
Detailed Experimental Protocols
Protocol A: Assessing DC Activation in a 3D Reconstructed Human Epidermis (RHE) Model
Objective: To quantify chemical-induced dendritic cell activation via surface marker expression. Materials: See "Research Reagent Solutions" below. Workflow:
- Model Equilibration: Transfer RHE-DC models to 6-well plates. Incubate overnight in maintenance medium at 37°C, 5% CO₂.
- Chemical Application:
- Prepare test chemicals in appropriate vehicle (e.g., DMSO, acetone:olive oil).
- Apply 20 µL of solution topically to the stratum corneum. Run in triplicate.
- Include controls: Vehicle control (negative), DNCB 10 µM (positive).
- Exposure Incubation: Incubate for 24 ± 2 hours.
- Cell Isolation & Staining:
- Rinse models and enzymatically dissociate (e.g., using dispase/trypsin) to create a single-cell suspension.
- Stain cells with fluorescently conjugated antibodies against HLA-DR, CD86, CD54, and a viability dye.
- Include appropriate isotype controls.
- Flow Cytometry Analysis:
- Gate on viable, HLA-DR+ cells (the DC population).
- Measure Mean Fluorescence Intensity (MFI) for CD86 and CD54.
- Calculate fold-change relative to the vehicle control.
- Data Interpretation: A fold-change ≥ 1.5 (or predetermined threshold) for CD86/CD54 is considered a positive sensitization response.
Protocol B: Correlation Analysis with LLNA EC3 Values
Objective: To establish a quantitative relationship between in vitro potency and LLNA EC3. Method:
- Data Compilation: For a set of reference chemicals, compile:
- LLNA EC3 values (from published databases).
- In vitro potency metric (e.g., the estimated concentration from the 3D model that induces a 1.5-fold increase in biomarker, termed In vitro EC150).
- Log-Transformation: Convert both EC3 and In vitro EC150 values to log10 scale.
- Linear Regression: Perform a linear regression analysis: log(LLNA EC3) = a × log(In vitro EC150) + b.
- Validation: Assess the correlation coefficient (R²). A high R² indicates the 3D model can accurately predict in vivo animal potency.
Visualizations
Title: 3D DC Assay Validation Workflow
Title: Key Events in 3D DC Activation Pathway
The Scientist's Toolkit: Research Reagent Solutions
| Item | Function/Benefit | Example/Catalog |
|---|---|---|
| Reconstructed Human Epidermis model with DCs | 3D tissue containing functional Langerhans cells/dendritic cells for physiologically relevant sensitization testing. | EpiDerm SIT (EPI-212-SIT), SkinEthic RHE with LC model. |
| DC Maturation Marker Antibody Panel | Flow cytometry antibodies to quantify activation (CD86, CD54, HLA-DR, OX40L). Essential for endpoint measurement. | Anti-human CD86-FITC, CD54-PE, HLA-DR-APC. |
| Reference Sensitizers & Controls | Certified chemical standards for assay calibration and validation (positive/negative controls). | DNCB (Strong), Benzocaine (Non-sensitizer/Irritant). |
| Viability/Cytotoxicity Assay Kit | Measures cell viability (e.g., MTT, LDH) to discriminate cytotoxicity from specific activation. | MTT Assay Kit, LDH Cytotoxicity Assay Kit. |
| Chemokine ELISA/Single-Cell Secretion Assay | Quantifies secretion of DC-derived chemokines (e.g., CCL18, CCL22) as a functional maturation readout. | Human CCL18 ELISA Kit. |
| High-Throughput Flow Cytometer with 96-well loader | Enables rapid, automated acquisition of multi-parameter cell data from multiple treated samples. | e.g., BD FACSymphony A5, iQue3. |
| Data Analysis Software (for Potency Prediction) | Specialized software for calculating fold-change, dose-response, and predicting GHS potency classes. | e.g., Genedata, custom R/Python scripts. |
Within the broader thesis on advancing next-generation risk assessment for skin sensitization, a critical gap exists in bridging in chemico and in vitro assays with complex tissue responses. This application note details an integrated testing strategy (ITS) that synergizes the Direct Peptide Reactivity Assay (DPRA), genomic biomarker signatures, and activation responses from 3D dendritic cell (DC)-containing skin models. This ITS framework aims to move beyond standalone assays, providing a mechanistic, weight-of-evidence approach for predicting human sensitization potential with high accuracy, while reducing reliance on animal testing.
Application Notes
Rationale for Integration
Single assays capture specific key events (KE) from the Adverse Outcome Pathway (AOE) for skin sensitization. The DPRA addresses KE1 (Molecular Initiating Event: covalent binding to skin proteins). Genomic signatures from 2D cultures (e.g., THP-1 or U937) quantify KE2 (Keratinocyte/DC activation) at the transcriptional level. 3D DC assays model KE2/KE3 within a physiologically relevant tissue architecture, capturing cell-cell interactions and bioavailability. Their combination increases predictivity and provides insight into chemical potency.
Key Advantages of the Combined Strategy
- Mechanistic Resolution: Distinguishes sensitizers from non-sensitizers and subclassifies sensitizers (e.g., pre/pro-haptens).
- Potency Assessment: Correlation of peptide depletion, biomarker fold-change, and 3D DC activation (e.g., CD86 expression) enables ranking.
- False Positive/Negative Mitigation: Compounds misleading in one assay (e.g., irritants in cell assays) are contextualized by other data points.
- Tissue Context: The 3D model integrates compound penetration and metabolism, addressing a key limitation of 2D systems.
Data Integration and Interpretation Framework
A tiered analysis is recommended:
- DPRA Triage: >10% cysteine peptide depletion suggests electrophilic potential.
- Genomic Signature Confirmation: Apply a defined biomarker panel (e.g., ARE/Nrf2, inflammatory genes) to confirm cellular stress response.
- 3D DC Functional Validation: Confirm DC maturation (surface marker modulation) in a tissue context. Discordant results require expert review considering chemistry and assay limitations.
Table 1: Representative Quantitative Data from an Integrated Assessment of Model Sensitizers
| Compound (Potency) | DPRA: % Cysteine Depletion (Mean ± SD) | Genomic Signature: Fold-Change (Key Gene) | 3D DC Model: %CD86+ DCs (vs. Vehicle) | ITS Prediction |
|---|---|---|---|---|
| DNCB (Extreme) | 95.2 ± 3.1 | NQO1: 12.5x | 215% | Sensitizer |
| HCA (Strong) | 87.5 ± 5.6 | IL-8: 8.2x | 180% | Sensitizer |
| Nickel (Moderate) | 5.1 ± 2.0 (Low Reactivity) | IL-1β: 6.8x | 155% | Sensitizer* |
| SLS (Irritant) | 2.3 ± 1.5 | ARE Genes: <1.5x | 105% (Cytotoxicity >20%) | Non-Sensitizer |
| Vehicle | 1.8 ± 1.2 | 1.0x | 100% (Baseline) | - |
Note: Nickel's low DPRA reactivity highlights its metal-specific activation mechanism, detected by genomic and 3D assays.
Experimental Protocols
Protocol 1: Direct Peptide Reactivity Assay (DPRA)
Principle: Measures depletion of synthetic cysteine and lysine peptides after 24h co-incubation with test chemical, simulating haptenation.
Materials:
- Peptide stock solutions: Cysteine peptide (Ac-RFAACAA-COOH), Lysine peptide (Ac-RFAAKAA-COOH).
- Test chemical dissolved in Acetonitrile/Water (50/50 v/v) or appropriate solvent.
- Phosphate buffer (0.1 M, pH 7.5) and Acetate buffer (0.1 M, pH 10.2).
- HPLC system with UV detector (220nm).
Procedure:
- Prepare 0.5 mM peptide solutions in respective buffers (Cysteine in phosphate pH 7.5; Lysine in acetate pH 10.2).
- Mix 50 µL of each peptide solution with 50 µL of test chemical (5 mM final concentration) or vehicle control. Incubate at 25°C for 24h.
- Stop reaction by diluting 1:10 with 0.1% formic acid in water.
- Analyze by HPLC. Calculate peptide depletion:
% Depletion = (1 - (Peptide Peak Area Chemical / Peptide Peak Area Control)) x 100. - Prediction Model: Average % depletion of cysteine and lysine peptides. <6.38% = Non-sensitizer; ≥6.38% = Sensitizer (based on published OECD TG 442C).
Protocol 2: Genomic Signature Quantification in THP-1 Cells
Principle: Quantifies mRNA expression changes in a biomarker panel after 24h chemical exposure.
Materials:
- THP-1 cell line.
- RT-qPCR system, validated primers (e.g., for NQO1, KEAP1, IL-8, ATF3, GAPDH/HPRT1).
- RNA extraction kit, cDNA synthesis kit.
Procedure:
- Culture THP-1 cells in RPMI-1640 + 10% FBS. Seed at 0.5x10^6 cells/mL in 24-well plates.
- Expose cells to non-cytotoxic concentration (pre-determined by MTT assay) of test chemical for 24h.
- Harvest cells, extract total RNA, and synthesize cDNA.
- Perform RT-qPCR for target genes and housekeeping genes. Use the 2^(-ΔΔCt) method to calculate fold-change versus vehicle control.
- Prediction Model: Apply a defined classification algorithm (e.g., SENS-IS or GARD signatures) or use a combination of key genes (e.g., ≥1.5-fold increase in at least 2 of 4 oxidative stress/inflammatory genes) to indicate a positive sensitization response.
Protocol 3: Dendritic Cell Activation in a 3D Reconstructed Human Skin Model
Principle: Measures DC activation markers (CD86, CD54) and viability in an epidermal tissue containing Langerhans-like cells after topical exposure.
Materials:
- Commercial 3D epidermal model with incorporated immature DCs (e.g., EpiDerm SIT, SkinEthic RHE/LR, or equivalent).
- Assay medium per model instructions.
- Flow cytometry antibodies: anti-human CD86-FITC, CD54-PE, HLA-DR-APC, viability dye.
- Topical exposure setup.
Procedure:
- Exposure: Apply 25 µL of test chemical (in appropriate vehicle) topically to the 3D model surface. Incubate for 24-48h at 37°C, 5% CO2. Include vehicle control and positive control (e.g., 0.5% DNCB).
- Cell Extraction: Disaggregate the epidermal tissue using gentle enzymatic digestion (e.g., dispase/trypsin) to obtain a single-cell suspension.
- Staining: Stain cells with antibody cocktail and viability dye for 30min at 4°C. Wash and resuspend in buffer.
- Flow Cytometry: Acquire data on a flow cytometer. Gate on viable, HLA-DR+ cells (DC population).
- Analysis: Calculate the geometric mean fluorescence intensity (MFI) for CD86/CD54 and/or the percentage of CD86+ cells within the viable DC gate. A ≥1.5-fold increase in MFI or a statistically significant increase in % positive cells versus vehicle indicates a positive response.
Visualizations
Title: Assay Mapping to Sensitization AOP
Title: Integrated Testing Strategy Workflow
The Scientist's Toolkit: Key Research Reagent Solutions
Table 2: Essential Materials for Integrated Sensitization Testing
| Item / Reagent | Function in the ITS Context | Example/Supplier Note |
|---|---|---|
| Cysteine & Lysine Peptides | Synthetic surrogates for skin proteins in DPRA (OECD TG 442C). | High-purity HPLC-grade peptides (e.g., Ac-RFAACAA-COOH). |
| 3D Epidermal Model with DCs | Provides a physiologically relevant tissue for topical application and DC activation readout. | EpiDerm SIT (MatTek), SkinEthic RHE with LC (Episkin), Phenion FT. |
| Flow Cytometry Antibody Panel | Quantifies DC maturation markers (CD86, CD54, HLA-DR) from disaggregated 3D models. | Anti-human CD86, CD54, HLA-DR (conjugated to different fluorochromes). |
| Validated qPCR Assay Panels | For quantifying genomic biomarker signatures in 2D cell exposures. | Commercial sensitization panels (e.g., SENS-IS qPCR array) or custom-designed assays. |
| Cytotoxicity Assay Kits | Critical for determining non-cytotoxic concentrations for cell-based assays (Genomic & 3D). | MTT, MTS, or ATP-based assay kits (e.g., CellTiter-Glo 3D). |
| HPLC System with UV Detector | Essential equipment for analyzing peptide depletion in the DPRA. | Standard analytical HPLC system capable of running isocratic methods. |
Within the broader thesis on advancing skin sensitization testing using 3D skin models with integrated dendritic cells (DCs), a critical challenge is the accurate assessment of pro-haptens, pre-haptens, and difficult-to-test substances. Traditional 2D assays and even some 3D models may not fully capture the metabolic activation and complex cellular interactions required for these compounds. This application note details protocols and strategies to address these limitations, enhancing the predictive capacity of in vitro sensitization testing.
Definitions and Key Challenges
Substance Classifications
- Pro-haptens: Substances requiring enzymatic transformation (e.g., Phase I metabolism) to become reactive haptens. Example: Cinnamic alcohol metabolized to cinnamic aldehyde.
- Pre-haptens: Substances that are activated by abiotic processes like air oxidation to form reactive haptens. Example: Limonene oxidizing to limonene oxide.
- Difficult-to-Test Substances: Include hydrophobic chemicals, surfactants, polymers, or substances with high cytotoxicity that interfere with standard assay endpoints.
The following table summarizes the reported accuracy challenges of standard in vitro assays for these substance classes compared to animal or human data.
Table 1: Performance Gaps of Standard In Vitro Assays for Problematic Substance Classes
| Substance Class | Example Compounds | Reported Sensitivity in Standard Assays* | Reported Specificity in Standard Assays* | Key Limitation Addressed by 3D DC Models |
|---|---|---|---|---|
| Pro-haptens | Cinnamic alcohol, Eugenol | ~50-60% | ~85-90% | Lack of metabolic competence |
| Pre-haptens | Limonene, Farnesol | ~40-55% | ~80-88% | Lack of abiotic oxidation simulation |
| Hydrophobic Substances | Hexyl cinnamal, Retinyl palmitate | Variable, often false negatives | High | Poor bioavailability in aqueous systems |
| Surfactants/Cytotoxic | SDS, Benzalkonium chloride | Variable, often false positives | ~70-75% | Overwhelming cytotoxicity masking immune endpoints |
*Values aggregated from recent literature (OECD TG 497, 2023; ALTEX, 2022).
Experimental Protocols
Protocol 1: Integrated Metabolic Competence for Pro-hapten Testing
Objective: To evaluate pro-hapten sensitization potential in a 3D skin model with enhanced Phase I metabolic activity.
Materials:
- Reconstructed human epidermis (RHE) model with integrated CD34+ progenitor-derived dendritic cells (e.g., SenSkin, EpiDerm SIT).
- Test pro-hapten (e.g., Cinnamic alcohol).
- CYP450 inducer (e.g., 50 μM Rifampicin in culture medium).
- Metabolic activity assay kit (e.g., Luciferin-IPA for CYP3A4 activity).
- Flow cytometry antibodies: anti-CD86-APC, anti-CD54-PE, anti-HLA-DR-FITC.
- ELISA kits for IL-8, IL-1β.
Methodology:
- Pre-conditioning (Day -3): Treat the 3D skin model from the basal side with CYP450 inducer for 72 hours to upregulate metabolic enzymes.
- Metabolic Verification (Day 0): Prior to test substance application, assess CYP450 activity in a sacrificial replicate using a luminescent substrate assay.
- Substance Application (Day 0): Apply the pro-hapten (non-cytotoxic concentration, determined by MTT) topically to the stratum corneum.
- Incubation (Days 0-3): Incubate for 48-72 hours to allow metabolic conversion and DC activation.
- Analysis (Day 3):
- Tissue Viability: MTT assay on separate tissue replicate.
- DC Activation: Digest the model to create a single-cell suspension. Analyze DC markers (CD86, CD54, HLA-DR) via flow cytometry. A ≥1.5-fold increase in MFI (Mean Fluorescence Intensity) over vehicle control is considered positive.
- Cytokine Secretion: Analyze culture supernatant for IL-8 and IL-1β.
Protocol 2: Pre-hapten Oxidation and Application Workflow
Objective: To assess pre-hapten sensitization potential by incorporating an abiotic oxidation step prior to exposure.
Materials:
- 3D skin model with integrated DCs.
- Test pre-hapten (e.g., Limonene).
- Forced oxidation system: UV light chamber (UVA, 1-5 J/cm²) or chemical oxidant (e.g., tert-Butyl hydroperoxide at low mM range).
- Gas Chromatography-Mass Spectrometry (GC-MS) for oxidation product verification.
Methodology:
- Pre-oxidation (Day -1):
- UV Method: Expose neat test substance or a thin film in a quartz dish to UVA light at a calibrated dose.
- Chemical Method: Incubate test substance with a mild oxidant in solution.
- Verify oxidation product formation (e.g., limonene oxide) using GC-MS.
- Preparation of Oxidized Sample: Dilute oxidized product in appropriate vehicle (e.g., acetone:olive oil 4:1) to a non-cytotoxic concentration.
- Application and Analysis: Follow steps 3-5 from Protocol 1, applying the oxidized sample topically. Always run a parallel control of the non-oxidized substance.
Key Signaling Pathways in DC Activation by Haptens
Hapten-Induced Skin Sensitization Pathway
Integrated Testing Strategy Workflow
Testing Workflow for Problematic Haptens
The Scientist's Toolkit: Research Reagent Solutions
Table 2: Essential Materials for Advanced Sensitization Testing
| Item / Reagent | Function & Rationale |
|---|---|
| 3D Skin Model with Integrated DCs (e.g., SenSkin, EpiDerm SIT) | Provides a full-thickness structure with a functional stratum corneum, keratinocytes, and antigen-presenting cells for realistic exposure and immune response. |
| CYP450 Inducers (Rifampicin, Omeprazole) | Upregulates specific Phase I metabolic enzymes in keratinocytes, enabling the activation of pro-haptens within the tissue. |
| CYP450 Activity Probe (Luciferin-IPA) | Luminescent substrate allows quantitative measurement of CYP3A4 activity in tissue lysates to verify metabolic competence. |
| Controlled Oxidation Chamber (UVA source) | Provides standardized abiotic oxidation to convert pre-haptens (e.g., limonene) into their reactive forms prior to testing. |
| Flow Cytometry Panel (anti-human CD86, CD54, HLA-DR) | Gold-standard for quantifying DC activation markers. Multi-parameter analysis increases specificity. |
| Cytokine ELISA Duplex (IL-8, IL-1β) | Measures key keratinocyte-derived inflammatory signals that drive DC activation, providing a mechanistic endpoint. |
| Hydrophobic Vehicle (Acetone:Olive Oil 4:1) | Ensines adequate solubility and bioavailability of lipophilic test substances for topical application. |
| Matrigel or Collagen Migration Inserts | Used in ancillary assays to quantify the chemotactic migration of activated DCs from the 3D model, a functional endpoint. |
Conclusion
3D skin model dendritic cell sensitization testing represents a robust, human-relevant, and regulatory-accepted NAM that effectively captures the key initiating events of skin sensitization. By leveraging the complex biology of reconstructed epidermis, this assay provides critical data on dendritic cell activation that aligns well with traditional animal test outcomes. Future directions will focus on further integration into defined approaches for hazard and potency assessment, the development of models incorporating additional immune cell types for a more comprehensive immunological readout, and the application of these models for evaluating novel therapeutic modalities, such as biologics and advanced nanomaterials. Its continued adoption is essential for advancing next-generation risk assessment and fulfilling the mandate for non-animal safety science.