Decoding Human CD8+ T Cell Heterogeneity: A Comprehensive Guide to Single-Cell RNA Sequencing Atlases and Their Applications in Biomedical Research
Single-cell RNA sequencing (scRNA-seq) has revolutionized our understanding of CD8+ T cell biology, revealing an unprecedented degree of heterogeneity in health, aging, and disease.
Decoding Human CD8+ T Cell Heterogeneity: A Comprehensive Guide to Single-Cell RNA Sequencing Atlases and Their Applications in Biomedical Research
Abstract
Single-cell RNA sequencing (scRNA-seq) has revolutionized our understanding of CD8+ T cell biology, revealing an unprecedented degree of heterogeneity in health, aging, and disease. This article provides a comprehensive resource for researchers and drug development professionals, covering the foundational discoveries of CD8+ T cell subsets, the latest computational methods for atlas construction and data projection, strategies for overcoming annotation challenges, and the validation of these findings across studies and species. By integrating insights from massive-scale integration studies, such as those leveraging deep-learning models like scAtlasVAE on over 1.1 million cells, and specialized projection tools like ProjecTILs, this guide serves as a roadmap for leveraging T cell atlases to advance biomarker discovery, prognostic modeling, and the development of novel immunotherapies.
Unveiling CD8+ T Cell Diversity: From Fundamental Subsets to Age-Related Remodeling
CD8+ T cells are fundamental components of adaptive immunity, coordinating the eradication of infected and malignant cells. Upon activation, a single naive CD8+ T cell can generate a diverse army of daughter cells, encompassing potent effectors and long-lived memory populations, but also dysfunctional exhausted cells in states of chronic antigen exposure. The precise characterization of these subsets—naive, effector, memory, and exhausted—is critical for advancing our understanding of protective immunity and developing novel immunotherapies for cancer and chronic infections. The advent of single-cell RNA sequencing (scRNA-seq) has revolutionized this field, enabling the construction of high-resolution transcriptional atlases that define core cellular states and their functional relationships across human tissues. This technical guide synthesizes traditional immunology with cutting-edge single-cell genomics to provide a definitive reference on CD8+ T cell subsets, framed within the context of a broader thesis on human T cell atlas research.
Defining the Core CD8+ T Cell Subsets
CD8+ T cell subsets are historically categorized by surface receptor expression and functional capacity, but recent scRNA-seq studies have refined these classifications through unsupervised clustering of transcriptional profiles. The following table summarizes the defining features of the core subsets.
Table 1: Core CD8+ T Cell Subsets and Their Defining Characteristics
| Subset | Key Surface Markers | Key Transcriptional Markers | Primary Functions | Tissue Localization |
|---|---|---|---|---|
| Naive (N) | CD45RA+, CCR7+, CD62L+, CD27+, CD28+ [1] [2] | TCF7, SELL, CCR7 [3] | Immune surveillance; precursor to all other subsets | Blood, Secondary Lymphoid Organs [1] |
| Effector Memory (TEM) | CD45RA-, CCR7- [2] | CCL5, GZMB, GZMK [3] | Rapid cytokine production and cytotoxicity upon re-encounter with antigen | Non-lymphoid tissues, Blood [3] |
| Terminally Differentiated Effector (TEMRA) | CD45RA+, CCR7-, CD27-, CD28-, CD57+, KLRG1+ [2] | PRF1, NKG7 [3] | Powerful, immediate cytotoxicity | Enriched in bone marrow and blood [3] |
| Tissue-Resident Memory (TRM) | CD69+, CD103+ (ITGAE+) | CXCR6, ITGA1, ITGAE [3] | Long-term peripheral surveillance in barrier tissues | Mucosal sites (e.g., lung), Barrier tissues [3] |
| Progenitor Exhausted (Tpex) | PD-1+, TCF-1+ (TCF7+) | TCF7 [4] | Self-renewal; response to checkpoint blockade | Tumor Microenvironment, Chronic Infection [5] |
| Terminally Exhausted (Tex-term) | PD-1hi, TIM-3+, TIGIT+, CD39+ [6] | TOX [6] | Severely impaired function; high inhibitory receptor burden | Tumor Microenvironment, Chronic Infection [5] [6] |
The Differentiation Pathway: From Naive to Terminally Differentiated Cells
The journey of a CD8+ T cell from a naive state to a fully differentiated effector is a tightly regulated process. The following diagram illustrates the core differentiation pathway and the associated shifts in key surface markers, as defined by polychromatic flow cytometry and transcriptional profiling.
A Single-Cell RNA Sequencing Atlas of CD8+ T Cells
Single-cell transcriptomics has provided an unprecedented, high-dimensional view of CD8+ T cell states in health and disease, moving beyond blood to encompass key tissues like lung, lymph nodes, and bone marrow.
Key Findings from a Human Tissue T Cell Atlas
A landmark study profiling over 50,000 human T cells from blood, lung, lymph nodes, and bone marrow established a core reference map. Key findings include [3]:
- Conserved Activation States: scRNA-seq of resting and activated T cells revealed lineage-specific activation states conserved across all tissue sites. For CD8+ T cells, this included distinct effector states characterized by expression of cytotoxicity genes (GZMB, GZMK), and a separate population of terminally differentiated effector cells (TEMRA) expressing PRF1 and NKG7 [3].
- Tissue-Specific Signatures: A core tissue signature was identified, distinguishing tissue-derived T cells from their blood counterparts. This signature included genes associated with the cytoskeleton and cell matrix, suggesting an adaptation to the tissue microenvironment independent of the canonical tissue-resident memory (TRM) phenotype [3].
- Projection of Disease States: Comparing this healthy reference to tumor-associated T cells revealed a predominance of activated CD8+ T cell states that co-expressed markers of exhaustion, activation, and proliferation, highlighting the dysregulated state of T cells in cancer [3].
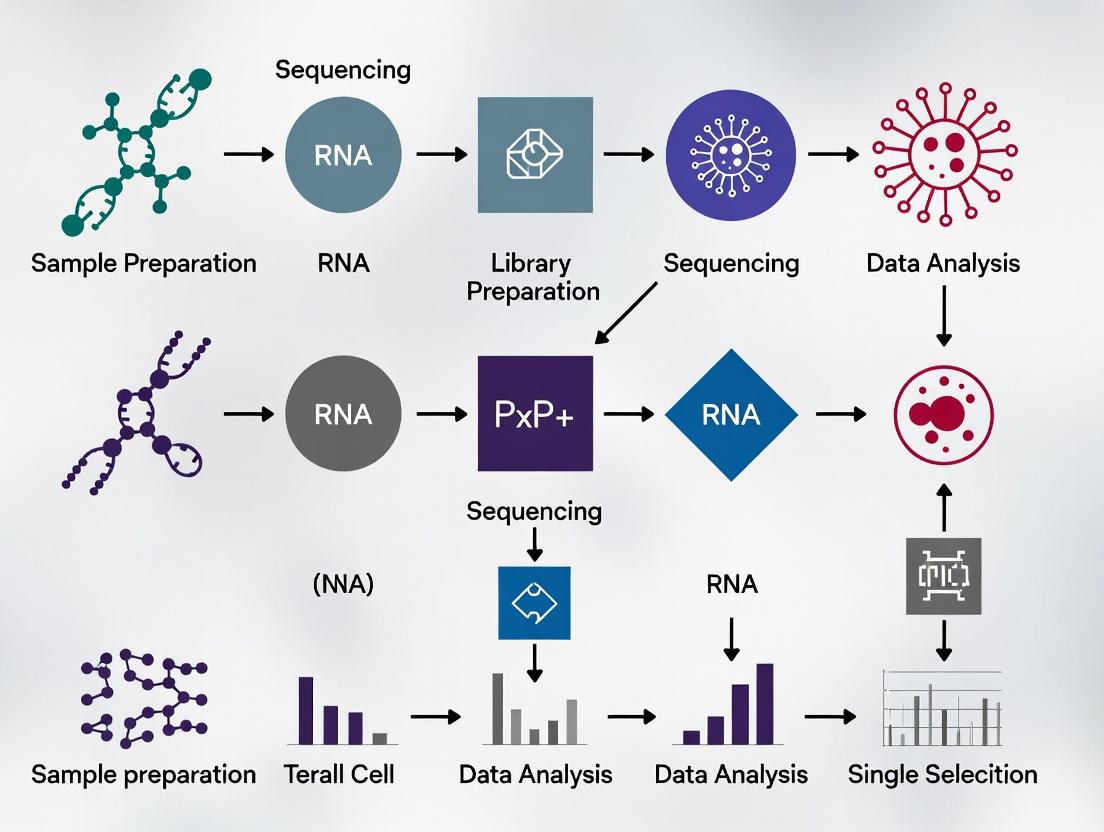
Experimental Workflow for scRNA-seq of Tissue T Cells
The following diagram outlines the comprehensive experimental workflow used to generate this human T cell atlas, from tissue processing to computational analysis.
The Exhausted CD8+ T Cell State in Chronic Disease
T cell exhaustion is a distinct differentiation state induced by persistent antigen exposure in chronic infections and cancer, characterized by hierarchical loss of effector functions and upregulation of inhibitory receptors [7].
Hallmarks and Heterogeneity of Exhausted T Cells
Exhausted CD8+ T cells are defined by several key features [7] [8]:
- Progressive Loss of Function: Cytokine production (e.g., IL-2, TNF, IFN-γ) and killing capacity are gradually lost.
- Upregulation of Inhibitory Receptors: Co-expression of multiple receptors including PD-1, LAG3, TIM-3, TIGIT, and CD39 [6].
- Dysregulated Metabolism and Epigenetics: Altered metabolic pathways and a distinct, stable epigenetic landscape that locks cells in the exhausted state.
- Subset Heterogeneity: The exhausted pool is not uniform. It contains progenitor exhausted (Tpex) cells that express TCF-1 and retain self-renewal capacity, and terminally exhausted (Tex-term) cells with profound dysfunction and a high burden of inhibitory receptors [5] [4].
Transcriptional and 3D Genomic Regulation of Exhaustion
Recent research has uncovered complex molecular mechanisms underpinning exhaustion. scRNA-seq of tumor-infiltrating T cells reveals a state co-expressing exhaustion, activation, and proliferation markers [3]. Furthermore, studies show that extensive changes in the three-dimensional (3D) genome architecture are critical for exhausted T cell differentiation. The transcription factor IRF8 was identified as a key driver of this process, promoting the formation of specific chromosomal loops that regulate the expression of exhaustion-associated genes. IRF8 deficiency inhibits the differentiation and antitumor function of exhausted CD8+ T cells [4].
Methodologies for Defining CD8+ T Cell Subsets
Polychromatic Flow Cytometry
Multiparameter flow cytometry remains a cornerstone for identifying and isolating T cell subsets based on surface and intracellular protein expression.
- Panel Design: Comprehensive panels include markers for differentiation (CD45RA, CCR7), costimulation/inhibition (CD27, CD28, CD57, KLRG1, PD-1, TIM-3), and tissue residency (CD69, CD103) [2].
- Experimental Workflow: PBMCs or tissue-derived lymphocytes are stained with a conjugated antibody panel, acquired on a flow cytometer capable of detecting 10+ colors, and analyzed using clustering algorithms (e.g., t-SNE, UMAP) to visualize populations [2].
In Vitro Modeling of T Cell Exhaustion
Reproducible in vitro models are essential for studying T cell exhaustion. One established method involves the chronic stimulation of naive T cells with cognate antigen [8].
- Protocol: Human or mouse T cells are repeatedly stimulated with anti-CD3/anti-CD28 beads or peptide-pulsed antigen-presenting cells over several weeks.
- Validation: The model is validated by confirming hallmarks of exhaustion: expression of PD-1, CD39, etc.; impaired proliferation and cytokine production; reduced cytotoxic granule release; and metabolic alterations. The model's relevance is benchmarked against in vivo exhausted T cells from chronic infection or tumor models [8].
The Scientist's Toolkit: Key Reagents and Experimental Solutions
Table 2: Essential Research Reagents for CD8+ T Cell Subset Analysis
| Reagent / Tool | Category | Primary Function in Research | Example Application |
|---|---|---|---|
| Anti-CD3/CD28 Antibodies | Activation | Polyclonal T cell stimulation via TCR and costimulatory pathways | In vitro T cell activation and expansion; modeling exhaustion [8] |
| 10x Genomics Chromium | scRNA-seq | Single-cell barcoding and library preparation for transcriptome analysis | Defining core transcriptional states in human tissue T cells [3] |
| Fluorochrome-conjugated Antibodies | Flow Cytometry | Multiplexed detection of cell surface and intracellular proteins | Polychromatic phenotyping of N, EM, TEMRA, and exhausted subsets [2] |
| PD-1/PD-L1 Blockade | Immunotherapy | Checkpoint inhibition to reinvigorate exhausted T cells | Functional assay to test Tpex cell potential and therapeutic response [7] |
| Humanized Mouse Models | In vivo Modeling | Study human T cell responses in an in vivo context | Evaluating tumor infiltration and function of human CD137+ CD8+ T cells [6] |
CD8+ T Cell Trafficking and Tissue Localization
The localization of CD8+ T cells to specific tissues is a dynamic process regulated by receptor-ligand interactions, which change as cells transition from naive to effector and memory states [1]. This trafficking is critical for effective immune surveillance and pathogen control.
Table 3: Key Receptor-Ligand Pairs in CD8+ T Cell Trafficking
| Receptor Type | Receptor | Ligand(s) | Role in CD8+ T Cell Trafficking |
|---|---|---|---|
| Selectin | L-selectin (CD62L) | PNAd (MECA-79+) | Homing of naive cells to lymph nodes via HEVs [1] |
| P-selectin (CD62P) | PSGL-1 | Rolling/tethering to inflamed endothelium [1] | |
| Chemokine Receptor | CCR7 | CCL19, CCL21 | Guides naive and TCM cells to lymphoid organs [1] |
| CXCR3 | CXCL9, CXCL10 | Recruits effector and memory cells to sites of inflammation [1] | |
| Integrin | LFA-1 (αLβ2) | ICAM-1 | Mediates firm adhesion to endothelium prior to extravasation [1] |
| α4β7 | MAdCAM-1 | Gut-homing receptor [1] | |
| VLA-4 (α4β1) | VCAM-1 | Adhesion to inflamed endothelium [1] |
Implications for Therapeutics and Drug Development
A precise understanding of CD8+ T cell subsets directly informs immunotherapeutic development.
- Checkpoint Immunotherapy: The responsiveness of progenitor exhausted (Tpex) cells to PD-1 blockade makes them a key predictive biomarker and target for cancer immunotherapy [5] [4].
- Adoptive Cell Transfer (ACT): Identifying tumor-reactive T cell populations, such as the CD137+ CD8+ T cells with an activated and exhausted-like phenotype, allows for the selection of superior products for ACT [6].
- Vaccine Development: Strategies that promote the generation of long-lived memory subsets, particularly tissue-resident memory (TRM) cells, are being pursued to create durable protective immunity [1] [3].
The definition of core CD8+ T cell subsets has evolved from a simple linear model to a complex framework of interconnected states, intricately shaped by antigen exposure, tissue microenvironment, and transcriptional and epigenetic networks. The integration of high-dimensional technologies like scRNA-seq has been instrumental in creating a refined reference map of these populations in health, providing a crucial baseline from which to dissect dysfunction in disease. This detailed understanding of subset-specific markers, functions, and regulatory mechanisms is paramount for designing next-generation vaccines and immunotherapies aimed at harnessing the potent power of CD8+ T cells against cancer, chronic infection, and autoimmune pathology.
Immunosenescence, the progressive remodeling of the immune system with age, represents a critical determinant of healthspan and disease susceptibility in the aging global population [9]. The advent of single-cell RNA sequencing (scRNA-seq) has revolutionized the resolution at which we can interrogate these age-related changes, moving beyond bulk tissue analysis to reveal cellular and molecular diversity within the immune compartment [9]. This technical guide synthesizes recent landmark studies utilizing single-cell technologies to dissect specific alterations within the human CD8+ T cell landscape, focusing on two pivotal, interconnected phenomena: the counterintuitive loss of a unique NKG2C+GZMB- CD8+ memory T cell subset and the systematic accumulation of type 2-polarized memory T cells. These findings are framed within a broader thesis that single-cell T cell atlas research is essential for decoding the molecular logic of immune aging, with significant implications for vaccine development, cancer immunotherapy, and the treatment of age-related inflammatory diseases.
Quantitative Atlas of Age-Associated T Cell Remodeling
Large-scale single-cell profiling of healthy human blood across adult lifespans has provided an unprecedented quantitative resource for understanding immune aging. A study profiling ~2 million cells from 166 individuals aged 25-85 years identified 55 immune subpopulations and found that 12 of these changed significantly with age [10] [11]. These changes represent a fundamental reprogramming of the peripheral T cell compartment.
Table 1: Key Age-Associated Changes in Human T Cell Compartment
| Immune Cell Subset | Change with Age | Functional Significance | Reference |
|---|---|---|---|
| NKG2C+GZMB- CD8+ Memory T Cells | Decrease | Counterintuitive loss of a distinct memory subset; potential role in viral surveillance | [10] |
| GZMK+ CD8+ T Cells | Accumulation | Pro-inflammatory, exhausted-like phenotype (PD-1+, LAG3+); accounts for ~40% of CD8+ TEM/TCM in older adults | [12] |
| Type 2 Memory CD4+ T Cells (Th2) | Accumulation | Systematic shift towards type 2 immunity; linked to dysregulated B cell responses | [13] [10] |
| CCR4+ CD8+ Tcm | Accumulation | CD8+ T cell subset exhibiting a type 2 cytokine profile (e.g., IL-4) | [10] |
| Cytotoxic CD4+ T Cells | Accumulation | Express cytotoxic molecules (Granzyme B, Perforin); increased in supercentenarians | [12] |
| HLA-DR+ CD4+ T Cells | Accumulation | Activated memory phenotype | [10] |
| Naive CD8+ T Cells | Decrease | Reduced thymic output and frequency | [13] [12] |
| Naive CD4+ T Cells | Stable Frequency | Despite non-linear transcriptional reprogramming | [13] |
This remodeling is not merely compositional. A 2025 longitudinal study profiling over 300 healthy adults with single-cell RNA sequencing, proteomics, and flow cytometry revealed that T cells exhibit the most profound transcriptional alterations prior to advanced ageing, with naive T cells showing the highest number of age-related differentially expressed genes (DEGs), followed by central memory (TCM) and effector memory (TEM) cells [13]. This reprogramming leads to a functional T helper 2 (TH2) cell bias in memory T cells that is linked to dysregulated B cell responses against antigens in influenza vaccines [13].
Experimental Protocols for scRNA-seq Based Immune Aging Research
The insights into NKG2C+ CD8+ T cell loss and type 2 memory accumulation were enabled by sophisticated single-cell methodologies. The following protocols detail the key experimental workflows used in the cited studies.
Protocol 1: Comprehensive Single-Cell Profiling of Human PBMCs
This protocol outlines the multi-omic approach used to generate the single-cell atlas of healthy human blood [10] [11].
- Sample Collection and Processing: Collect peripheral blood from donors across the target age range (e.g., 25-85 years). Isolate Peripheral Blood Mononuclear Cells (PBMCs) via density gradient centrifugation using Ficoll-Paque PLUS.
- Single-Cell Library Preparation: Process single-cell suspensions using the 10x Genomics Chromium platform, typically with a 5' v2 kit that enables simultaneous capture of RNA, T Cell Receptor (TCR), and B Cell Receptor (BCR) sequences. Include feature barcoding for surface protein detection (CITE-seq).
- Sequencing: Sequence the generated libraries on an Illumina platform (e.g., NovaSeq 6000) to a sufficient depth for transcriptome, TCR, and BCR recovery.
- Data Preprocessing and Quality Control: Process raw sequencing data through Cell Ranger or similar pipelines. Perform rigorous quality control: filter out low-quality cells (e.g., those with <200 genes or >5% mitochondrial gene content) and remove doublets using tools like DoubletFinder.
- Bioinformatic Analysis:
- Cell Type Annotation: Normalize and scale data using Seurat. Cluster cells with Uniform Manifold Approximation and Projection (UMAP). Annotate cell clusters using reference-based tools (e.g., Azimuth) and canonical marker genes.
- Differential Expression & Abundance: Identify differentially expressed genes (DEGs) between age groups within specific cell subsets using Wilcoxon rank-sum tests. Analyze changes in cell population frequency with age.
- TCR Analysis: Reconstruct TCR clonotypes from sequencing data to track clonal expansion and repertoire diversity.
Protocol 2: Functional Validation of Age-Associated T Cell Subsets
This protocol, derived from a study on Ankylosing Spondylitis, describes how to validate the function of identified subsets like NKG2C+ CD8+ T cells [14].
Immune Phenotyping by High-Dimensional Flow Cytometry:
- Stain fresh peripheral blood or PBMCs with a pre-titrated panel of ~51 surface antibodies.
- Include antibodies against key markers: CD3, CD8, CD45, NKG2C, CCR4, CD45RA, CD197 (CCR7), and CD107a. Incubate for 15 minutes at room temperature, lyse red blood cells, wash, and acquire data on a high-parameter cytometer (e.g., CytoFLEX LX).
- Analyze data to confirm the frequency and phenotype of age-altered subsets.
Degranulation/Cytotoxicity Assay:
- Isolate PBMCs and cryopreserve. For the assay, thaw and rest cells.
- Stimulate cells with an activation cocktail (e.g., PMA/ionomycin) or specific antigen in the presence of APC-conjugated anti-CD107a antibody and a protein transport inhibitor for 6 hours.
- After stimulation, perform surface staining, followed by fixation/permeabilization and intracellular cytokine staining (e.g., for IFN-γ, IL-4).
- Acquire data on a flow cytometer and analyze CD107a exposure and cytokine production in specific T cell subsets.
Phosphoflow to Probe Signaling Pathways:
- Coculture NKG2C+ CD8+ T cells with target cells (e.g., K562 cells transduced with HLA-B27 or control) for 6 hours.
- At the end of the culture, fix cells immediately with paraformaldehyde-containing buffer.
- Permeabilize cells using ice-cold methanol and stain with a phospho-specific antibody (e.g., Alexa Fluor 647-conjugated anti-phospho-Akt) alongside surface markers.
- Analyze phospho-protein signaling by flow cytometry to validate pathway activation (e.g., PI3K-Akt).
Signaling Pathways and Molecular Mechanisms
The age-related shift in T cell function is underpinned by distinct molecular pathways. The cytotoxicity of aging-associated NKG2C+ CD8+ T cells is regulated by specific receptor signaling and metabolic reprogramming.
The NKG2C+ CD8+ T cell subset, which paradoxically decreases with age, recognizes the non-classical MHC molecule HLA-E [14]. In specific pathological contexts like Ankylosing Spondylitis, HLA-B27 stimulation has been shown to significantly enhance the cytotoxicity of this subset via activation of the PI3K-Akt signaling pathway, an effect reversible by NKG2C blockade [14]. This pathway activation leads to increased degranulation and cytotoxic potential.
Concurrently, transcriptomic analyses reveal systematic metabolic reprogramming in aged T cells. Studies note enriched pathways related to the TCA cycle in old naïve CD4+ and CD8+ T cells, which could associate with increased reactive oxygen species (ROS) production from dysfunctional mitochondria [12]. This metabolic shift is thought to support the pro-inflammatory, exhausted-like phenotype of accumulating GZMK+ CD8+ T cells and the concerted age-associated increase in type 2 memory T cells across both CD4+ and CD8+ lineages (e.g., Th2 CD4+ Tmem and CCR4+ CD8+ Tcm) [10] [12].
Successfully profiling age-associated immune remodeling requires a carefully selected set of reagents and tools. The following table compiles essential solutions derived from the methodologies cited in this guide.
Table 2: Essential Research Reagents for Immune Aging Studies
| Reagent / Resource | Function / Application | Example Use Case |
|---|---|---|
| 10x Genomics Chromium | Single-cell partitioning for RNA/TCR/BCR-seq | Simultaneous transcriptome and receptor sequencing of PBMCs [11] |
| Feature Barcoding Antibodies | Surface protein detection via CITE-seq | High-resolution immunophenotyping alongside transcriptomic data [10] |
| Anti-NKG2C Antibody | Phenotyping and functional blockade | Identifying the declining CD8+ subset; validating functional dependence [14] |
| Anti-CCR4 Antibody | Identification of type 2 T cells | Flow cytometric quantification of accumulating Th2-like cells [10] |
| Anti-CD107a (APC) | Degranulation and cytotoxicity assay | Measuring cytotoxic potential of T cell subsets upon activation [14] |
| Anti-pAkt (Alexa Fluor 647) | Phosphoflow signaling analysis | Quantifying PI3K-Akt pathway activation in specific T cells [14] |
| Seurat / Azimuth | Bioinformatic analysis and cell annotation | scRNA-seq data normalization, clustering, and reference-based labeling [11] [9] |
| Human Immune Health Atlas | Reference dataset for cell subset labeling | Defining 71 immune cell subsets in PBMC scRNA-seq data [13] |
Single-cell atlas research has unequivocally established that the age-associated loss of NKG2C+GZMB- CD8+ T cells and the accumulation of type 2 memory T cells are defining features of immune aging. These changes, reflecting a broader non-linear transcriptional reprogramming of the T cell compartment, contribute to a functional immune bias with direct consequences for vaccine responses and disease susceptibility [13] [10]. The emerging toolkit—combining high-parameter single-cell omics, functional assays, and bioinformatic clocks like sc-ImmuAging [15]—provides an unprecedented opportunity to decode the heterogeneity of immune aging. Future research must focus on integrating these multimodal data to move from correlation to causation, ultimately enabling the development of targeted interventions to modulate these specific T cell pathways and promote healthier immune function in the aging population.
The precise characterization of CD8+ T cell states in healthy human tissues represents a foundational challenge in immunology and is critical for accurately identifying pathogenic deviations in disease. Single-cell RNA sequencing (scRNA-seq) has revealed an unprecedented degree of T cell heterogeneity, yet consistent definition of cell states across studies remains a major challenge due to the lack of standardized reference baselines [16]. CD8+ T cells, as crucial mediators of adaptive immunity, demonstrate remarkable functional plasticity, with their states shaped by anatomical location, antigen exposure, and metabolic programming. Establishing a reference framework of CD8+ T cell states in health is particularly urgent given the correlation between specific intratumoral T cell states and response to immunotherapies [17]. Such baselines enable researchers to distinguish between physiological T cell diversity and disease-associated alterations, thereby facilitating the identification of novel therapeutic targets and biomarkers for immune-mediated diseases.
Recent technological advances now permit large-scale profiling of human T cells across multiple tissues, moving beyond the traditional reliance on peripheral blood samples to encompass lymphoid and mucosal sites where the majority of T cells reside [18]. This review synthesizes findings from these pioneering efforts to establish a comprehensive baseline of healthy human CD8+ T cell states, detailing the transcriptional signatures, functional properties, and tissue-specific distributions that define this critical immune population. Furthermore, we provide technical guidance for implementing these reference frameworks in research settings, ensuring consistent annotation and interpretation of CD8+ T cell states across studies.
Establishing Transcriptional Baselines: Core CD8+ T Cell States in Healthy Tissues
Reference CD8+ T Cell States from Multi-Tissue Atlas
Comprehensive scRNA-seq analysis of over 50,000 resting and activated T cells from lung, lymph nodes, bone marrow, and blood of healthy organ donors has established a high-dimensional reference map of human T cell activation in health [18]. This foundational work identified four principal CD8+ T cell states conserved across tissue sites:
- TEM/TRM-like cells expressing CCL5, cytotoxicity-associated genes (GZMB, GZMK), and tissue residency markers (CXCR6, ITGA1)
- Activated TRM/TEM cells characterized by expression of IFNG, CCL4, and CCL3
- Terminally differentiated effector cells (TEMRA) marked by high expression of cytotoxic mediators PRF1 and NKG7
- Naïve-like cells expressing CCR7, SELL, TCF7, and IL7R [18]
The distribution of these states varies significantly by tissue compartment. Tissue-resident memory (TRM) cells are predominantly localized in mucosal sites such as the lung, while TEMRA cells are enriched in bone marrow. Naïve and central memory populations are more abundant in lymphoid tissues and blood [18].
Age-Associated Alterations in Circulating CD8+ T Cell Populations
Large-scale profiling of approximately 2 million peripheral blood mononuclear cells (PBMCs) from 166 healthy individuals aged 25-85 years has revealed specific age-related shifts in CD8+ T cell populations [19]. This analysis identified 55 subpopulations of blood immune cells, with twelve subpopulations demonstrating significant changes with age:
- GZMK+ CD8+ T cells accumulate with age
- A unique NKG2C+ GZMB− XCL1+ memory CD8+ T cell subset decreases with age
- CCR4+ CD8+ Tcm (T central memory) cells show concerted age-associated increase alongside Th2 CD4+ T memory cells, suggesting a systematic functional shift toward type 2 immunity with aging [19]
Table 1: Core CD8+ T Cell States in Healthy Human Tissues
| Cell State | Key Marker Genes | Primary Tissue Localization | Functional Characteristics |
|---|---|---|---|
| Naïve-like | CCR7, SELL, TCF7, IL7R | Blood, Lymph Nodes, Bone Marrow | Self-renewal capacity, differentiation potential |
| TEM/TRM-like | GZMB, GZMK, CXCR6, ITGA1, CCL5 | Lung, Mucosal Sites | Cytotoxic potential, tissue retention |
| Activated TRM/TEM | IFNG, CCL4, CCL3 | All Tissues | Pro-inflammatory cytokine production |
| TEMRA | PRF1, NKG7, FCGR3A | Bone Marrow, Blood | Strong cytotoxic activity, terminal differentiation |
| NKG2C+ GZMB− Memory | NKG2C, XCL1 | Blood | Unique memory subset, decreased with aging |
| GZMK+ CD8+ T cells | GZMK | Blood | Accumulates with age |
| CCR4+ CD8+ Tcm | CCR4 | Blood | Type 2/IL-4 expression, increases with age |
Methodological Framework for CD8+ T Cell State Identification
The experimental workflow for establishing these CD8+ T cell baselines typically involves several standardized steps [18]:
Sample Acquisition: Tissues are obtained from deceased organ donors meeting health criteria for transplantation, while blood is collected from healthy adult volunteers.
Cell Processing and Stimulation: CD3+ T cells are isolated from tissues and blood, then cultured either in media alone ("resting") or with anti-CD3/anti-CD28 antibody stimulation ("activated") to capture diverse activation states.
Single-Cell RNA Sequencing: Single cells are encapsulated using the 10x Genomics Chromium system, followed by library construction and sequencing.
Computational Analysis: Unsupervised community detection algorithms cluster cells based on highly variable genes, with subsequent projection into two-dimensional space using Uniform Manifold Approximation and Projection (UMAP). Differential gene expression analysis then resolves T cell subsets and functional states.
This standardized approach enables consistent identification of CD8+ T cell states across donors and tissue sites, forming a reproducible framework for baseline establishment.
Analytical Frameworks for CD8+ T Cell State Annotation
Automated Annotation Tools and Reference-Based Projection
The field of scRNA-seq data analysis faces significant challenges in achieving consistent cell phenotype annotation, particularly for heterogeneous populations like T cells with their diverse functional states and highly variable T-cell receptors (TCRs) [20]. Several computational approaches have been developed to address this challenge:
Supervised machine learning classification methods include:
- SingleR enables prediction of cell-type labels for novel datasets based on models trained on prior annotated datasets [20]
- Garnett and CellTypist provide additional frameworks for supervised classification of cell states [20]
Semi-supervised approaches include:
- SCINA annotates cells based on a consensus list of known markers [20]
- scGate employs a hierarchical gating strategy similar to flow cytometry, classifying markers in a structure of pure and impure cells [20]
Reference atlas projection methods represent a particularly powerful approach for placing new data into established frameworks:
- ProjecTILs specializes in projecting new scRNA-seq data into reference T cell atlases without altering the reference space, while also characterizing previously unknown cell states that "deviate" from reference subtypes [16] [20]
- The algorithm applies the PCA rotation matrix of the reference map to the query set, then uses the same UMAP transformation to project query cells into the original UMAP embedding of the reference [16]
- Following projection, a nearest-neighbor classifier predicts the subtype of each query cell by majority vote of its annotated nearest neighbors in the reference map [16]
Integrated Annotation Strategy
For optimal results, a two-step annotation process is strongly recommended [20]:
- Primary annotations of gene expression clusters by automated algorithms
- Expert-based manual interrogation of cell populations to verify automated annotations
This combined approach leverages the scalability of computational methods while maintaining the biological validity ensured by expert knowledge, resulting in the most accurate definitions of CD8+ T cell subsets.
Table 2: Computational Tools for CD8+ T Cell State Annotation
| Tool | Approach | Key Features | Advantages | Limitations |
|---|---|---|---|---|
| ProjecTILs | Reference projection | Projects new data into reference atlases without altering reference structure; identifies novel states | Preserves reference space integrity; enables cross-study comparison | Requires well-annotated reference atlas |
| SingleR | Supervised classification | Predicts cell-type labels based on pre-trained models | Robust to missing marker genes | Requires gene expression overlap with reference |
| scGate | Semi-supervised | Hierarchical gating strategy similar to flow cytometry | User-defined marker lists; interpretable method | Dependent on marker gene quality |
| SCINA | Semi-supervised | Annotation based on consensus marker lists | Utilizes known biological signatures | Limited to predefined cell populations |
| Seurat Clustering | Unsupervised | k-nearest neighbors clustering | Identifies novel populations without prior knowledge | Requires expert annotation after clustering |
Table 3: Essential Research Reagents for CD8+ T Cell scRNA-seq Studies
| Reagent/Resource | Function | Example Application | Considerations |
|---|---|---|---|
| 10x Genomics Chromium System | Single-cell encapsulation and barcoding | High-throughput scRNA-seq library preparation | Enables capture of thousands of cells simultaneously |
| Anti-CD3/CD28 Activation Beads | T cell stimulation | Mimics antigen presentation and co-stimulation | Standardized activation for functional state assessment |
| Cell Hashing Antibodies | Sample multiplexing | Allows pooling of multiple samples in one run | Reduces batch effects and costs |
| Feature Barcoding Kits | Surface protein detection | Combined transcriptome and proteome analysis | Correlates protein expression with transcriptional states |
| TCR Amplification Kits | T cell receptor sequencing | Paired TCR sequence with gene expression | Links clonality to functional state |
| Viability Stains (e.g., LIVE/DEAD) | Dead cell exclusion | Improves data quality by removing dead cells | Critical for tissue samples with higher cell death |
| CellSorting Reagents (e.g., FACS Antibodies) | Target population isolation | Enrichment of CD8+ T cells prior to sequencing | Reduces sequencing costs and complexity |
| Reference Atlas Datasets (e.g., HCA) | Analytical framework | Projection and annotation of new datasets | Provides healthy baseline for comparison |
Metabolic and Functional Programming of CD8+ T Cell States
Metabolic Regulation of CD8+ T Cell Differentiation
CD8+ T cell states are intrinsically linked to their metabolic programming, with distinct metabolic pathways supporting different functional states [21] [22]. Naïve T cells primarily utilize oxidative phosphorylation to meet their energy demands, while upon activation, CD8+ T cells undergo metabolic rewiring to support their effector functions, dramatically increasing glycolytic flux and engaging biosynthetic pathways for clonal expansion [21].
Key metabolic features of CD8+ T cell states include:
- Asparagine metabolism plays a critical role in CD8+ T cell differentiation, with ASNS expression dynamics influencing T cell fate decisions [21]
- Glycolytic capacity is rapidly engaged upon T cell receptor activation, supporting effector differentiation [21]
- Neonatal CD8+ T cells exhibit unique metabolic programming, with heightened glycolytic engagement and accelerated effector differentiation compared to adult cells [23]
Functional Signatures of CD8+ T Cell Activation
Single-cell transcriptomics of activated T cells from multiple healthy tissues reveals conserved lineage-specific activation states [18]. For CD8+ T cells, this includes:
- Distinct effector states characterized by production of cytotoxic molecules (granzymes, perforin) and pro-inflammatory cytokines (IFN-γ, TNF)
- Tissue-specific functional adaptations with CD8+ T cells in mucosal sites exhibiting tissue-residency programs
- Heterogeneous activation responses even within defined CD8+ T cell subsets, reflecting the functional plasticity of this population
The establishment of comprehensive baselines for CD8+ T cell states in healthy individuals through large-scale single-cell profiling represents a transformative advancement in immunology. These reference maps enable researchers to distinguish physiological T cell diversity from disease-associated alterations, providing essential context for interpreting T cell states in cancer, autoimmunity, and infectious diseases. The integration of transcriptional data with metabolic, functional, and clonal information offers a multidimensional perspective on CD8+ T cell heterogeneity that more accurately reflects the complexity of this critical immune population.
Future efforts in this field will need to address several important challenges, including the standardization of annotation frameworks across laboratories, the integration of multi-omics data at single-cell resolution, and the expansion of tissue sampling to encompass a wider range of anatomical sites. Additionally, longitudinal studies tracking CD8+ T cell states over time and in response to immune challenges will provide dynamic insights beyond the static snapshots currently available. As these reference atlases continue to expand and refine, they will undoubtedly accelerate the development of targeted immunotherapies and precision medicine approaches that modulate specific CD8+ T cell states for therapeutic benefit.
CD8+ T cells are fundamental mediators of adaptive immunity, capable of directly eliminating pathogen-infected and cancerous cells. In the context of persistent antigen exposure, as occurs in chronic infections and cancer, these cells progressively differentiate into a hypofunctional state known as T cell exhaustion [24]. This dysfunctional state represents a significant barrier to effective immunity and poses a substantial challenge for immunotherapies. The advent of single-cell RNA sequencing (scRNA-seq) has revolutionized our understanding of this process, revealing that exhaustion is not a uniform terminal state but rather a spectrum of differentiation with distinct cellular subsets possessing unique transcriptional, epigenetic, and functional properties [25] [26]. This whitepaper synthesizes current research to characterize the heterogeneous subsets within the exhaustion spectrum, their regulatory mechanisms, and implications for therapeutic intervention.
Exhausted T (Tex) cells are characterized by progressive loss of effector functions, including reduced production of cytokines such as IL-2, TNF, and IFNγ, diminished cytotoxic capacity, and increased expression of multiple inhibitory receptors (IRs) including PD-1, TIM-3, TIGIT, LAG-3, and CTLA-4 [27] [24]. Unlike functional memory or effector T cells, Tex cells exhibit a distinct transcriptional landscape governed by factors such as TOX and NFAT, which reinforce the exhausted phenotype while suppressing more functional T cell states [27] [26]. The tumor microenvironment (TME) further enforces this dysfunction through metabolic stress, including hypoxia and accumulation of immunosuppressive metabolites like lactic acid [26].
Characterizing the Exhaustion Spectrum
Major Subsets Along the Exhaustion Trajectory
Single-cell transcriptomic analyses across numerous human cancers and chronic infection models have consistently identified a hierarchical differentiation system within the exhaustion spectrum, primarily composed of two major subsets: progenitor exhausted (Tpex) and terminally exhausted (Tex) T cells [25] [26].
Table 1: Characteristics of Major Exhausted T Cell Subsets
| Feature | Progenitor Exhausted (Tpex) | Terminally Exhausted (Tex) |
|---|---|---|
| Key Markers | PD-1int, TCF-1+, SLAMF6hi, TOXint | PD-1hi, TIM-3+, SLAMF6lo, TOXhi |
| Self-Renewal | High | Limited |
| Effector Function | Retained cytokine production | Severely impaired polyfunctionality |
| Metabolic Features | [Information missing] | MCT11hi, enhanced lactate uptake |
| Therapeutic Response | Responsive to PD-1 blockade | Poor response to checkpoint inhibition |
| Developmental Fate | Self-renew and differentiate into Tex | Developmental dead-end |
The exhaustion trajectory begins with an early bifurcation event where activated CD8+ T cells diverge toward either functional memory or exhaustion lineages, a decision point marked by TCF-1 expression and occurring within the first few days of chronic antigen exposure [25]. From this branch point, Tpex cells demonstrate sustained expression of TCF-1 (encoded by TCF7), which maintains their proliferative potential and capacity for self-renewal, while Tex cells downregulate TCF-1 and upregulate a suite of inhibitory receptors along with the transcription factor TOX, which stabilizes the exhausted phenotype [26].
Heterogeneity Within Exhausted T Cell Populations
Beyond the fundamental Tpex/Tex dichotomy, finer-resolution scRNA-seq analyses have revealed additional specialized subsets within the exhaustion spectrum, particularly in human cancers:
Tissue-Resident Memory-like (TRM) Exhausted T Cells: In acute myeloid leukemia (AML), a subset of exhausted T cells with TRM-like features (CD69+ CD103+) was identified through scRNA-seq. Developmental trajectory analysis suggested that exhausted CD8+ T cells might develop via TRM cells in the AML tumor microenvironment, with these cells exhibiting significantly higher expression of exhaustion molecules [27].
EOMEShi T-bethi Terminal Exhaustion Subsets: Multi-omic integration of ATAC-seq and RNA-seq data has identified further stratification within the Tex compartment, including discrete populations with varying expression ratios of T-bet and EOMES, which correlate with differential cytotoxic potential and proliferative capacity [25].
Metabolically Specialized Tex Subsets: Recent work has identified a specialized Tex subset that highly expresses the lactate transporter MCT11 (SLC16A11), enabling increased uptake and metabolism of lactic acid in the TME. This metabolic adaptation further reinforces the dysfunctional state, as genetic or antibody-mediated disruption of MCT11 improves Tex cell effector function and reduces tumor growth [26].
Table 2: Exhaustion Markers Across Disease Contexts
| Marker Category | Specific Markers | Associated Dysfunctional State |
|---|---|---|
| Inhibitory Receptors | PD-1, CTLA-4, TIM-3, TIGIT, LAG-3, BTLA | Exhausted T cells [27] [24] [28] |
| Transcription Factors | TOX, NFAT, BATF, Blimp-1, T-betlo, EOMEShi | Terminal exhaustion [27] [24] [26] |
| Metabolic Transporters | MCT11 (SLC16A11) | Lactate-uptake specialized Tex [26] |
| Functional Markers | CD39, CD69, CD103 | Tissue-resident exhaustion [27] [28] |
| NK Cell Exhaustion | KLRC1, TIGIT, PD-1, TIM-3, reduced GZMB | NK cell dysfunction [27] [29] |
Molecular Drivers of Exhaustion Heterogeneity
Transcriptional and Epigenetic Regulation
The exhaustion spectrum is underpinned by distinct transcriptional and epigenetic programs that diverge early from other T cell fate trajectories. Unified analysis of over 300 ATAC-seq and RNA-seq datasets revealed that functional and dysfunctional T cells diverge at an early branch point marked by TCF-1 expression, with Tex cells subsequently following a differentiation path governed by progressive epigenetic changes that limit developmental plasticity [25].
The transcription factor TOX is a central regulator of exhaustion, induced by persistent TCR stimulation and necessary for the development of Tex cells. TOX expression promotes the exhausted phenotype by enacting transcriptional changes that reinforce dysfunction while suppressing memory and effector programs. Complementary to TOX, the NFAT signaling axis drives exhaustion-associated gene expression programs, often in cooperation with other factors such as BATF [24] [26].
Epigenetic analysis demonstrates that Tex cells acquire a distinct chromatin accessibility landscape characterized by stable changes at exhaustion-specific loci. These epigenetic modifications lock in the exhausted phenotype even in the absence of continuous antigen exposure, explaining the persistence of dysfunction in adoptive cell transfers and the limited durability of responses to checkpoint inhibition in many patients [25].
Metabolic Regulation in the Tumor Microenvironment
The TME imposes significant metabolic constraints that shape and reinforce the exhaustion spectrum. Terminally exhausted T cells exist in a state of metabolic dysfunction characterized by disrupted mitochondrial biogenesis and oxidative phosphorylation [26]. Recent research has identified MCT11 (SLC16A11) as a key metabolic transporter specifically upregulated in Tex cells, enabling increased uptake of lactic acid from the TME [26].
Figure 1: Metabolic Regulation of T Cell Exhaustion via MCT11
This metabolic specialization creates a feed-forward loop wherein Tex cells become increasingly dependent on lactic acid metabolism, further entrenching their dysfunctional state. Genetic deletion of MCT11 in T cells reduces lactic acid uptake and improves effector function, demonstrating the functional significance of this metabolic adaptation [26]. Hypoxia in the TME, mediated through Hif1α, further drives sustained MCT11 expression, creating a synergistic relationship between metabolic and transcriptional drivers of exhaustion [26].
Research Methods and Experimental Protocols
Single-Cell RNA Sequencing for Characterizing Exhaustion
scRNA-seq has emerged as the cornerstone technology for delineating the exhaustion spectrum, enabling unprecedented resolution of heterogeneous subsets and their transcriptional programs.
Table 3: Key Experimental Protocols for Exhaustion Research
| Method | Key Applications | Critical Steps |
|---|---|---|
| Single-Cell RNA Sequencing | Identification of exhausted subsets, trajectory inference, transcriptional profiling | 1. Single-cell suspension preparation2. Viability assessment (>80% recommended)3. Cell partitioning and barcoding (10x Genomics)4. Library preparation and sequencing5. Bioinformatics analysis (Seurat, Monocle) |
| T Cell Receptor Sequencing | Clonotype tracking, lineage relationships | Paired TCR capture with gene expression |
| ATAC-seq | Epigenetic landscape analysis, chromatin accessibility | Transposase treatment of intact nuclei, sequencing |
| Flow Cytometry Validation | Protein-level marker validation, functional assessment | Multi-parameter staining (PD-1, TIM-3, TIGIT, TCF-1, TOX) |
| Metabolic Assays | Characterization of metabolic dependencies | [14C]-lactate uptake, OCR, ECAR measurements |
A typical scRNA-seq workflow begins with the preparation of a high-quality single-cell suspension from tumor tissue, peripheral blood, or model system. Critical quality control steps include viability assessment (typically >80% recommended), removal of doublets using tools like DoubletFinder, and filtration of low-quality cells (e.g., those with <200 UMIs or >20% mitochondrial gene expression) [27]. Following library preparation and sequencing, bioinformatic analysis using tools such as Seurat and Monocle enables identification of distinct cellular subsets, trajectory inference, and differential gene expression analysis [27].
For exhaustion studies specifically, developmental trajectory analysis using tools like Monocle can reconstruct the differentiation path from progenitor to terminally exhausted states, identifying significantly changed genes (q-value < 0.01) along this continuum [27]. Integration with paired TCR sequencing further enables tracking of clonal expansion and lineage relationships across the exhaustion spectrum [28].
Research Reagent Solutions
Table 4: Essential Research Reagents for T Cell Exhaustion Studies
| Reagent/Category | Specific Examples | Research Application |
|---|---|---|
| Cell Isolation | CD8+ T Cell Isolation Kits | Purification of T cell populations for sequencing and functional assays |
| scRNA-seq Platforms | 10x Genomics Chromium, Seq-Well | Single-cell transcriptome profiling of heterogeneous populations |
| Inhibitory Receptor Antibodies | α-PD-1, α-TIGIT, α-TIM-3, α-CTLA-4 | Immune checkpoint blockade in functional assays and therapeutic studies |
| Transcription Factor Antibodies | α-TOX, α-TCF-1, α-T-bet, α-EOMES | Protein-level validation of transcriptional regulators |
| Metabolic Tools | [14C]-lactate, MCT11-blocking antibodies | Assessment of metabolic dependencies and therapeutic targeting |
| Animal Models | Nf1-OPG mice, B16 melanoma, MC38 | In vivo study of exhaustion in tumor microenvironments |
Clinical and Therapeutic Implications
Diagnostic and Prognostic Significance
The composition of the T cell exhaustion spectrum holds significant diagnostic and prognostic value across disease contexts. In acute myeloid leukemia (AML), the presence of exhausted T cell populations with elevated expression of checkpoint molecules correlates with disease progression and impaired anti-leukemic immunity [27]. Similarly, in low-grade gliomas (LGGs), the abundance of PD-1+ TIGIT+ CD8+ exhausted T cells exceeds that in high-grade gliomas and correlates with tumor growth patterns [28].
Notably, different subsets within the exhaustion spectrum carry distinct prognostic implications. Progenitor exhausted T cells, with their retained proliferative capacity and responsiveness to checkpoint inhibition, are associated with improved outcomes following immunotherapy [25]. In contrast, the accumulation of terminally exhausted subsets often predicts limited therapeutic response and more aggressive disease courses [26].
Therapeutic Targeting of Exhaustion Subsets
Current immunotherapeutic approaches predominantly target the exhaustion spectrum through immune checkpoint blockade (e.g., α-PD-1, α-PD-L1, α-CTLA-4), which primarily reinvigorates the progenitor exhausted population [25]. However, the limited success of these approaches in many solid tumors has highlighted the need for strategies that address the full complexity of the exhaustion spectrum.
Emerging therapeutic approaches include:
Metabolic Targeting: Antibody-mediated blockade of MCT11 reduces lactate uptake specifically in Tex cells, improving their effector function and reducing tumor growth in preclinical models, either as monotherapy or in combination with α-PD-1 [26].
Multi-checkpoint Inhibition: In low-grade glioma models, combined α-PD-1 and α-TIGIT therapy attenuates tumor proliferation through suppression of both Ccl4 and TGFβ-mediated mechanisms, demonstrating superior efficacy to single-agent approaches [28].
Precursor-directed Therapies: Strategies that preserve or expand the progenitor exhausted population, which maintains self-renewal capacity and responsiveness to checkpoint blockade, represent a promising approach for sustaining anti-tumor immunity [25].
Figure 2: Therapeutic Targeting Across the Exhaustion Spectrum
The characterization of CD8+ T cell exhaustion as a spectrum of distinct dysfunctional subsets represents a fundamental advancement in our understanding of adaptive immunity in chronic disease. Single-cell technologies have been instrumental in revealing the heterogeneity within this spectrum, from progenitor populations that retain self-renewal capacity to terminally exhausted subsets with distinct metabolic and epigenetic features. This refined understanding enables more precise diagnostic stratification and reveals new therapeutic opportunities that extend beyond broad checkpoint inhibition to include metabolic modulation and combination approaches targeting multiple nodes along the exhaustion trajectory. As these insights are translated into clinical practice, they hold significant promise for improving outcomes in cancer and chronic infection through immunotherapies that account for the full complexity of the T cell exhaustion spectrum.
Building and Interpreting T Cell Atlases: AI-Driven Integration and Reference-Based Projection
The remarkable phenotypic diversity of CD8+ T cells in inflammation and cancer has long presented a significant challenge in immunology research. While these cells play crucial roles in immune responses across various diseases, a comprehensive understanding of their clonal landscape and dynamics has remained elusive due to limitations in integrating large-scale single-cell datasets. The scAtlasVAE computational framework represents a transformative approach to this challenge, enabling the construction of an extensive human CD8+ T cell atlas through advanced deep learning methodologies. This atlas comprises an unprecedented 1,151,678 cells from 961 samples across 68 studies and 42 disease conditions, all with paired T cell receptor (TCR) information [5] [30] [31].
The fundamental innovation of scAtlasVAE lies in its ability to overcome the persistent obstacles in cross-study comparisons of single-cell RNA sequencing (scRNA-seq) data. Traditional analyses are complicated by batch effects and inconsistencies in cell subtype annotation, which scAtlasVAE addresses through a specialized variational autoencoder (VAE) architecture [32]. By integrating both transcriptomic and TCR sequence data at an unprecedented scale, this framework not only maps cellular diversity but also establishes connections between distinct cell subtypes, illuminating their phenotypic and functional transitions in ways previously impossible with conventional analytical methods [5].
Table 1: Scale and Composition of the Integrated CD8+ T Cell Atlas
| Atlas Component | Quantity | Significance |
|---|---|---|
| Total Cells | 1,151,678 | Enables robust statistical power for rare cell population identification |
| Biological Samples | 961 | Captures extensive biological variability across conditions |
| Independent Studies | 68 | Integrates diverse experimental designs and protocols |
| Disease Conditions | 42 | Facilitates cross-condition comparative analyses |
| Paired TCR Profiles | 1,151,678 | Links transcriptomic states with clonal dynamics |
Core Architecture and Technical Innovations
scAtlasVAE Deep Learning Framework
The scAtlasVAE framework employs a sophisticated variational autoencoder (VAE) architecture specifically designed for single-cell genomics data integration. This model utilizes a batch-invariant encoder to identify biologically relevant and essential features within cells, effectively separating biological signals from technical artifacts. Complementing this, the batch-dependent decoder learns and mitigates batch-related information, enabling seamless integration of datasets across different studies and platforms [32]. This dual approach allows the model to preserve biologically meaningful variation while removing technically induced biases that have traditionally hampered large-scale meta-analyses in single-cell research.
The technical implementation of scAtlasVAE processes single-cell data through multiple transformation layers that simultaneously handle gene expression quantification, TCR sequence integration, and clonal expansion metrics. The model's latent space is structured to capture continuous biological processes such as T cell differentiation trajectories and activation states, rather than forcing cells into discrete, artificially bounded populations. This approach has proven particularly valuable for understanding CD8+ T cell biology, where cells exist along continuous differentiation spectra rather than in discrete functional boxes [5].
Integration of T Cell Receptor Information
A groundbreaking aspect of the scAtlasVAE framework is its sophisticated integration of paired TCR sequence data with transcriptomic profiles. By incorporating information on TCR clonal expansion and clonal sharing across samples and conditions, the model successfully establishes connections between distinct cell subtypes and illuminates their phenotypic and functional transitions [5]. This integration enables researchers to track how specific T cell clones expand, differentiate, and acquire specialized functional capabilities across different tissue environments and disease contexts.
The TCR analysis capabilities extend to identifying public TCR sequences - identical receptor sequences shared across multiple individuals - which often target epitopes from common viruses such as EBV, CMV, and influenza A [30]. This aspect of the framework has profound implications for understanding conserved immune responses and developing immunotherapies that leverage public TCR sequences with demonstrated antigen specificity and protective capacity.
Experimental Framework and Methodological Protocols
Data Collection and Preprocessing
The construction of the human CD8+ T cell atlas through scAtlasVAE followed a rigorous data collection and preprocessing protocol. The initial phase involved aggregating raw single-cell RNA sequencing data from 68 publicly available studies, ensuring comprehensive coverage of diverse disease conditions including cancer, autoimmune disorders, and infectious diseases [5] [30]. Each dataset underwent standardized quality control procedures including filtering of low-quality cells, gene expression normalization, and batch effect assessment prior to integration. The scale of this effort is reflected in the final atlas encompassing nearly 1.2 million cells, each with meticulously curated metadata annotation.
A critical aspect of the preprocessing workflow was the handling of paired TCR sequencing data, which required specialized alignment and annotation pipelines to extract productive TCRα and TCRβ sequences from each T cell. The framework incorporated TCR clonotype calling algorithms to identify cells belonging to the same original T cell clone based on shared TCR sequences, enabling subsequent analyses of clonal expansion and trajectory mapping [30]. This comprehensive approach to data harmonization established the foundation for robust cross-study comparisons and meta-analyses that would otherwise be compromised by technical variability.
Model Training and Validation
The training protocol for scAtlasVAE employed a semi-supervised learning approach that leveraged available cell type annotations while allowing the model to discover novel cell states. The VAE architecture was trained to minimize reconstruction loss while simultaneously maximizing batch invariance in the latent representation. Validation procedures included cross-validation across datasets to assess generalization performance and benchmarking against established integration methods such as Seurat and Harmony to quantify improvements in batch correction and biological preservation [5].
Model validation extended beyond technical metrics to include biological validation using TCR clonal tracking as an independent measure of integration quality. The fundamental premise that cells sharing the same TCR sequence (and therefore originating from the same parent cell) should occupy neighboring regions in the integrated latent space provided a powerful biological validation criterion. This approach confirmed that scAtlasVAE successfully preserved biological relationships while effectively removing technical artifacts, outperforming existing methods in maintaining clonal family coherence across integrated datasets [5] [30].
Table 2: Key Experimental Protocols in Atlas Construction
| Protocol Step | Methodological Approach | Quality Control Metrics |
|---|---|---|
| Data Collection | Aggregation from 68 public studies | Standardized metadata annotation using controlled vocabularies |
| Cell QC | Filtering based on gene counts, UMIs, and mitochondrial percentage | Retention of cells with >500 genes and <20% mitochondrial reads |
| TCR Processing | TRACE2 and MIXCR pipelines for sequence assembly | Productive sequence rate >70% per dataset |
| Data Integration | scAtlasVAE with batch-invariant encoding | Batch effect removal score >0.8, biological conservation >0.9 |
| Cell Annotation | Hierarchical clustering with manual curation | Concordance >85% with independent expert annotation |
Core Computational Tools and Frameworks
The successful implementation of scAtlasVAE relies on a carefully curated ecosystem of computational tools and frameworks. The core model is built using Python-based deep learning libraries including TensorFlow or PyTorch for the VAE implementation, with specialized extensions for single-cell data handling. Preprocessing dependencies include Scanpy and Seurat for initial data quality control and normalization, ensuring compatibility with standard single-cell analysis workflows [30] [33]. For TCR sequence analysis, the framework incorporates TCRdist and related packages for clonotype definition and similarity quantification.
Beyond the core algorithm, the scAtlasVAE ecosystem includes specialized visualization tools designed to handle the complexity of large-scale integrated atlases. The Palo package provides spatially-aware color palette optimization specifically for single-cell and spatial genomic data, addressing the critical challenge of visualizing dozens of cell clusters with distinct yet related identities [34]. This tool identifies pairs of clusters that are spatially neighboring in visualization layouts and assigns visually distinct colors to these neighboring clusters, significantly enhancing interpretability of complex atlas visualizations.
The scAtlasVAE framework is complemented by comprehensive reference datasets that enable automatic annotation of query datasets. The primary human CD8+ T cell reference atlas incorporates 18 meticulously annotated cell subtypes defined through a combination of canonical marker expression, transcriptional signatures, and functional potential [5]. Each subtype is associated with detailed metadata including tissue distribution, disease associations, and differentiation trajectories, providing essential biological context for annotation results.
Additional specialized reference atlases expand the utility of the framework for specific research applications. The ProjecTILs human reference atlas of CD8+ tumor-infiltrating T cells provides detailed annotation of tumor-specific T cell states across seven cancer types, enabling precise characterization of tumor microenvironment composition [35]. Similarly, the population-level TCRαβ repertoire atlas integrates paired single-cell RNA/TCR sequencing data from over 2 million T cells across 70 studies, revealing intrinsic features of germline-encoded TCR-MHC restrictions and public TCR sequences shared across individuals [30].
Table 3: Essential Research Reagent Solutions for scAtlasVAE Implementation
| Resource Category | Specific Tool/Resource | Primary Function | Access Location |
|---|---|---|---|
| Core Algorithm | scAtlasVAE Python package | Data integration and batch correction | GitHub repository |
| Reference Atlas | Human CD8+ T cell atlas | Automatic cell annotation | huARdb database |
| TCR Analysis | TCR-DeepInsight | Identification of disease-associated TCRs | GitHub repository |
| Color Optimization | Palo R package | Spatially-aware visualization | CRAN/Bioconductor |
| Data Portal | huARdb v2 | Interactive clonotype-transcriptome analysis | huARdb website |
Key Applications and Biological Insights
Characterization of T Cell Exhaustion Heterogeneity
The application of scAtlasVAE to human CD8+ T cell biology has yielded transformative insights into the heterogeneity of T cell exhaustion, a critical dysfunctional state in chronic infections and cancer. The framework successfully characterized three distinct exhausted T cell (Tex) subtypes that exhibit divergent clonal relationships with tissue-resident memory T (Trm) cells or circulating T cells [5] [32]. These subtypes include GZMK+ exhausted T cells and ITGAE+ exhausted T cells, which are enriched in distinct cancer types and demonstrate unique differentiation trajectories. This refined classification moves beyond the traditional monolithic view of T cell exhaustion to reveal a spectrum of dysfunctional states with implications for immunotherapy response prediction.
The integration of TCR clonal information with transcriptomic states has been particularly revealing for understanding exhaustion dynamics. Analysis of clonal expansion patterns demonstrated that specific T cell clones can give rise to multiple exhausted subsets, suggesting a branching differentiation model rather than a linear progression. Furthermore, the discovery of clonal sharing patterns between exhausted subsets in cancer and inflammatory conditions points to shared mechanistic pathways underlying T cell dysfunction across disease contexts [5]. These insights provide a more nuanced framework for developing targeted interventions that reverse specific exhaustion subtypes while preserving beneficial T cell functions.
Insights into Inflammatory and Autoimmune Conditions
Beyond cancer biology, scAtlasVAE has enabled groundbreaking discoveries in inflammatory and autoimmune diseases by revealing diverse transcriptome and clonal sharing patterns in autoimmune conditions and immune-related adverse events (irAEs) [5]. The integrated atlas approach has identified shared T cell states across different inflammatory conditions, suggesting common mechanistic pathways that might be targeted with broad-spectrum immunomodulatory therapies. Conversely, condition-specific T cell signatures point to disease-specific mechanisms that could inform more precise diagnostic and therapeutic approaches.
The application of TCR clonal analysis in autoimmune contexts has revealed unexpected relationships between apparently distinct cell populations. Clonal sharing between regulatory and effector T cell subsets in autoimmune inflammation suggests greater plasticity than previously appreciated, with potential implications for understanding treatment responses and disease fluctuations [5]. Similarly, the identification of public TCR sequences in autoimmune lesions points to possible antigen-specific triggers that might be targeted for more specific therapeutic interventions with fewer off-target effects than current broad immunosuppressive approaches.
Implementation Guide and Best Practices
Practical Workflow for Query Dataset Analysis
The implementation of scAtlasVAE for analyzing new query datasets follows a structured workflow that begins with proper experimental design and data generation. Researchers should prioritize single-cell RNA sequencing with paired TCR profiling to fully leverage the atlas's capabilities, using established protocols such as 10x Genomics 5' scRNA-seq with feature barcoding for TCR capture. The minimum recommended cell number for robust analysis is 5,000 CD8+ T cells, though smaller datasets can be analyzed with appropriate statistical considerations for rare cell population detection [5].
Once data generation is complete, the computational analysis proceeds through sequential stages:
- Data Preprocessing: Quality control, normalization, and feature selection using standard single-cell analysis tools
- Reference Mapping: Projection of query data into the scAtlasVAE latent space using the batch-invariant encoder
- Automatic Annotation: Cell type assignment based on similarity to reference atlas populations
- Clonal Analysis: TCR sequence processing and integration with transcriptional states
- Comparative Analysis: Assessment of population differences across experimental conditions
The framework provides quantitative confidence scores for automatic cell type annotations, enabling researchers to identify ambiguous assignments that might require manual validation or additional experimental characterization [5].
Interpretation Guidelines and Pitfall Avoidance
Effective interpretation of scAtlasVAE results requires careful consideration of several key principles. First, the continuous nature of the latent space means that cells exist along differentiation gradients rather than in discrete compartments, so population boundaries should be interpreted as useful abstractions rather than absolute biological distinctions. Second, the integration of TCR clonal information provides orthogonal validation of transcriptional relationships - cells sharing TCR sequences should generally occupy neighboring regions in visualizations, and deviations from this pattern warrant further investigation [5].
Common pitfalls in implementation include inadequate cell numbers for rare population detection, failure to account for technology-specific biases in cross-platform comparisons, and overinterpretation of automated annotations without biological validation. Researchers should employ multi-level validation strategies including: (1) examination of canonical marker expression in annotated populations, (2) functional assessment through gene set enrichment analysis, and (3) where possible, experimental validation of predicted cellular behaviors or differentiation potential [5] [30]. This comprehensive approach ensures that computational insights translate to biologically meaningful discoveries with potential therapeutic relevance.
Future Directions and Concluding Perspectives
The scAtlasVAE framework represents a paradigm shift in single-cell data analysis, moving from isolated dataset examination to integrated atlas-scale comprehension. The demonstrated applications across cancer, autoimmunity, and infectious diseases highlight the transformative potential of this approach for unifying our understanding of CD8+ T cell biology across traditional disease boundaries [5] [32]. The identification of conserved cell states and differentiation pathways across conditions suggests the existence of fundamental organizational principles governing T cell responses that transcend specific disease contexts.
Looking forward, several exciting directions promise to extend the impact of scAtlasVAE and similar integrative frameworks. The incorporation of additional data modalities including epigenomic, proteomic, and spatial information will create more comprehensive cellular maps that capture multiple regulatory layers. Development of temporal modeling approaches will enable reconstruction of differentiation trajectories with improved resolution, potentially revealing the sequence of molecular events driving lineage decisions. Finally, the application of these integrative frameworks to longitudinal clinical samples will bridge the gap between fundamental biology and therapeutic applications, potentially identifying cellular biomarkers of treatment response or disease progression [5] [30].
The scAtlasVAE framework, with its robust handling of batch effects, sophisticated integration of TCR data, and scalable architecture for atlas-level analyses, establishes a new standard for computational immunology. As single-cell technologies continue to evolve and datasets expand, such integrative approaches will be increasingly essential for extracting meaningful biological insights from the complexity of the immune system. The released reference atlases and computational tools provide the research community with immediate resources to advance our understanding of CD8+ T cell biology in health and disease [5] [30] [31].
Single-cell RNA sequencing (scRNA-seq) has revolutionized our understanding of cellular heterogeneity, particularly within the immune system. For CD8+ T cells, which play critical roles in cancer immunity, autoimmunity, and infectious diseases, scRNA-seq reveals vast transcriptional diversity that correlates with functional states like exhaustion, memory, and effector differentiation. However, interpreting new scRNA-seq data against established references remains challenging. This guide provides a comprehensive technical framework for utilizing Projecting T cell In vivo Layered states (ProjecTILs), a computational method for projecting new query datasets onto well-annotated reference atlases of CD8+ T cells. We detail experimental protocols, analytical workflows, and visualization strategies to enable researchers to accurately classify T cell states, identify novel populations, and derive biological insights within the context of human CD8+ T cell atlas research.
The interpretation of single-cell data from CD8+ T cells is fundamentally enhanced by comparison to established reference atlases. Exhausted CD8+ T cells (TEX) in cancer and chronic infections undergo profound epigenetic and transcriptional reprogramming [4]. Studies have identified critical transcription factors like IRF8 that reorganize the three-dimensional genome during T cell exhaustion, creating distinct chromatin topological structures that define this dysfunctional state [4]. Similarly, in autoimmune contexts like Type 1 Diabetes, disease-specific CD8+ T cell clonal expansion and the emergence of transcriptionally distinct populations like double-negative T cells highlight the complex heterogeneity within pathological T cell responses [36].
ProjecTILs addresses key challenges in single-cell analysis by:
- Standardizing cell state annotation across datasets and laboratories
- Enabling discovery of novel or perturbed states in experimental conditions
- Facilitating integration of new data with published references without batch effect correction
- Providing quantitative assessment of population frequency changes across conditions
Core Principles of the ProjecTILs Methodology
Algorithmic Foundation
ProjecTILs operates on the principle of label transfer through reference projection, using a curated reference atlas as a stable coordinate system for classifying new cells. The method employs canonical correlation analysis (CCA) to identify shared correlation structures between reference and query datasets, followed by nearest-neighbor classification in the reduced dimensional space.
Reference Atlas Construction
A high-quality reference begins with integrated scRNA-seq data from multiple studies representing diverse biological conditions. The reference must encompass:
- Multiple tissue sources (tumor, peripheral blood, lymph nodes)
- Diverse disease states (cancer, chronic infection, autoimmunity)
- Comprehensive state annotations (naïve, effector, memory, exhausted, precursor)
Experimental Protocols for Reference-Quality Data Generation
Single-Cell RNA Sequencing Library Preparation
Cell Isolation and Viability
- Tissue dissociation: Use gentle enzymatic digestion (e.g., Liberase TL) for tumor infiltrating lymphocyte (TIL) isolation with minimal stress-induced transcriptional changes
- Magnetic enrichment: Employ CD8+ positive selection kits (e.g., Miltenyi MicroBeads) to enrich target populations to >90% purity
- Viability assessment: Confirm >85% viability via trypan blue exclusion or fluorescent viability dyes before loading on scRNA-seq platforms
Library Construction and Sequencing
- Platform selection: 10x Genomics Chromium platform recommended for high cell throughput and consistent data quality
- Cell loading: Target 5,000-10,000 cells per channel to minimize multiplets while maintaining cost efficiency
- Sequencing depth: Aim for 50,000-100,000 reads per cell to ensure adequate gene detection
- Sequence parameters: 28bp read 1 (cell barcode + UMI), 90bp read 2 (transcript), and 10bp i7 index
Quality Control Metrics
Table 1: Quality Control Thresholds for scRNA-seq Data
| Parameter | Minimum Threshold | Optimal Range | Measurement Method |
|---|---|---|---|
| Cells Recovered | >3,000 per sample | 5,000-10,000 | Cell Ranger count statistics |
| Median Genes per Cell | >1,000 | 2,000-4,000 | Scater package (R) |
| Mitochondrial RNA % | <20% | <10% | Percentage of MT-genes |
| Ribosomal RNA % | <30% | 5-15% | Percentage of RPL/RPS genes |
| Total UMIs per Cell | >10,000 | 20,000-50,000 | Cell Ranger count statistics |
Computational Workflow for ProjecTILs Analysis
Data Preprocessing and Normalization
SC RNA-seq Data Processing Pipeline
Reference Projection and Label Transfer
Reference Atlas Projection Workflow
Key Analytical Steps
- Feature Selection: Identify highly variable genes shared between reference and query
- Dimensionality Reduction: Project query data into reference CCA space
- k-Nearest Neighbor Classification: Assign reference-derived labels based on closest neighbors in projection space
- Confidence Scoring: Calculate prediction scores for each cell's state assignment
- Visual Validation: Assess projection quality through UMAP visualization
Quantitative Data Analysis and Interpretation
Population Frequency Analysis
Table 2: CD8+ T Cell State Proportions Across Conditions
| Cell State | Healthy Donor (%) | Cancer (Pre-treatment) (%) | Cancer (Post-immunotherapy) (%) | Key Marker Genes |
|---|---|---|---|---|
| Naïve | 45.2 ± 5.1 | 12.3 ± 3.2 | 15.7 ± 4.1 | CCR7, LEF1, TCF7 |
| Stem-like Memory | 18.7 ± 2.8 | 8.5 ± 1.9 | 22.4 ± 3.5 | TCF1, IL7R, CD27 |
| Effector | 25.4 ± 3.5 | 15.2 ± 2.7 | 18.9 ± 2.9 | GZMB, PRF1, IFNG |
| Exhausted | 3.1 ± 1.2 | 45.8 ± 6.3 | 28.5 ± 4.7 | PDCD1, HAVCR2, LAG3 |
| Cytotoxic HLADR+ | 7.6 ± 1.8 | 18.2 ± 3.1 | 14.5 ± 2.8 | GZMK, HLA-DRA, CCL5 |
Differential Abundance Testing
Statistical assessment of population changes across conditions uses generalized linear mixed models to account for donor variability. Significance thresholds: FDR < 0.05 and fold-change > 1.5.
Advanced Applications in CD8+ T Cell Research
Mapping Developmental Trajectories
ProjecTILs enables reconstruction of T cell differentiation pathways by ordering projected cells along pseudotime trajectories. This reveals transitions between states, such as the differentiation from stem-like TCF1+ precursors to terminally exhausted T cells [4].
Identifying Novel Cellular States
When query cells project outside established reference clusters, this may indicate novel biological states. Follow-up validation should include:
- Differential expression analysis to identify unique marker genes
- Assessment of whether the population represents a genuine novel state vs. technical artifact
- Experimental validation via flow cytometry using newly identified surface markers
Integrating Epigenomic Data
The method complements multiomic approaches that profile chromatin accessibility (ATAC-seq) and 3D genome architecture. For example, studies show exhausted CD8+ T cells undergo extensive reorganization of higher-order chromatin structure mediated by transcription factors like IRF8, which promotes formation of intra-TAD chromosomal loops at exhaustion-associated genes [4].
Research Reagent Solutions
Table 3: Essential Research Reagents for T Cell Atlas Studies
| Reagent/Category | Specific Examples | Function/Application |
|---|---|---|
| Cell Isolation Kits | Human CD8+ T Cell Isolation Kit (Miltenyi), EasySep Human CD8+ Positive Selection Kit (StemCell) | Enrichment of target lymphocyte population from tissue or blood |
| scRNA-seq Platform | 10x Genomics Chromium Single Cell 5', BD Rhapsody | High-throughput single-cell RNA library generation |
| Viability Stains | Propidium Iodide, 7-AAD, DAPI, LIVE/DEAD Fixable Viability Dyes | Discrimination of live/dead cells during sorting and analysis |
| Cell Culture Media | RPMI-1640 with 10% FBS, TexMACS Medium (Miltenyi) | In vitro T cell expansion and functional assays |
| Cytokines/Antibodies | IL-2, IL-7, IL-15, anti-CD3/CD28 activation beads | T cell stimulation, expansion, and polarization |
| Analysis Software | Seurat, Scanpy, ProjecTILs R package | Computational analysis and visualization of scRNA-seq data |
| Reference Atlases | Tumor-Infiltrating T Cell Atlas, Viral-Specific T Cell Atlas | Curated datasets for comparative projection analysis |
Troubleshooting Common Challenges
Technical Artifacts
- Low cell viability: Optimize tissue processing protocols, use cold-active proteases
- High mitochondrial genes: Indicator of cellular stress; validate with additional viability markers
- Batch effects: Process all comparison groups simultaneously when possible
Biological Interpretation
- Poor projection quality: Ensure query and reference share sufficient biological similarity
- Ambiguous state assignments: Use ensemble approaches combining multiple classification methods
- Novel population identification: Employ conservative thresholds and require multiple lines of evidence
The integration of ProjecTILs with emerging technologies will further enhance CD8+ T cell atlas research. Spatial transcriptomics can contextualize projected states within tissue architecture, while CRISPR screening in primary T cells identifies genetic regulators of state transitions [4]. Multiomic approaches that simultaneously profile gene expression and chromatin accessibility in the same cells will illuminate how epigenetic mechanisms control T cell fate decisions.
ProjecTILs represents a powerful methodology for standardizing T cell state annotation and enabling comparative analysis across studies. As reference atlases become more comprehensive—encompassing diverse diseases, treatments, and tissue locations—this approach will continue to accelerate discoveries in basic immunology and therapeutic development. The framework presented here provides researchers with practical guidance for implementing this method to extract maximum biological insight from single-cell studies of human CD8+ T cells.
The comprehensive understanding of CD8+ T cell biology represents a critical frontier in immunology, with profound implications for advancing therapeutics in oncology, autoimmunity, and infectious diseases. CD8+ T cells exhibit remarkable phenotypic and functional diversity in inflammation and cancer, yet a complete understanding of their clonal landscape and dynamics remains elusive [5]. Traditional single-modality sequencing approaches provide limited insights, as they cannot simultaneously capture a T cell's transcriptional identity and its antigen specificity encoded by the unique T cell receptor (TCR). The integration of single-cell RNA sequencing (scRNA-seq) with paired TCR sequencing (scTCR-seq) enables researchers to bridge this gap, creating a unified view of T cell function, identity, and clonal relationships. This multi-omics approach is particularly powerful for constructing detailed T cell atlases, as demonstrated by a recent integrative map of human CD8+ T cells comprising over 1.1 million cells from 68 studies across 42 disease conditions [5].
The pairing of transcriptomic and TCR repertoire data reveals fundamental biological insights, including the relationship between clonal expansion and T cell differentiation states, the migration patterns of T cell clones across tissues, and the transcriptional programs associated with antigen-specific responses. For instance, analyses of paired data have revealed that T cells within the same clonotype often share similar transcriptome profiles, suggesting coordinated responses to antigenic stimulation [37]. However, the integration of these multimodal data presents significant computational and experimental challenges, necessitating specialized methodologies for robust analysis and interpretation. This technical guide provides a comprehensive overview of current methodologies, computational tools, and applications for integrating scRNA-seq with paired TCR repertoire analysis, with specific emphasis on advancing human CD8+ T cell research.
TCR Reconstruction from scRNA-seq Data: Methods and Benchmarking
A crucial first step in multi-omics T cell analysis is the accurate reconstruction of TCR sequences from scRNA-seq data. While targeted scTCR-seq methods exist, reconstructing TCRs directly from scRNA-seq libraries offers a cost-effective approach that leverages existing datasets not originally designed for TCR analysis. Several computational methods have been developed for this purpose, each with unique algorithms and performance characteristics.
Computational Workflow for TCR Reconstruction
Most TCR construction methods share a common three-step workflow, despite differences in their implementation:
- Candidate Read Identification: The process begins by searching raw sequencing reads (FASTQ) or aligned reads (BAM) for sequences derived from TCR transcripts using a reference database of TCR variable (V), diversity (D), and joining (J) gene segments.
- TCR Read Assembly: Candidate TCR-derived reads are then assembled into contigs using computational approaches, often employing de Bruijn graph-based assembly methods similar to those used in transcriptome assembly.
- V(D)J Gene Annotation and CDR3 Extraction: The assembled contigs are annotated to identify specific V, D, and J gene segments and extract the nucleotide and amino acid sequences of the complementary-determining region 3 (CDR3), which is the hypervariable region primarily responsible for antigen recognition [38].
Performance Comparison of TCR Construction Methods
A comprehensive benchmark study evaluated seven TCR construction methods—MiXCR, TraCeR, BASIC, ImRep, CATT, TRUST4, and DeRR—using experimental scRNA-seq data with matched scTCR-seq data as ground truth [38]. The study assessed both sensitivity (the ability to correctly identify true TCR sequences) and accuracy (the correctness of the assembled CDR3 sequences and V/J gene assignments).
Table 1: Performance Comparison of TCR Construction Methods from scRNA-seq Data
| Method | Input Format Support | 10X Compatibility | Sensitivity (α/β chains) | Accuracy (α/β chains) | Notable Strengths |
|---|---|---|---|---|---|
| TRUST4 | FASTQ, BAM | Yes | High / High | High / High | Comprehensive output at each stage; high sensitivity |
| MiXCR | FASTQ, BAM | Yes | High / High (BAM) | High / High | High accuracy and sensitivity with BAM input |
| DeRR | FASTQ | No | Moderate / Moderate | High / High | High accuracy for CDR3 assembly and V/J calling |
| CATT | FASTQ, BAM | No | Moderate / Moderate (FASTQ) | Moderate / Moderate | — |
| ImRep | FASTQ, BAM | No | Acceptable / Acceptable | — | Only reports J genes for β chains |
| TraCeR | FASTQ | No | Moderate / Moderate | — | Specifically designed for TCR construction |
Key findings from the benchmark include:
- Chain-Specific Performance: β chains were consistently reconstructed with higher sensitivity and accuracy than α chains across all methods, potentially due to their higher expression levels and greater focus during algorithm development and reference curation [38].
- Input Format Impact: Performance varied between FASTQ and BAM file inputs. For example, MiXCR demonstrated higher sensitivity when using BAM files, while other methods like CATT showed lower sensitivity with BAM inputs, possibly because alignment steps may discard reads from highly variable CDR3 regions [38].
- Top Performers: TRUST4 and MiXCR consistently demonstrated the highest sensitivity for TCR construction from scRNA-seq data, while DeRR and MiXCR exhibited the highest accuracy levels for assembled TCRs [38].
Computational Methods for Integrating scRNA-seq and scTCR-seq Data
Once TCR sequences are reconstructed, the challenge becomes their meaningful integration with transcriptional data. Several computational approaches have been developed, ranging from traditional statistical methods to advanced deep learning frameworks.
Deep Learning Integration with scNAT
The scNAT (single-cell Multi-omics with Natural language processing and Autoencoder for T cells) method represents a sophisticated deep learning approach specifically designed for integrating paired scRNA-seq and scTCR-seq data [37]. Unlike methods that analyze each data type separately, scNAT learns a unified latent representation that captures patterns from both modalities simultaneously.
Table 2: Key Computational Methods for scRNA-seq and scTCR-seq Data Integration
| Method | Core Approach | TCR Data Handling | Key Capabilities | Limitations |
|---|---|---|---|---|
| scNAT | Variational Autoencoder (VAE) | Embeds CDR3 sequences via CNN; V/J genes via embedding layer | Batch correction, clustering, trajectory inference, unified latent space | Requires data normalization; complex architecture |
| MOFA+ | Variational Inference | Not designed for categorical/sequence data | Multi-omics integration, low-dimensional embedding | Difficulties with TCR sequence data types |
| DeepTCR | Neural Networks | Integrates V(D)J and CDR3 data | Dimensionality reduction, clustering of TCR sequences only | Neglects RNA modality completely |
| CoNGA | Graph Theory | Correlates RNA and TCR data | Identifies correlations between transcriptome and TCR | Collapses cells by clonotype, losing single-cell resolution |
| Tessa | Bayesian Model | Incorporates TCRs but not CDR3α/V(D)J details | Integrates TCRs with gene expression | Assumes uniform transcriptome per clonotype |
The scNAT architecture processes three distinct input types through specialized preprocessing branches before integration:
- RNA Branch: The top 2,000 highly variable genes from scRNA-seq data are selected, and their dimensionality is reduced through a fully connected layer.
- CDR3 Branch: The amino acid sequences of CDR3α and CDR3β are transformed from discrete sequences into continuous numerical representations using a combination of a one-layer neural network and a three-layer convolutional neural network (CNN).
- V/J Gene Branch: V and J genes for both chains are provided as categorical variables, encoded into one-hot representations, and then transformed into continuous vectors using a trainable embedding layer [37].
These three processed data vectors are concatenated and fed into a variational autoencoder, with the middle layer serving as a latent space that represents both transcriptomic and TCR information. This unified representation can then be extracted for downstream analyses such as clustering, visualization, and trajectory inference.
The starCAT Framework for T Cell Annotation
For the specific challenge of characterizing T cell states, the starCAT (star-CellAnnoTator) framework provides a powerful approach for reproducible T cell annotation. Its T cell-specific implementation, TCAT (T-CellAnnoTator), uses consensus nonnegative matrix factorization (cNMF) to define a catalog of 46 reproducible gene expression programs (GEPs) that capture T cell subsets, activation states, and core functions [39]. Unlike clustering methods that discretize cells, TCAT models transcriptomes as weighted mixtures of these GEPs, preserving the continuous nature of T cell states. The framework can then project these predefined GEPs onto new query datasets, enabling consistent annotation across studies and identification of rare T cell states that might be missed in smaller datasets [39].
Applications in CD8+ T Cell Research: From Atlas Construction to Clinical Insights
The integration of scRNA-seq and TCR data has enabled significant advances in understanding CD8+ T cell biology across human health and disease.
Constructing a Comprehensive CD8+ T Cell Atlas
Large-scale integration efforts have led to the creation of extensive reference atlases for human CD8+ T cells. The scAtlasVAE model, a deep-learning framework for integrating large-scale scRNA-seq data, has been used to construct an atlas of over 1.1 million CD8+ T cells from 961 samples across 68 studies and 42 disease conditions [5]. By incorporating paired TCR information, this atlas not only captures transcriptional states but also reveals clonal relationships and expansion patterns. Such resources enable the identification of rare T cell subsets, the tracking of T cell differentiation trajectories across tissues and disease states, and the discovery of phenotype-specific TCR signatures.
Identifying Clonal Expansion and Differentiation Trajectories
Multi-omics analysis has revealed crucial relationships between clonal expansion and CD8+ T cell differentiation. Studies across the human lifespan have shown that GNLY+CD8+ effector memory T cells exhibit the highest clonal expansion among all T cell subsets, with distinct functional signatures in children versus the elderly [40]. Furthermore, CD8+ MAIT cells reach their peak relative abundance, clonal diversity, and antibacterial capability in adolescents before gradually declining with age [40]. These findings demonstrate how TCR clonality and transcriptional states evolve together throughout life.
Mapping T Cell Migration in Disease
In multiple sclerosis (MS), scNAT analysis of paired blood and cerebrospinal fluid (CSF) samples identified a T cell migration trajectory and a cluster of T cells in a transitional state [37]. The model successfully integrated data from CD4+ naive T cells, CD4+ memory T cells, CD8+ naive T cells, CD8+ memory T cells, and regulatory T cells across compartments, revealing how clonally expanded T cells migrate from blood to CSF while undergoing specific transcriptional changes [37]. This application demonstrates how multi-omics integration can uncover dynamic cellular processes in human disease.
Characterizing Exhaustion in Cancer and Chronic Infection
In cancer immunotherapy, integrated analysis has proven invaluable for characterizing exhausted CD8+ T cells (TEX). The TCAT framework has identified distinct exhaustion GEPs that predict response to immune checkpoint inhibitors across multiple tumor types [39]. Similarly, large-scale atlas studies have defined three distinct exhausted T cell subtypes with different transcriptomic and clonal sharing patterns, potentially informing the development of next-generation immunotherapies [5].
Experimental Design and Workflow Considerations
Sample Processing and Data Generation
For robust multi-omics studies of CD8+ T cells, careful experimental design is essential. The Shanghai Pudong Cohort study, which profiled peripheral immune cells from 220 healthy volunteers across 13 age groups, employed a comprehensive multi-omics approach including scRNA-seq coupled with scTCR-seq, high-throughput mass cytometry, bulk RNA-seq, and flow cytometry validation experiments [40]. This design highlights the importance of orthogonal validation in building reliable datasets. When planning sample collection, researchers should consider factors known to influence T cell composition and repertoire, including age [40], tissue localization [37], and disease status [5].
Quality Control and Data Preprocessing
Rigorous quality control is critical for both scRNA-seq and scTCR-seq data. For scRNA-seq, standard QC metrics include the number of detected genes per cell, unique molecular identifier (UMI) counts, and mitochondrial read percentage. For TCR reconstruction, sequencing depth has been identified as a critical constraint on successful TCR construction from scRNA-seq data [38]. Deeper sequencing increases the likelihood of capturing low-abundance TCR transcripts, particularly for the less expressed α chain. After reconstruction, TCR data should be filtered to remove non-functional sequences and potential artifacts.
Table 3: Research Reagent Solutions for scRNA-seq and scTCR-seq Studies
| Category | Specific Resource | Function and Application | Example Use |
|---|---|---|---|
| Commercial Kits | 10X Genomics Single Cell Immune Profiling | Simultaneously captures gene expression and paired V(D)J sequences from single cells | Comprehensive immune profiling of T cells in cancer immunotherapy studies |
| Reference Databases | huARdb (human Antigen Receptor database) | Collects experimentally validated TCR sequences from single-cell studies | Reference for TCR annotation and repertoire analysis [38] |
| Cell Isolation Kits | CD8+ T cell isolation kits (e.g., magnetic-activated cell sorting) | Enriches target cell population prior to sequencing | Reducing sequencing costs by focusing on CD8+ T cells specifically |
| Protein Validation | Metal isotope-tagged antibodies for CyTOF | Validation of cell type annotations at single-cell protein level | Confirming transcriptional identities of CD8+ T cell subsets [40] |
| Public Data Repositories | The Cancer Genome Atlas (TCGA) | Provides multi-omics data including genomics, epigenomics, transcriptomics, and proteomics | Accessing large-scale cancer datasets for validation [41] |
| Software Packages | TRUST4, MiXCR, scNAT, starCAT | Computational tools for TCR reconstruction and multi-omics integration | Various stages of analysis workflow [38] [39] [37] |
Workflow Diagrams
Diagram 1: Integrated scRNA-seq and scTCR-seq Analysis Workflow
Diagram 2: scNAT Deep Learning Architecture for Multi-Omics Integration
The integration of scRNA-seq with paired TCR repertoire analysis represents a transformative approach for deconstructing the complexity of CD8+ T cell biology. As methodologies continue to advance, several emerging trends promise to further enhance this field. The development of more accurate and efficient TCR reconstruction algorithms will improve data quality from existing scRNA-seq datasets, while deep learning integration methods like scNAT and annotation frameworks like starCAT will enable more nuanced characterization of T cell states across development, health, and disease [38] [37] [39]. Future efforts will likely focus on standardizing analysis pipelines, improving the scalability of integration methods to accommodate ever-growing dataset sizes, and incorporating additional data modalities such as epigenomic and spatial information. As these multi-omics approaches become more accessible and robust, they will undoubtedly accelerate both fundamental immunology research and the development of novel T cell-based therapeutics.
The construction of single-cell RNA sequencing (scRNA-seq) T cell atlases represents a transformative advancement in immunology, providing unprecedented resolution for deciphering the complexity of the adaptive immune system. This whitepaper details how these comprehensive maps of T cell populations, particularly human CD8+ T cells, are being leveraged to identify disease-specific transcriptional states and clonal dynamics in pathology. By integrating transcriptomic data with paired T cell receptor (TCR) sequencing, researchers can now simultaneously capture a cell's functional state and clonal identity, revealing how specific T cell expansions contribute to disease progression in cancer, autoimmunity, and other disorders. This technical guide explores the experimental frameworks, computational methodologies, and therapeutic applications of T cell atlases, providing researchers and drug development professionals with the tools to translate cellular cartography into mechanistic insights and therapeutic opportunities.
Single-cell RNA sequencing technologies have revolutionized our ability to profile the immune system at unprecedented resolution, enabling the construction of detailed T cell atlases that catalog cellular diversity across tissues, developmental stages, and disease conditions [42]. These atlases provide reference maps of the adaptive immune system at single-cell resolution, capturing cellular diversity, functional states, and spatial dynamics [42]. For CD8+ T cells specifically, which play fundamental roles in solid tumour progression and inflammation, understanding their phenotypic heterogeneity across diverse conditions could help unify our understanding of disease mechanisms [32].
The functional capacity of scRNA-seq to profile both the transcriptome and TCR repertoire of individual T cells simultaneously has opened new frontiers in immunology research [36] [43]. This multi-modal approach allows researchers to connect transcriptional states with clonal lineage information, providing insights into how specific T cell expansions contribute to pathological processes. As technological advances continue to improve throughput, reduce costs, and enhance computational integration, T cell atlases are increasingly becoming indispensable resources for decoding disease mechanisms, identifying therapeutic targets, and advancing personalized treatments [42].
Methodological Framework: From Single-Cell Data to Biological Insight
Experimental Design and Workflow
The generation of a T cell atlas begins with careful experimental design and sample preparation. A standardized experimental protocol for tissue dissociation, single-cell suspension generation, and scRNA-seq library construction is crucial to minimize technical variability [44]. For T cell studies, magnetic separation using monoclonal antibodies against T cell surface markers (e.g., anti-CD3ε) is commonly employed to enrich target populations [43].
A critical consideration in experimental design is whether to use single-cell RNA sequencing (scRNA-seq) or single-nucleus RNA sequencing (snRNA-seq). While scRNA-seq captures the full transcriptome of intact cells, snRNA-seq is particularly valuable for tissues that are difficult to dissociate or when working with frozen samples, as it minimizes artificial transcriptional stress responses that can occur during tissue dissociation [45]. However, snRNA-seq only captures nuclear transcripts and might miss important biological processes related to mRNA processing and metabolism [45].
Following single-cell isolation, libraries are prepared using high-throughput methods such as droplet-based systems (e.g., 10x Genomics) that enable the parallel processing of thousands of cells [45]. The incorporation of unique molecular identifiers (UMIs) during reverse transcription is essential for accurate quantification, as they correct for PCR amplification biases by tagging each individual mRNA molecule [45].
Table 1: Key Experimental Considerations in T Cell Atlas Generation
| Experimental Step | Considerations | Recommendations |
|---|---|---|
| Tissue Dissociation | Can induce artificial stress responses | Perform at 4°C rather than 37°C; consider snRNA-seq for sensitive tissues |
| Cell Enrichment | May introduce biases in population representation | Use mild enrichment protocols; document potential biases in analysis |
| Library Preparation | Throughput vs. depth trade-offs | Select method based on research question; always incorporate UMIs |
| Multi-modal Sequencing | Coordinating transcriptome and TCR data | Use commercial solutions that support paired sequencing |
Computational and Analytical Approaches
The analysis of scRNA-seq data involves multiple computational steps, each with specific considerations for T cell biology:
Quality Control and Preprocessing: Initial quality control removes low-quality cells, doublets, and cells with high mitochondrial content (indicating apoptosis or poor cell state) [44] [46]. For T cell studies, special attention should be paid to ensuring genuine absence of CD4 and CD8 expression in double-negative T cells rather than technical artifacts [43].
Cell Type Identification and Annotation: T cells are identified using canonical markers (CD3D, CD3E, CD3G) and further subclustered based on subtype-specific markers (CD4, CD8A, CD8B) [44] [46]. Unsupervised clustering followed by marker-based annotation reveals T cell heterogeneity, including rare populations like double-negative T cells that may be expanded in disease states [43].
TCR Reconstruction and Clonal Tracking: Tools for TCR sequence reconstruction from scRNA-seq data enable the pairing of clonal information with transcriptional states [43]. This allows researchers to track how specific clones expand, contract, or evolve during disease progression or treatment.
Integration and Batch Correction: When combining datasets from multiple samples, patients, or studies, integration methods must be employed to remove technical variability while preserving biological signals. Methods like SCTransform for dataset integration [43] or specialized deep learning frameworks like scAtlasVAE can effectively integrate millions of cells across studies while mitigating batch effects [32].
SC RNA-seq Workflow: From Samples to Biological Insight
Advanced Integrative Frameworks
The scAtlasVAE framework represents a significant advancement in T cell atlas construction, using a variational autoencoder (VAE)-based method with a batch-invariant encoder to integrate single-cell RNA-sequencing data across studies [32]. This approach successfully integrated over 1.1 million CD8+ T cells from 68 studies into a unified atlas with both transcriptome and paired TCR information, enabling systematic exploration of clonal dynamics and transcriptomic states across different studies and conditions [32]. The framework defined 18 CD8+ T cell subtypes that exist in various disease conditions and illustrated their diversity and clonal expansion level in the TCR repertoire [32].
Applications in Disease Research
Cancer Immunology and Tumor Microenvironment
In cancer research, T cell atlases have revealed profound insights into the tumor microenvironment (TME) and mechanisms of immune evasion. Studies comparing primary and metastatic ER+ breast cancer using scRNA-seq have identified specific subtypes of stromal and immune cells critical to forming a pro-tumor microenvironment in metastatic lesions, including CCL2+ macrophages, exhausted cytotoxic T cells, and FOXP3+ regulatory T cells [44].
Analysis of cell-cell communication in breast cancer highlights a marked decrease in tumor-immune cell interactions in metastatic tissues, likely contributing to an immunosuppressive microenvironment [44]. In contrast, primary breast cancer samples display increased activation of the TNF-α signaling pathway via NF-κB, indicating a potential therapeutic target [44].
In mantle cell lymphoma (MCL), integrated single-cell RNA and B cell receptor sequencing with whole-genome sequencing has revealed significant intratumor heterogeneity already present at diagnosis [47]. Tracking clonal evolution between primary and relapsed tumors showed that minor clones present at diagnosis may acquire different mutations and copy-number variations and/or migrate to various microenvironments, driving disease progression and relapse [47].
Table 2: T Cell States Identified in Cancer Studies
| Cancer Type | Dysregulated T Cell Populations | Functional Significance |
|---|---|---|
| ER+ Breast Cancer | Exhausted cytotoxic T cells | Immunosuppressive TME in metastases |
| ER+ Breast Cancer | FOXP3+ regulatory T cells | Immune tolerance in metastases |
| Mantle Cell Lymphoma | Evolving tumor-specific clones | Disease progression and relapse |
| Multiple Solid Tumors | GZMK+ and ITGAE+ exhausted T cells | Distinct exhausted T cell subtypes with divergent clonal relationships |
Autoimmune and Inflammatory Disorders
In type 1 diabetes (T1D) research, scRNA-seq of T cells from Non-Obese Diabetic (NOD) mice has revealed disease-specific CD8+ T cell clonal expansion and a high frequency of transcriptionally distinct double-negative (DN) T cells [36] [43]. These DN T cells, which lack expression of either CD4 or CD8, were found at uncharacteristically high rates (~33%) in all tissues and fluctuated throughout T1D pathogenesis [43].
Longitudinal tracking of T cells in peripheral blood and pancreatic islets of NOD mice detected disease-dependent development of infiltrating CD8+ T cells with altered cytotoxic and inflammatory effector states [36]. This study identified potential disease-relevant TCR sequences and biomarkers that can be further characterized for diagnostic or therapeutic applications [36].
In primary open-angle glaucoma (POAG), scRNA-seq of ~1.4 million peripheral blood mononuclear cells from 110 patients and 110 controls revealed significant immune remodeling, characterized by impaired cytolytic potential with reduced proportions of terminally differentiated CD8+ GZMK+ T cells and NK cells [46]. Transcriptomic analysis revealed a sophisticated dual landscape where both proinflammatory and neuroprotective signaling pathways coexist across multiple immune cell lineages [46].
Genetic Mechanism Discovery Using T Cell Atlases
Genetic Mechanism Discovery
T cell atlases enable the mapping of cell type-specific expression quantitative trait loci (eQTLs), linking genetic variation to context-dependent gene regulation in specific immune cell types [46]. In POAG research, cell type-specific eQTL mapping and summary-data Mendelian randomization (SMR) analysis revealed that genetic risk loci exert their effects through immune gene regulation in specific PBMC subsets [46].
This integrative approach demonstrates how disease-relevant genetic influences may only be detectable in the appropriate cellular context or activation state, highlighting the importance of cell type-resolution analyses for understanding disease mechanisms [46].
The Scientist's Toolkit: Essential Research Reagents and Solutions
Table 3: Key Research Reagent Solutions for T Cell Atlas Studies
| Reagent/Solution | Function | Application Notes |
|---|---|---|
| Anti-CD3 Magnetic Beads | T cell enrichment from heterogeneous samples | Enables isolation of T cells from PBMCs or tissues; critical for reducing sequencing costs on target population |
| Unique Molecular Identifiers (UMIs) | Barcodes for individual mRNA molecules | Essential for accurate quantification; corrects for PCR amplification biases |
| V(D)J Enrichment Kits | TCR sequence capture | Enables paired transcriptome and TCR profiling; commercial solutions available from 10x Genomics |
| Viability Stains | Distinguish live/dead cells | Critical for ensuring high-quality data; dead cells significantly impact data quality |
| Cell Hashing Antibodies | Sample multiplexing | Allows pooling of multiple samples; reduces batch effects and costs |
| Single-Cell Library Prep Kits | Library construction | Commercial solutions (10x Genomics, Parse Biosciences) differ in throughput and cost |
| Feature Barcoding Kits | Surface protein detection | Adds protein expression data to transcriptomic information; CITE-seq approaches |
T cell atlases represent a paradigm shift in how researchers investigate the adaptive immune system in health and disease. By providing single-cell resolution maps of T cell populations, these resources enable the identification of disease-specific states and clonal dynamics that were previously obscured in bulk analyses. The integration of transcriptomic data with paired TCR sequencing has been particularly powerful, revealing how specific T cell expansions contribute to pathological processes in cancer, autoimmunity, and other disorders.
As atlas construction methodologies continue to mature, several frontiers promise to further enhance their utility. Spatial transcriptomics technologies are beginning to incorporate T cell localization within tissues, adding crucial context to cellular states [42]. Multi-omic approaches that simultaneously profile the epigenome, proteome, and transcriptome of single cells will provide more comprehensive views of T cell regulation and function [42]. Additionally, as atlases become more comprehensive across tissues, diseases, and demographic groups, they will enable increasingly powerful comparative analyses that reveal fundamental principles of T cell biology.
For drug development professionals, T cell atlases offer exciting opportunities for target identification, patient stratification, and therapeutic monitoring. The identification of disease-specific T cell states and expanded clones provides a roadmap for developing more precise immunotherapies that modulate specific immune populations. Furthermore, as single-cell technologies become more accessible and cost-effective, T cell atlas approaches may eventually transition into clinical tools for diagnostic and prognostic applications.
The journey from atlas to insight is well underway, with single-cell technologies providing an increasingly powerful microscope through which to view the complex landscape of T cell biology. As these tools continue to evolve and datasets expand, T cell atlases will undoubtedly yield deeper insights into disease mechanisms and new opportunities for therapeutic intervention.
Overcoming Annotation Challenges: Best Practices for Consistent T Cell Phenotyping
Single-cell RNA sequencing (scRNA-seq) has revolutionized our ability to dissect cellular heterogeneity, playing a particularly transformative role in immunology by revealing novel immune cell subpopulations and their dynamic functions [48]. For heterogenous populations like T cells, especially human CD8+ T cells, scRNA-seq can discern cellular subtypes critical for understanding immune responses in cancer, inflammation, and infectious diseases [48] [5]. A crucial and challenging step in this analysis is cell annotation—the process of labeling individual cells with their correct cellular phenotype.
The initial manual annotation of cells, which relies on clustering and expert interpretation of differentially expressed genes, is time-intensive, subjective, and hampered by technical issues like gene dropout [48]. This has spurred the development of automated annotation tools that leverage machine learning to provide consistent, scalable, and accurate cell typing. These methods generally fall into three categories: supervised, unsupervised, and semi-supervised approaches, each with distinct advantages and limitations.
This technical guide provides an in-depth analysis of these annotation strategies, framed within the context of constructing a human CD8+ T cell atlas. We compare the core methodologies, present quantitative performance data, outline experimental protocols, and visualize computational workflows to equip researchers with the knowledge to select and implement the optimal annotation tool for their specific research goals.
Annotation Paradigms: A Comparative Analysis
Automated annotation tools leverage machine learning to classify cells based on gene expression profiles. The choice of strategy often depends on the availability of pre-existing labeled data and the specific research objectives, such as the need to discover novel cell states. The table below summarizes the core characteristics of each paradigm.
Table 1: Core Paradigms for scRNA-seq Cell Annotation
| Annotation Paradigm | Underlying Principle | Key Examples | Advantages | Limitations |
|---|---|---|---|---|
| Supervised | Classifies cells using models trained on well-annotated reference datasets. | SingleR [48], CellTypist [48], Garnett [49] | Standardizes annotations across studies; requires minimal prior knowledge from user. | Cannot identify novel cell types absent from the reference; performance depends on reference quality and similarity to query data [48]. |
| Unsupervised | Groups cells based on transcriptional similarity without prior knowledge. | Seurat Clustering [48], PCA [50], cNMF [39] | Objective discovery of novel cell states and populations without bias from existing labels. | Results may not align with biologically meaningful phenotypes; requires manual expert annotation post-clustering [51] [48]. |
| Semi-Supervised | Integrates limited labeled data with unlabeled data to guide clustering and annotation. | scSemiAAE [51], scAnCluster [49], ItClust [51] [49], T-CellAnnoTator (TCAT) [39] | Balances discovery of novel types with accurate labeling of known types; improves latent space learning with limited labels [51] [49]. | Model performance can be sensitive to the quality and quantity of the initial labels [51]. |
Quantitative Comparison of Annotation Tools
The performance of annotation tools can be evaluated based on their accuracy, scalability, and ability to handle complex datasets. The following table synthesizes key quantitative findings from recent studies and tool implementations.
Table 2: Performance and Application of scRNA-seq Annotation Tools
| Tool | Classification Paradigm | Reported Performance / Application | Key Experimental Findings |
|---|---|---|---|
| T-CellAnnoTator (TCAT) | Semi-supervised (Program-based) | Identified 46 reproducible gene expression programs (cGEPs) from 1.7 million T cells across 38 tissues and 5 diseases [39]. | cGEPs predicted response to immune checkpoint inhibitors across multiple tumor types. Outperformed de novo cNMF in small query datasets [39]. |
| scAtlasVAE | Supervised / Reference-based | Integrated over 1.1 million CD8+ T cells from 68 studies into a unified atlas. Defined 18 CD8+ T cell subtypes [32] [5]. | Revealed exhausted T (Tex) cell subtypes (e.g., GZMK+, ITGAE+) enriched in distinct cancers and showed clonal relationships with tissue-resident T cells [32] [5]. |
| scSemiAAE | Semi-supervised | Outperformed dozens of unsupervised and semi-supervised algorithms across multiple scRNA-seq datasets [51]. | The integration of adversarial training and semi-supervised modules in the latent space significantly improved clustering accuracy and interpretability [51]. |
| scAnCluster | Semi-supervised | Demonstrated strong performance on both simulation and real data, excelling at discovering novel cell types absent from the reference data [49]. | Effectively integrates supervised, self-supervised, and unsupervised learning to balance label information with the unique structure of the target dataset [49]. |
| scBubbletree | Unsupervised (Visualization) | Successfully visualized a scRNA-seq dataset containing over 1.2 million cells, avoiding overplotting issues common in scatterplots [50]. | Provides quantitative visuals of cluster properties and relationships, facilitating biological interpretation of large-scale data [50]. |
Experimental Protocols for Key Tools
Protocol for T-CellAnnoTator (TCAT)
Objective: To annotate T cell states in a query dataset using a predefined catalog of gene expression programs (GEPs).
- Input Data Preparation: Provide a preprocessed (quality-controlled, normalized) scRNA-seq count matrix of the query T cells.
- GEP Usage Inference: Use the
starCATfunction (orTCATfor T cells) to perform nonnegative least squares regression. This quantifies the activity (usage) of each of the 46 predefined consensus GEPs (cGEPs) in every single cell of the query data [39]. - Cell Feature Prediction: Leverage the computed GEP usages to predict additional cell features, such as:
- Lineage: Assign broad T cell subsets (e.g., CD4+, CD8+, Treg) based on the dominant subset-specific cGEPs (e.g., FOXP3 for Tregs) [39].
- Activation State: Identify cells in specific functional states like cytotoxicity (high cytotoxicity cGEP usage), exhaustion (high HAVCR2, LAG3 cGEP usage), or proliferation [39].
- TCR Activation: Infer antigen-specific activation states based on characteristic GEP combinations [39].
- Validation: Correlate the predicted states with known marker genes from the literature not used in the cGEP definition. If available, validate predictions using paired CITE-seq surface protein data [39].
Protocol for scAtlasVAE
Objective: To project a query CD8+ T cell dataset onto a unified reference atlas for automatic subtype annotation and clonal analysis.
- Model Loading: Access the pre-trained scAtlasVAE model, which includes a batch-invariant encoder and a batch-dependent decoder, integrated with a comprehensive CD8+ T cell atlas [32] [5].
- Data Encoding: Encode the query dataset's gene expression data using the batch-invariant encoder. This step projects the query cells into the same latent space as the reference atlas, mitigating technical batch effects [32].
- Subtype Annotation: Transfer cell subtype labels from the reference atlas to the query cells based on their proximity in the shared latent space. The model can automatically annotate the 18 defined CD8+ T cell subtypes, such as GZMK+ and ITGAE+ exhausted T cells [32] [5].
- Clonal Analysis (if data is available): For query data with paired T-cell receptor (TCR) information, analyze clonal expansion and sharing patterns within and between the annotated subtypes to infer T cell state transitions and lineage relationships [5].
Protocol for scSemiAAE
Objective: To perform semi-supervised clustering on an scRNA-seq dataset using a small set of pre-existing labels.
- Data Preprocessing: Normalize the raw count matrix and scale the data using standard pipelines (e.g., SCANPY in Python). Corrupt the processed matrix with random Gaussian noise for denoising [51].
- Model Training: Train the scSemiAAE model, which integrates three modules:
- ZINB-based Autoencoder: Maps the noisy input to a low-dimensional latent representation
Zand reconstructs the dataPto learn robust features, accounting for dropout events via a Zero-Inflated Negative Binomial (ZINB) loss [51]. - Adversarial Training: A discriminator network distinguishes between latent vectors from a prior distribution and those generated by the encoder, regularizing the latent space [51].
- Semi-Supervised Module: Introduces available cell type labels into the latent space via a cross-entropy loss, guiding the representation learning [51].
- ZINB-based Autoencoder: Maps the noisy input to a low-dimensional latent representation
- Clustering and Annotation: Perform clustering (e.g., k-means) on the learned latent representation
Z. The model uses the limited label information to improve cluster separation, facilitating the annotation of both known and novel cell types [51].
Workflow Visualization of Annotation Tools
TCAT / starCAT Workflow
Semi-supervised Clustering (scSemiAAE) Workflow
Reference-based Integration (scAtlasVAE) Workflow
The Scientist's Toolkit: Essential Research Reagents and Computational Solutions
Successful execution of single-cell annotation projects relies on a suite of computational tools and curated resources. The table below details key items essential for research in this field.
Table 3: Essential Research Reagents and Computational Solutions
| Item Name | Type | Function / Application | Key Features |
|---|---|---|---|
| Predefined cGEP Catalog | Computational Resource | A fixed set of 46 gene expression programs for annotating T cell states and functions [39]. | Enables reproducible, cross-dataset comparison of T cell activation, exhaustion, and subset-specific states. |
| Human CD8+ T Cell Atlas (via scAtlasVAE) | Reference Atlas | A unified atlas of over 1.1 million CD8+ T cells from 68 studies for reference-based annotation [32] [5]. | Provides a standardized framework for annotating CD8+ T cell subtypes and analyzing their TCR clonal dynamics. |
| Seurat / Scanpy | Software Package | Comprehensive toolkits for the primary preprocessing, analysis, and visualization of scRNA-seq data [48] [50]. | Provides the foundational environment for data QC, normalization, dimensionality reduction, and initial clustering. |
| Harmony | Algorithm | Batch effect correction tool adapted for integration with nonnegative matrix factorization in pipelines like TCAT [39]. | Corrects for technical variations between datasets, enabling the learning of biologically consistent GEPs. |
| ZINB Model | Statistical Model | Models the distribution of scRNA-seq count data, accounting for over-dispersion and dropout events [51] [49]. | Critical for accurate data reconstruction and denoising in deep learning models like scSemiAAE and scAnCluster. |
Resolving Batch Effects and Technical Variation in Cross-Study Integrations
The integration of multiple single-cell RNA sequencing (scRNA-seq) datasets has become a standard approach in computational biology, enabling cross-condition comparisons, population-level analysis, and the revelation of evolutionary relationships between cell types [52] [53]. However, the reliability of integrated scRNA-seq data is frequently compromised by batch effects—systematic non-biological variations that arise from differences in sample processing, sequencing platforms, laboratory conditions, and experimental protocols [54] [55]. These technical artifacts can be similar in magnitude or even exceed biologically relevant signals, potentially leading to false discoveries and misinterpretations [56] [54].
The challenge is particularly pronounced in the study of human CD8+ T cells, where researchers increasingly rely on integrating datasets from multiple studies to construct comprehensive cell atlases [57] [16] [58]. Such atlases aim to characterize the diverse states and functional dynamics of CD8+ T cells across health, cancer, autoimmunity, and infectious diseases including SARS-CoV-2 [59] [57]. Batch effects can obscure the subtle transcriptional differences that distinguish T cell subtypes and states, complicating the identification of biologically meaningful patterns [16]. Thus, effective batch effect correction (BEC) is not merely a technical preprocessing step but a critical prerequisite for robust biological discovery in CD8+ T cell research.
The Nature and Impact of Batch Effects in CD8+ T Cell Atlas Construction
Batch effects in scRNA-seq data originate from multiple technical and biological sources. Technical sources include variations in sample collection, cell isolation techniques, library preparation protocols (e.g., 3' versus 5' end sequencing), sequencing platforms, and handling personnel [56] [55]. Biological sources can include differences in donor characteristics, sample handling times, and sample types (e.g., primary tissue versus organoids) [52] [53]. The integration of scRNA-seq and single-nuclei RNA-seq (snRNA-seq) data presents additional challenges due to fundamental differences in the molecular content captured by each protocol [52] [53].
In CD8+ T cell research, these batch effects manifest as systematic variations that can confound true biological signals of T cell activation, differentiation, and exhaustion [57] [16]. For instance, studies of tumor-infiltrating CD8+ T cells must distinguish genuine exhaustion signatures from technical artifacts when integrating data across different cancer types, research institutions, and sequencing platforms [57] [58].
Consequences for CD8+ T Cell Research
Uncorrected batch effects can severely compromise downstream analyses essential for CD8+ T cell atlas construction. These include:
- Cell Type Misidentification: Batch effects can cause similar cell types to appear distinct or distinct types to appear similar, leading to inaccurate cell type annotations [56] [16].
- Obscured Differential Expression: Biological differences in gene expression between T cell states may be masked by batch-related variations [54].
- Compromised Trajectory Inference: Pseudotemporal ordering of T cell differentiation can be distorted by technical variations [56].
- Reduced Statistical Power: Batch effects increase noise, reducing the power to detect genuine biological effects [54].
The construction of a unified CD8+ T cell atlas from over 300 ATAC-seq and RNA-seq datasets across 12 studies exemplifies these challenges. Without proper batch correction, samples clustered primarily by data source rather than biological similarity, obscuring conserved T cell states across studies [57].
Evaluating Batch Effect Correction: Metrics and Methods
Evaluation Metrics and Their Limitations
Robust evaluation of BEC methods requires metrics that assess both technical batch mixing and biological information preservation. Commonly used metrics include:
- LISI (Local Inverse Simpson's Index): Measures batch mixing within local neighborhoods of cells [52] [56].
- kBET: Tests whether local cell neighborhoods reflect the overall batch composition [56].
- NMI (Normalized Mutual Information): Assesses preservation of biological cell type information after integration [52].
However, these metrics have limitations. LISI and kBET may lose discrimination power with large batch effect sizes, and they lack sensitivity to overcorrection, where true biological variation is erroneously removed along with technical noise [56].
The RBET Framework: A Reference-Informed Approach
The RBET (Reference-informed Batch Effect Testing) framework addresses these limitations by leveraging reference genes (RGs) with stable expression patterns across conditions [56]. RBET operates on the principle that successfully integrated data should show minimal batch effects on these stable RGs. The framework involves:
- RG Selection: Identifying tissue-specific housekeeping genes or genes with stable expression within and across cell types.
- Batch Effect Detection: Mapping data to 2D space (e.g., UMAP) and using maximum adjusted chi-squared (MAC) statistics to compare batch distributions.
RBET demonstrates superior performance in detecting batch effects while maintaining sensitivity to overcorrection, robustness to large batch effect sizes, and computational efficiency compared to LISI and kBET [56]. The following table summarizes key evaluation metrics and their characteristics:
Table 1: Metrics for Evaluating Batch Effect Correction Performance
| Metric | Primary Function | Strengths | Limitations |
|---|---|---|---|
| LISI [56] | Measures batch mixing in local cell neighborhoods | Standardized range (0-1), intuitive interpretation | Reduced discrimination with large batch effects; insensitive to overcorrection |
| kBET [56] | Tests if local neighborhoods match global batch composition | Provides statistical significance testing | Poor type I error control; computationally intensive for large datasets |
| NMI [52] | Assesses biological preservation after integration | Directly measures cell type information retention | Requires ground truth cell labels; may not capture subtle biological variations |
| RBET [56] | Detects batch effects using reference genes | Sensitive to overcorrection; robust to large batch effects; computationally efficient | Requires appropriate reference gene selection |
Computational Methods for Batch Effect Correction
Established BEC Methods and Their Limitations
Multiple computational approaches have been developed to address batch effects in scRNA-seq data. These include:
- Conditional Variational Autoencoders (cVAE): Non-linear models that condition on batch covariates to correct batch effects while preserving biological variation [52] [53].
- Harmony: Iteratively corrects batch effects in low-dimensional embeddings, particularly effective for integrating datasets from different technologies and species [60] [16].
- ComBat-seq: Uses a negative binomial model and empirical Bayes framework to adjust for batch effects while preserving count data structure [54].
- Seurat: A comprehensive toolkit that includes anchor-based integration methods for scRNA-seq data [56] [16].
However, these methods struggle with "substantial batch effects" that arise when integrating datasets across fundamentally different systems, such as different species (mouse vs. human), sample types (organoids vs. primary tissue), or technologies (single-cell vs. single-nuclei RNA-seq) [52] [53]. Traditional approaches like increasing Kullback-Leibler (KL) regularization in cVAE models remove both biological and technical variation indiscriminately, while adversarial learning methods may forcibly mix unrelated cell types with unbalanced batch proportions [52].
Emerging Methods for Substantial Batch Effects
Recent advances have introduced more sophisticated approaches specifically designed for challenging integration scenarios:
sysVI (Integration of Diverse Systems with Variational Inference) combines VampPrior (multimodal variational mixture of posteriors) with cycle-consistency constraints to improve integration across systems while preserving biological signals [52] [53]. The VampPrior enhances biological preservation by providing a more flexible prior distribution, while cycle-consistency ensures that translating a cell's expression profile between batches and back again preserves its original state [52].
scAtlasVAE is a deep-learning framework for integrating large-scale scRNA-seq data with paired T cell receptor (TCR) information, enabling construction of comprehensive CD8+ T cell atlases [58]. It employs a batch-unconditional encoder and batch-conditional decoder to correct batch effects while reconstructing gene expression data using a zero-inflated negative binomial distribution [58].
ComBat-ref refines the ComBat-seq approach by selecting the batch with the smallest dispersion as a reference and adjusting other batches toward this reference, significantly improving statistical power for downstream differential expression analysis [54].
Table 2: Advanced Batch Effect Correction Methods for Challenging Integration Scenarios
| Method | Underlying Approach | Key Features | Demonstrated Applications |
|---|---|---|---|
| sysVI [52] [53] | Conditional VAE with VampPrior and cycle-consistency | Handles substantial batch effects; preserves biological variation; prevents mixing of unrelated cell types | Cross-species integration; organoid-tissue integration; single-cell vs. single-nuclei data |
| scAtlasVAE [58] | Deep learning with batch-conditional decoder | Integrates transcriptome with TCR data; supports unsupervised and supervised learning; enables cross-atlas comparison | CD8+ T cell atlas integration; identification of exhausted T cell subtypes; autoimmune and inflammation studies |
| ComBat-ref [54] | Negative binomial model with reference batch | Preserves count data structure; improves sensitivity in differential expression; handles dispersion differences | Bulk RNA-seq deconvolution; differential expression analysis with multiple batches |
| ProjecTILs [16] | Reference atlas projection | Enables embedding of new data into stable reference without altering reference structure; characterizes novel cell states | T cell state interpretation across studies and conditions; comparison of pre- vs. post-treatment T cells |
Experimental Protocols for Benchmarking BEC Methods
Standardized Benchmarking Frameworks
Rigorous evaluation of BEC methods requires standardized benchmarking protocols that simulate realistic biological scenarios with known ground truth. A comprehensive benchmarking framework should include:
Data Simulation: Generating synthetic scRNA-seq data with controlled batch effects and biological variation using tools like the polyester R package [54]. Key parameters include:
- Batch effect size (mean_FC): Factor altering gene expression in affected batches
- Dispersion factor (disp_FC): Factor increasing dispersion in affected batches
- Number of differentially expressed genes with known fold changes
Performance Assessment: Evaluating methods using multiple metrics including:
- True Positive Rate (TPR): Proportion of true differentially expressed genes correctly identified
- False Positive Rate (FPR): Proportion of non-differentially expressed genes incorrectly flagged
- Batch mixing scores (e.g., LISI, RBET)
- Biological preservation scores (e.g., NMI, clustering accuracy)
Real Data Validation: Applying BEC methods to curated datasets with known biological ground truth, such as:
Workflow for Method Selection and Application
The following experimental workflow guides researchers in selecting and applying appropriate BEC methods for CD8+ T cell atlas construction:
Diagram Title: BEC Method Selection Workflow
Computational Tools and Packages
Table 3: Essential Computational Tools for CD8+ T Cell Atlas Integration
| Tool/Package | Primary Function | Application Context | Key Features |
|---|---|---|---|
| sysVI [52] [53] | Integration of datasets with substantial batch effects | Cross-system integration (species, protocols, sample types) | VampPrior + cycle-consistency; preserves biological signals; prevents cell type mixing |
| scAtlasVAE [58] | Deep learning-based integration of CD8+ T cell datasets | Large-scale CD8+ T cell atlas construction | Incorporates TCR data; identifies exhausted T cell subtypes; supports transfer learning |
| ProjecTILs [16] | Projection of new data into reference T cell atlases | Interpretation of T cell states across studies and conditions | Preserves reference structure; characterizes novel cell states; interactive visualization |
| Harmony [60] [16] | Dataset integration with batch effect correction | General scRNA-seq integration; multi-species integration | Iterative correction; efficient scaling; preserves biological variation |
| RBET [56] | Evaluation of batch correction performance | Assessment of integration quality with overcorrection awareness | Reference gene-based; sensitive to overcorrection; computationally efficient |
Reference Datasets and Atlases
For CD8+ T cell research, several curated reference atlases provide essential benchmarks for method development and validation:
- Unified CD8+ T Cell Atlas: Integrates over 300 ATAC-seq and RNA-seq datasets from 12 studies of CD8+ T cells in cancer and infection, revealing a shared differentiation trajectory toward dysfunction [57].
- Cross-Study TIL Atlas: Combines scRNA-seq data from 21 melanoma and colon adenocarcinoma tumors, identifying nine broad T cell subtypes with distinct phenotypes and functions [16].
- Human CD8+ T Cell Atlas with TCR: Incorporates data from 68 studies, 961 samples, and over 1.1 million cells across 42 conditions, clustering CD8+ T cells into 18 subtypes [58].
The integration of cross-study scRNA-seq datasets is essential for constructing comprehensive CD8+ T cell atlases that capture the full heterogeneity of T cell states across biological contexts. While batch effects present significant challenges, emerging computational methods like sysVI, scAtlasVAE, and ComBat-ref offer promising solutions for handling even substantial technical variations [52] [58] [54].
Evaluation remains a critical component of successful integration, with RBET providing a robust framework for assessing correction quality while guarding against overcorrection [56]. As single-cell technologies continue to evolve, generating increasingly complex multimodal data, batch correction methods must likewise advance to handle integrated analysis of transcriptomics, epigenomics, proteomics, and TCR information [59] [58].
The future of CD8+ T cell atlas construction will likely involve increasingly sophisticated deep learning approaches that can simultaneously integrate data across modalities, technologies, and species while preserving subtle but biologically meaningful variations. Such advances will empower researchers to unravel the complexities of T cell biology across health and disease, ultimately accelerating the development of novel immunotherapies and precision medicine approaches.
The construction of a single-cell RNA sequencing (scRNA-seq) T cell atlas represents a transformative approach in immunology, enabling the systematic cataloging of cellular heterogeneity within the adaptive immune system. In the specific context of human CD8+ T cell research, these atlases capture remarkable phenotypic diversity across inflammation, cancer, and aging [5] [19] [42]. However, the full potential of these resources hinges on a critical computational step: accurate cell annotation. This process of assigning identity labels to individual cells based on their gene expression profiles becomes particularly challenging when delineating closely related CD8+ T cell subpopulations, such as exhausted T cell subsets in cancer, memory T cell subtypes, or age-associated T cell populations [5] [19]. The inherent technical noise, high dimensionality, and sparsity of scRNA-seq data, combined with the continuous nature of T cell differentiation, create a complex computational landscape where annotation strategies must balance biological fidelity with technical robustness [48] [42].
This technical guide examines the current benchmarking efforts to identify optimal annotation strategies for precise characterization of CD8+ T cell subpopulations within human atlas-level studies. We synthesize performance metrics across computational tools, provide detailed experimental protocols for validation, and outline a structured framework for method selection tailored to the specific challenges of T cell immunology. As single-cell atlases continue to expand in scale and complexity—with recent efforts encompassing over 1.2 million cells [61]—the development of standardized, accurate, and reproducible annotation pipelines becomes increasingly critical for reliable biological discovery and therapeutic development.
Computational Annotation Landscape: Strategies and Mechanisms
The field of automated cell annotation has rapidly evolved from manual cluster annotation to diverse computational approaches leveraging sophisticated machine-learning frameworks. Understanding the fundamental mechanisms underlying these strategies is essential for informed method selection and interpretation of results.
Table 1: Classification of Single-Cell Annotation Strategies
| Category | Mechanism | Representative Tools | Advantages | Limitations |
|---|---|---|---|---|
| Reference-Based/Label Transfer | Projects query data onto an annotated reference atlas | Azimuth, Symphony, scArches [48] | Leverages existing annotations; promotes consistency | Fails when query contains novel cell states not in reference |
| Gene Set-Based Classification | Uses pre-trained classifiers on marker gene sets | CellTypist, clustifyr [48] | Harmonizes cell definitions across studies; requires minimal expertise | Less transparent; performance depends on training data similarity |
| Marker Gene-Based | Maps cells using small sets of canonical markers | Garnett [48] | Highly interpretable; simple implementation | Vulnerable to batch effects; limited by completeness of marker knowledge |
| Gating-Based | Emulates flow cytometry gating strategies hierarchically | scGate, ProjectTILs [48] | Transparent and customizable; handles sparsity via kNN smoothing | Requires substantial prior knowledge to define gating models |
| Unsupervised Clustering | Groups cells by expression similarity without labels | Seurat Clustering [48] | Objective; enables novel cell state discovery | Requires manual annotation; subjective interpretation |
The selection of an appropriate annotation strategy depends heavily on the specific biological question and data characteristics. Reference-based methods excel when comprehensive, well-annotated atlases exist for the tissue and cell types of interest, enabling standardized annotation across studies [48]. For discovering novel cell states or working with model organisms lacking reference atlases, unsupervised approaches or gating-based methods with custom markers may be more appropriate. Gene set-based classification offers a balance between automation and accuracy but depends critically on the quality and relevance of the training data [48].
Benchmarking Performance: Quantitative Metrics and Outcomes
Rigorous benchmarking of annotation tools requires comprehensive evaluation frameworks that assess both technical integration quality and biological conservation. The single-cell Integration Benchmarking (scIB) framework employs multiple metrics across categories including batch effect removal, label conservation, and label-free conservation of biological variation [61]. These metrics include k-nearest-neighbor batch effect test (kBET), average silhouette width (ASW), graph connectivity, adjusted Rand index (ARI), normalized mutual information (NMI), and trajectory conservation scores [61].
Table 2: Benchmarking Performance of Selected Integration and Annotation Methods
| Method | Batch Effect Removal (kBET) | Bio-Conservation (ARI) | Trajectory Conservation | Scalability (>1M cells) | Recommended Use Case |
|---|---|---|---|---|---|
| scANVI | High | High | High | Moderate | Annotation when partial labels are available |
| Scanorama | High | High | High | High | Large-scale atlas integration |
| scVI | High | High | Moderate | High | Scalable probabilistic modeling |
| Harmony | Moderate | Moderate | Moderate | High | Simple batch effect correction |
| SingleR | N/A | High | N/A | Moderate | Rapid annotation using reference data |
| CellTypist | N/A | High | N/A | High | Automated annotation with model database |
Recent benchmarking studies evaluating method performance on complex integration tasks have revealed that highly variable gene selection improves performance across most integration methods, while scaling procedures can push methods to prioritize batch removal over conservation of biological variation [61]. On complex atlas-level tasks, methods including scANVI, Scanorama, and scVI consistently perform well, particularly for conserving subtle biological variation such as T cell exhaustion trajectories or memory T cell differentiation pathways [61]. For the specific challenge of annotating closely related CD8+ T cell subsets, methods that conserve continuous biological trajectories while effectively removing batch effects are particularly valuable.
The K-Neighbors Intersection (KNI) score has emerged as a unified metric that combines batch effect correction (kBET) with cross-dataset cell-type prediction accuracy, providing a single score that evaluates both technical integration and biological fidelity [62]. Using this metric, studies have demonstrated that adversarial training approaches such as Batch Adversarial single-cell Variational Inference (BA-scVI) outperform other methods in large-scale integration tasks relevant to organism-wide cell atlas construction [62].
Experimental Protocols for Validation Studies
Sample Processing and Data Generation Protocol
Comprehensive benchmarking requires standardized processing of T cells from multiple tissues and conditions. The following protocol, adapted from the Human Cell Atlas study on human T cell tissue and activation signatures, provides a robust framework for generating validation data [63]:
Sample Collection and Processing: Isolate T cells from multiple human tissues (blood, lymph nodes, lung, bone marrow) using magnetic enrichment with anti-CD3/CD28 beads or fluorescence-activated cell sorting (FACS) for specific subsets. Preserve cells in appropriate buffer for single-cell processing [63].
Single-Cell Library Preparation: Use 10x Genomics 3' v2 single-cell RNA sequencing according to manufacturer's protocol. Include feature barcoding for surface protein expression when possible. For paired TCR sequencing, simultaneously prepare TCR amplification libraries using 10x V(D)J reagents [63].
Sequencing and Initial Processing: Sequence libraries on Illumina platforms to a target depth of 50,000 reads per cell. Process raw data through Cell Ranger (10x Genomics) pipeline with standard parameters to generate gene expression matrices and TCR contig files [63].
Data Integration for Benchmarking: For method evaluation, integrate datasets from multiple tissues, conditions, and donors to create a benchmarking dataset with known ground truth labels derived from expert annotation. This integrated dataset serves as the validation resource for comparing annotation strategies [63].
Benchmarking Experimental Design
To evaluate annotation accuracy for closely related CD8+ T cell subpopulations, implement a standardized benchmarking workflow:
Data Compilation: Curate a gold-standard dataset with expert-annotated CD8+ T cell subsets, including exhausted, memory, effector, and naive populations. The dataset should include cells from multiple donors and conditions to assess robustness [5] [19].
Method Application: Apply each annotation tool to the benchmark dataset using recommended parameters. For reference-based methods, use a leave-one-dataset-out cross-validation approach to simulate real-world performance on novel data [48] [61].
Metric Calculation: Compute comprehensive evaluation metrics including accuracy, precision, recall, and F1-score for each cell subtype. Calculate integration-specific metrics such as kBET, ASW, and ARI to assess both technical and biological performance [61].
Statistical Analysis: Perform comparative statistical testing between methods using repeated measures ANOVA or paired t-tests with appropriate multiple testing correction. Assess consistency across multiple random seeds and parameter variations [61] [62].
Figure 1: Experimental Workflow for Annotation Benchmarking
Essential Research Reagents and Computational Tools
Table 3: Essential Research Reagent Solutions for T Cell Atlas Studies
| Reagent/Tool | Function | Application in CD8+ T Cell Research |
|---|---|---|
| 10x Genomics Single Cell Immune Profiling | Simultaneous gene expression and V(D)J sequencing | Paired transcriptome and TCR analysis of CD8+ T cell clones [63] |
| Feature Barcoding Antibodies | Multiplexed protein surface marker detection | Validation of CD8+ T cell subtypes (CD45RA, CD45RO, PD-1) [19] |
| Cell Hashing Multiplexing | Sample multiplexing and doublet detection | Increased throughput while reducing batch effects in multi-donor studies [42] |
| scAtlasVAE | Deep learning model for atlas integration | Mapping CD8+ T cell exhaustion subtypes across cancer datasets [5] |
| CellTypist | Automated cell type annotation | Rapid annotation of CD8+ T cell subsets using model database [48] |
| Scanorama | Scalable data integration | Assembling large-scale CD8+ T cell atlases from multiple studies [61] |
Implementation Framework: A Step-by-Step Guide
Method Selection and Application
Implementing an optimal annotation strategy requires a systematic approach tailored to the specific research context and available resources. The following step-by-step guide provides a structured framework for annotation of CD8+ T cell subpopulations:
Data Quality Control and Preprocessing: Perform rigorous quality control using Scater or Seurat to remove low-quality cells based on mitochondrial percentage, detected features, and counts. Normalize data using SCTransform or scran, and select highly variable genes to reduce dimensionality [48] [42].
Preliminary Clustering and Annotation: Conduct initial clustering using Leiden or Louvain algorithms on PCA-reduced data (Seurat) or graph-based representations (Scanpy). Perform differential expression analysis to identify marker genes for each cluster and assign preliminary cell type labels based on established CD8+ T cell markers [48].
Reference-Based Annotation Transfer: For datasets with comprehensive reference atlases available (e.g., human immune cell atlas), project query data onto the reference using Seurat's anchor-based integration or Symphony's reference mapping. Transfer labels from reference to query cells with confidence scores [48] [62].
Automated Classification: Apply automated tools such as CellTypist or SingleR using pre-trained models or reference datasets. For CD8+ T cell-specific annotation, consider building custom classification models using tools like SCINA or scGate with established CD8+ T cell marker genes [48].
Integration and Batch Correction: For multi-dataset studies, apply integration methods such as Harmony, Scanorama, or scVI to remove technical batch effects while preserving biological variation. Validate that known CD8+ T cell biological gradients (e.g., exhaustion, memory differentiation) are maintained post-integration [61].
Expert Validation and Refinement: Manually inspect annotation results by visualizing marker gene expression and assessing cluster purity. Refine annotations by subclustering ambiguous populations and re-analyzing with increased resolution [48].
Figure 2: Annotation Strategy Selection Logic
Validation and Quality Assurance
Robust validation is essential for ensuring annotation accuracy, particularly for closely related CD8+ T cell subpopulations. Implement a multi-faceted validation strategy:
Cross-Validation Using Holdout Datasets: Evaluate annotation accuracy by holding out entire datasets or donors from the training process and assessing performance on unseen data. This approach tests generalizability across experimental conditions [62].
Biological Concordance Assessment: Verify that annotation results align with established biological knowledge of CD8+ T cell biology, including expected marker gene expression, proportional relationships between subsets, and functional capacities [19] [42].
Multi-Modal Validation: Where available, leverage paired protein expression data (CITE-seq), TCR sequences, or chromatin accessibility (multiome) to validate transcriptomically-defined populations through independent molecular modalities [42].
Functional Validation: For critical or novel populations, validate functional characteristics through in vitro or in vivo assays. For example, sort annotated populations and assess cytokine production, proliferation capacity, or cytotoxic function to confirm biological identity [21].
Accurate annotation of closely related CD8+ T cell subpopulations in single-cell atlas studies requires careful method selection informed by comprehensive benchmarking. The current evidence supports a hybrid approach combining reference-based annotation with expert validation, utilizing tools such as Scanorama or scVI for data integration and CellTypist or scANVI for automated labeling [48] [61]. As the field progresses toward foundational models for single-cell data analysis [62], we anticipate increased standardization and accuracy in cell annotation.
The development of CD8+ T cell-specific annotation frameworks incorporating TCR sequence information, epigenetic states, and spatial localization will further enhance our ability to resolve subtle but biologically significant T cell states in health and disease. By implementing the benchmarking strategies and best practices outlined in this technical guide, researchers can maximize annotation accuracy and biological insights in human CD8+ T cell atlas research, ultimately advancing our understanding of adaptive immunity and facilitating therapeutic development.
Single-cell RNA sequencing (scRNA-seq) has revolutionized immunology by enabling the dissection of cellular diversity and dynamic gene expression at unprecedented resolution. For heterogenous populations such as T cells, this technology can discern cellular subtypes within a population, a capability beyond the reach of bulk RNA sequencing [48]. Furthermore, advanced scRNA-seq protocols can now parallelly capture the highly diverse T-cell receptor (TCR) sequence alongside the gene expression profile of individual cells, providing a powerful tool for studying the adaptive immune system [48]. However, the field faces a significant bottleneck: the lack of a gold-standard method for cell phenotype annotation. This challenge is particularly acute for T cells due to their extreme heterogeneity in both gene expression and TCR sequences [48]. While current automated annotation tools can differentiate major cell populations, accurately labelling T-cell subtypes remains problematic. This whitepaper outlines a robust two-step annotation protocol that integrates the speed of automated algorithms with the precision of expert manual curation, specifically within the context of building a comprehensive human CD8+ T cell atlas.
The Critical Need for a Two-Step Protocol in T Cell Annotation
The initial manual annotation of scRNA-seq datasets is a time-intensive process prone to data entry errors and requires deep expert knowledge of cell-type-specific marker genes [48]. This process typically involves clustering cells and identifying differentially expressed genes (DEGs) among clusters to match them with known cellular populations. This approach is hampered by technical challenges like high gene dropout rates, ambient mRNA contamination, and poor expression of some key marker genes at the RNA level [48].
Automated annotation tools leveraging machine learning have been developed to alleviate this burden. These methods can be broadly categorized as follows [48]:
- Unsupervised approaches (e.g., Seurat clustering) group cells with similar expression profiles but require manual expert interrogation for final cluster labeling.
- Supervised approaches (e.g., SingleR, Garnett, CellTypist) predict cell-type labels for a new dataset based on a model trained on previously annotated datasets.
- Semi-supervised approaches (e.g., SCINA, scGate) annotate cells based on a consensus list of known markers, often in a hierarchical structure.
However, these automated methods are not infallible. Their performance is contingent on the quality and similarity of the reference data, and they can struggle with novel cell states or datasets from new species [48]. Therefore, a two-step process involving primary annotation by automated algorithms followed by expert-based manual inspection is strongly recommended as the current gold standard in the field [48]. This hybrid approach ensures both efficiency and accuracy, which is paramount for critical applications like drug development and biomarker discovery.
Step 1: Automated Algorithm Selection and Application
The first step involves selecting and applying an appropriate automated annotation tool to obtain a preliminary labeling of cell types. The choice of tool depends on the research context, available resources, and the nature of the dataset.
| Method | Type | Underlying Principle | Advantages | Ideal Use Case |
|---|---|---|---|---|
| Seurat Clustering [48] | Unsupervised | Groups cells based on gene expression similarity using k-nearest neighbours. | Transparent process. | Initial exploration of datasets; when no suitable reference exists. |
| CellTypist [48] | Gene set-based/Supervised | Classification based on a large set of gene expression markers trained on annotated atlases. | Harmonizes cell type definitions across studies; requires little prior knowledge. | When your dataset is similar to large, well-curated reference atlases. |
| Garnett [48] | Marker gene-based/Supervised | Automated mapping based on a small, curated set of marker genes. | Transparent; requires little prior knowledge. | When a validated, specific set of marker genes is available for the cell types of interest. |
| scGate [48] | Semi-supervised | Uses a hierarchical gating strategy of pure/impure cells, similar to flow cytometry. | Highly interpretable; user can provide custom marker lists. | For datasets dissimilar to pre-learned models; to isolate specific cell populations. |
| ScType [64] | Fully-automated | Uses a comprehensive marker database and ensures specificity of markers across clusters and types. | Ultra-fast; high accuracy; includes negative marker analysis. | For fully automated, unbiased annotation without a pre-existing reference model. |
| T-CellAnnoTator (TCAT) [39] | Gene program-based | Quantifies predefined Gene Expression Programs (GEPs) for activation states and subsets, moving beyond discrete clusters. | Captures continuous T cell states; reproducible across datasets. | For deep characterization of T cell functional states and activation programs. |
Quantitative Performance of Selected Tools
Benchmarking studies provide insight into the practical performance of these tools. A systematic evaluation of several algorithms across six scRNA-seq datasets from various human and mouse tissues demonstrated the following performance metrics [64]:
| Tool | Average Annotation Accuracy | Relative Speed | Key Strengths |
|---|---|---|---|
| ScType | 98.6% (72/73 cell types) | 30x faster than scSorter | Accurately distinguishes closely related subtypes. |
| scSorter | High accuracy | (Baseline speed) | Robust performance, but slower. |
| SCINA | Lower accuracy on closely related types | Fast | - |
| scCATCH | Lower accuracy on closely related types | - | - |
For CD8+ T cell research specifically, the TCAT tool has identified 46 reproducible Gene Expression Programs (cGEPs) reflecting core T cell functions like proliferation, cytotoxicity, and exhaustion by analyzing 1.7 million T cells from 700 individuals [39]. This provides a powerful, standardized framework for annotating complex T cell states in human atlas research.
Step 2: Expert Manual Curation and Validation
The second, crucial step is the expert-led manual curation of the automated annotations. This process validates the results and identifies areas where automated methods may have failed.
Workflow for Expert Manual Curation
The following diagram illustrates the logical workflow for the expert manual curation step, which acts as a quality control and refinement cycle.
Key Manual Curation Tasks
- Interrogation of Differentially Expressed Genes (DEGs): For each cluster generated by the automated tool, experts must examine the top DEGs to confirm they align with the assigned cell type. For example, a cluster annotated as "exhausted CD8+ T cells" should show elevated expression of genes like HAVCR2 (TIM-3), LAG3, and ENTPD1 (CD39) [39].
- Validation with Known Marker Genes: This involves cross-referencing cluster gene expression with established marker genes for CD8+ T cell subsets. This is not just about confirming positive markers but also checking for the absence of markers for other lineages.
- Assessment of TCR Clonality: For datasets with paired TCR sequencing, experts should examine TCR clonality. The expansion of specific T cell clones can be a critical indicator of antigen specificity. Studies have shown that T cells isolated from heterotypic clusters with tumor cells exhibit increased TCR clonality, indicating expansion and enriching for tumor-reactive cells [65].
- Identification of Novel or Ambiguous Populations: Manual inspection is essential for identifying cells that fall into ambiguous zones or express genes from multiple programs, which clustering algorithms might misassign or overlook.
Practical Implementation for CD8+ T Cell Atlas Research
Research Reagent Solutions for T Cell Annotation
The following table details essential materials and computational tools used in the field for annotating CD8+ T cells.
| Item | Function/Application in Annotation | Example/Note |
|---|---|---|
| 10x Genomics Chromium | A widely used commercial platform for generating single-cell gene expression (GEX) and V(D)J (TCR) libraries. | Enables paired GEX and TCR sequencing from the same cell [43]. |
| Cell Hash Tag Oligos | Multiplexing samples; allows pooling of multiple samples, reducing batch effects and costs. | Used in PBMC/islet T cell studies to track sample origin [43]. |
| Anti-surface Protein Antibodies | For CITE-seq; integrates protein abundance measurement with transcriptomic data. | Enhances GEP interpretability and annotation confidence [39]. |
| Seurat R Package [48] | A comprehensive toolkit for single-cell genomics data pre-processing, integration, clustering, and annotation. | Industry standard for initial data processing and unsupervised clustering. |
| ScType Database [64] | A comprehensive database of established cell-specific markers used for fully-automated annotation. | Provides positive and negative marker information for unbiased annotation. |
| TCAT cGEP Catalog [39] | A fixed catalog of 46 reproducible Gene Expression Programs for T cell states. | Enables consistent scoring of T cell functions like cytotoxicity and exhaustion across datasets. |
Detailed Experimental Protocol: Annotating Tumor-Reactive CD8+ T Cells
The following workflow is derived from a study that successfully isolated and characterized tumor-reactive CD8+ T cell clusters from human melanoma metastases [65]. It exemplifies the application of the two-step annotation protocol in a translational research context.
Protocol Steps:
- Sample Acquisition and Processing: Obtain human melanoma metastases and digest the tissue enzymatically for a short duration (e.g., 30 minutes) to preserve fragile cell-cell interactions [65].
- Flow Cytometry and Cell Sorting: Stain the single-cell suspension with antibodies against CD8 (T cells), CD146/NGFR (melanoma cells), and CD11c (Antigen-Presenting Cells). Use fluorescence-activated cell sorting (FACS) to isolate three distinct populations: CD8+ T cell singlets, tumor cell singlets, and heterotypic clusters (events positive for both T cell and tumor/APC markers) [65].
- Library Preparation and Sequencing: Subject the sorted populations to scRNA-seq and scTCR-seq using a platform like 10x Genomics. Note that the sorting process may dissociate some clusters into single cells; their cluster-of-origin is tracked by the sorting index [65].
- Automated Annotation: Process the raw sequencing data (e.g., using Seurat or Scanpy) and perform initial automated annotation. A tool like CellTypist, trained on immune cell atlases, could provide the first-pass labels (e.g., "T cell," "melanoma cell").
- Expert Manual Curation:
- Re-cluster and Analyze DEGs: Focus on the T cells. Re-cluster them separately and perform DEG analysis. The study revealed that T cells derived from heterotypic clusters were enriched for gene signatures associated with tumor reactivity and exhaustion compared to singlet T cells [65].
- Analyze TCR Data: Examine the scTCR-seq data. The study found that clustered T cells exhibited increased TCR clonality, indicating antigen-driven expansion. Furthermore, TCR-matched T cells showed different exhaustion states depending on whether they were conjugated to APCs or tumor cells directly [65].
- Functional Validation: The final, crucial step of curation is to link transcriptomic findings to function. The researchers expanded the clustered T cells ex vivo and demonstrated that they exerted a ninefold increased killing activity towards autologous melanomas compared to other T cells [65]. This functional data provides the highest level of validation for the manual annotation.
In the rapidly advancing field of single-cell genomics, a rigorous two-step annotation protocol is not merely a recommendation but a necessity for generating reliable data, especially for a complex cell type like the human CD8+ T cell. The synergy between automated algorithms and expert manual curation creates a powerful framework that balances throughput with accuracy. Automated tools provide scalability and reproducibility, while human expertise provides the biological context and critical thinking required to interpret nuanced data, identify novel findings, and validate functional implications. As the tools and reference atlases continue to evolve—with methods like TCAT providing deeper insights into continuous cellular states—this foundational protocol will remain essential for researchers and drug development professionals aiming to build a definitive and biologically meaningful human CD8+ T cell atlas.
Validating Discoveries and Translating Findings: Cross-Species Conservation and Clinical Prognostics
The translation of immunological findings from mouse models to human applications represents a fundamental challenge in biomedical research. Single-cell RNA sequencing (scRNA-seq) has revolutionized our understanding of T cell biology by revealing an unprecedented degree of immune cell diversity at the transcriptomic level [16] [66]. However, consistent definition of cell subtypes and states across studies and species remains a major challenge in the field. For researchers and drug development professionals working with T cell atlases, understanding the degree of conservation between human and mouse T cell subtypes is essential for properly interpreting preclinical data and designing translational studies. This technical guide provides a comprehensive framework for cross-species validation of T cell subtypes, with particular emphasis on CD8+ T cell populations that play critical roles in cancer immunity, inflammatory diseases, and immunotherapy response [32] [5]. The establishment of reliable cross-species correspondences enables more accurate interpretation of murine models in preclinical drug development and creates a conserved basis for understanding T cell heterogeneity across studies, diseases, and species [16].
Established Conservation Patterns Between Human and Mouse T Cell Subtypes
Conserved T Cell Subtypes and States
Cross-study integration of scRNA-seq datasets has revealed strong conservation of fundamental T cell subtypes between human and mouse models, particularly for tumor-infiltrating lymphocytes (TILs). A meta-analysis of T cell states across multiple cohorts demonstrated that key CD8+ T cell subtypes are remarkably conserved between species [16]. The table below summarizes the quantitatively established conservation patterns for primary T cell subtypes:
Table 1: Conservation of Major T Cell Subtypes Between Human and Mouse
| T Cell Subtype | Conservation Level | Key Conserved Markers | Functional Conservation |
|---|---|---|---|
| Naive-like CD8+ T cells | High | TCF7, CCR7, SELL (CD62L) | Maintenance of quiescent state, self-renewal capacity |
| Precursor exhausted CD8+ (Tpex) | High | TCF7, PDCD1, TOX | Self-renewal capacity, response to checkpoint inhibition |
| Terminally exhausted CD8+ (Tex) | High | PDCD1, HAVCR2, LAG3, TOX | Effector function impairment, high inhibitory receptor expression |
| Effector-memory CD8+ (EM) | High | GZMK, GZMB, IFNγ | Rapid effector function upon reactivation |
| CD4+ Th1-like | High | IFNG, TBX21, IFNR1 | IFNγ production, macrophage activation |
| CD4+ T follicular helper (Tfh) | Moderate | CXCR5, TOX, SLAMF6 | B cell help, germinal center formation |
| Regulatory T cells (Treg) | High | FOXP3, IL2RA, CTLA4 | Immunosuppressive function |
Beyond these established subtypes, recent large-scale atlas integration has identified further conservation in exhausted T (Tex) cell subpopulations. The scAtlasVAE framework, which integrated over 1.1 million human CD8+ T cells from 68 studies, identified three distinct exhausted T cell subtypes that show conserved biological properties with murine counterparts, including GZMK+ and ITGAE+ Tex cells that exhibit divergent clonal relationships with tissue-resident memory T (TRM) cells [32] [5]. These exhausted subpopulations are enriched in distinct cancer types and demonstrate similar transcriptomic signatures across species, providing important insights for immunotherapy development.
Technical Validation Frameworks
The ProjecTILs method represents a computational framework specifically designed for the cross-species validation of T cell states. This algorithm enables projection of new scRNA-seq data into reference atlases without altering the reference structure, allowing direct comparison between murine and human T cell states [16]. The method employs a multi-step process: (1) normalization and filtering of scRNA-seq data, (2) batch-effect correction using integration algorithms, (3) projection into reference reduced-dimension spaces, and (4) cell state prediction using nearest-neighbor classification. This approach has demonstrated that despite differences in absolute gene expression levels, the fundamental organization of T cell state landscapes is conserved between humans and mice [16].
Methodologies for Cross-Species Experimental Validation
Integrated Computational and Experimental Workflow
The validation of T cell subtype conservation requires an integrated approach combining computational mapping with experimental confirmation. The following workflow outlines the key steps for robust cross-species validation:
Figure 1: Integrated Computational and Experimental Workflow for Cross-Species T Cell Validation
Detailed Experimental Protocols
Single-Cell RNA Sequencing and Data Integration
For scRNA-seq analysis, the following protocol ensures optimal cross-species comparison:
Sample Processing: Isolate T cells from human and mouse tissues (blood, lymph nodes, tumors) using density gradient centrifugation or magnetic-activated cell sorting (MACS) with preservation of cell viability >85% [67].
Library Preparation: Utilize 10x Genomics 3' v2 chemistry or similar platform for cDNA library generation. Sequence on Illumina platforms (NovaSeq 6000) with minimum depth of 50,000 reads per cell [63].
Quality Control: Filter cells with <300 detected genes and remove doublets using DoubletFinder. Apply mitochondrial gene threshold of 20% for human and chicken cells, 10% for mouse and rat cells [67].
Data Integration: Apply Harmony integration algorithm to correct for batch effects across species. Use SCTransform for normalization, RunPCA for dimensionality reduction, and RunUMAP for visualization [67].
Cross-Species Mapping: Convert orthologous genes to human gene symbols using Ensembl BioMart or OrthoFinder. Project mouse data into human reference atlases using ProjecTILs algorithm [16].
In Vivo Validation Using ImmunoPET/MRI
CD4+ T cell tracking via immunoPET provides in vivo validation of computational predictions:
Tracer Preparation: Radiolabel anti-mouse and anti-human CD4-targeting minibodies (Mbs) with 89Zr using desferrioxamine (dfo) chelator. Achieve >90% radiolabeling efficiency and verify immunoreactive fractions >70% via HPLC [68].
Specificity Validation: Conduct maximum binding assays with increasing numbers of CD4+ cells (HPB-ALL for human, primary T cells for mouse). Perform blocking experiments with 100-fold excess of unlabeled CD4-Mb to confirm specificity [68].
In Vivo Imaging: Administer 89Zr-CD4-Mb tracers to human CD4 knock-in (hCD4-KI) and wild-type mouse models bearing syngeneic tumors. Image using PET/MRI at multiple timepoints post-injection [68].
Uptake Quantification: Measure tracer uptake in lymphoid organs (spleen, lymph nodes) and tumor microenvironment. Calculate target-to-background ratios and compare between species-specific tracers [68].
Table 2: Key Reagent Solutions for Cross-Species T Cell Validation
| Reagent/Category | Specific Examples | Function in Validation | Species Application |
|---|---|---|---|
| Single-cell Platforms | 10x Genomics 3' v2 | High-throughput scRNA-seq library generation | Human, Mouse [63] |
| Integration Algorithms | Harmony, STACAS, scAtlasVAE | Batch effect correction, dataset integration | Cross-species [16] [67] |
| Projection Tools | ProjecTILs | Reference atlas mapping | Cross-species [16] |
| Imaging Tracers | 89Zr-hCD4-Mb, 89Zr-mCD4-Mb | In vivo T cell tracking via PET/MRI | Species-specific [68] |
| Cell Sorting Markers | CD45RA, CCR7, CD27, CD28 | Surface phenotype validation | Human [66] |
| Exhaustion Markers | PD-1, TIM-3, LAG-3, TCF7 | T cell differentiation state assessment | Human, Mouse [16] |
Applications in Preclinical Drug Development
Monitoring Immunotherapy Response
Cross-species T cell validation enables more accurate prediction of immunotherapy responses. Studies utilizing CD4-PET/MRI have demonstrated that CD4+ T cell distribution patterns in lymphoid organs and tumor microenvironments can predict sensitivity to checkpoint inhibitor therapy [68]. In MC38 adenocarcinoma-bearing mice treated with αPD-L1 and anti-LAG-3 antibodies, responsive animals exhibited approximately 1.4-fold higher 89Zr-mCD4-Mb uptake compared to non-responsive or sham-treated controls [68]. This noninvasive imaging approach, validated across species, provides critical insights into CD4-directed cancer immunotherapies in preclinical models with direct clinical translation potential.
Conserved Biomarker Identification
The establishment of cross-species conserved T cell signatures facilitates the identification of robust biomarkers for drug development. Large-scale integration of human CD8+ T cell data has revealed conserved exhausted T cell subpopulations across cancer types, providing targets for next-generation immunotherapies [32] [5]. Additionally, age-associated T cell changes show cross-species parallels, with accumulation of GZMK+CD8+ T cells and HLA-DR+CD4+ T cells observed in both aging humans and murine models [19]. These conserved patterns enable more predictive preclinical modeling of age-impaired immune responses in therapeutic contexts.
Limitations and Considerations in Cross-Species Extrapolation
Identified Divergence Patterns
Despite strong conservation in many T cell subtypes, significant species-specific differences must be considered:
Tissue-Specific Variations: Tissue-resident T cell populations exhibit greater cross-species divergence than circulating counterparts, particularly in non-lymphoid tissues [63] [66].
Inflammatory Contexts: Response to cardiac injury models demonstrates substantial divergence between zebrafish and mouse immune responses, suggesting similar limitations in human-mouse comparisons [69].
Activation Thresholds: Naive CD8+ T cell populations show species-specific differences in activation requirements and virtual memory T cell (Tvm) formation [66].
Cytokine Production: Age-associated increases in type 2/interleukin-4-expressing memory subpopulations differ in magnitude between humans and mice [19].
Best Practices for Translation
To maximize translational relevance when utilizing cross-species T cell data:
Employ Multiple Validation Methods: Combine transcriptomic data with protein-level validation (flow cytometry) and functional assays [66].
Context-Matched Comparisons: Compare T cells from similar tissue microenvironments (tumor vs. tumor, blood vs. blood) rather than cross-tissue comparisons [63].
Utilize Humanized Models: Implement human CD4 knock-in (hCD4-KI) models for tracer validation and therapy testing [68].
Reference Atlas Projection: Always project new data into established reference atlases using tools like ProjecTILs rather than unsupervised analysis alone [16].
Cross-species validation of T cell subtypes between human and mouse models provides an essential foundation for translational immunology and drug development. The strong conservation of key CD8+ T cell states, particularly in the exhaustion spectrum, supports the continued use of murine models for preclinical immunotherapy development. However, researchers must remain cognizant of important species-specific differences and implement integrated validation workflows that combine computational mapping with experimental confirmation. The methodologies and frameworks outlined in this technical guide provide a robust approach for ensuring that cross-species T cell data is accurately interpreted and effectively translated to human applications.
The adaptive immune system plays a critical role in cancer surveillance and elimination, with CD8+ T lymphocytes serving as central mediators of antitumor immunity. However, these cells exhibit profound functional and phenotypic heterogeneity within the tumor microenvironment (TME). Single-cell RNA sequencing (scRNA-seq) technologies have revolutionized our understanding of CD8+ T cell biology, revealing distinct differentiation states with contrasting impacts on disease progression and treatment outcomes [63]. The functional spectrum ranges from robust cytotoxic effector cells to highly dysfunctional exhausted populations, with emerging evidence suggesting that even within exhausted compartments, specific subsets possess divergent capacities for expansion and response to therapy [57]. This technical review examines how discrete CD8+ T cell subsets, as defined by modern genomic and multiplex imaging approaches, correlate with clinical parameters including patient survival, recurrence risk, and response to immune checkpoint blockade (ICB). By integrating findings from cross-cancer analyses and methodology-specific insights, we provide a comprehensive framework for leveraging CD8+ T cell heterogeneity as a biomarker for prognosis and therapeutic stratification.
CD8+ T Cell Subset Classification and Functional States
Major Subsets and Defining Characteristics
CD8+ T cell differentiation states exist along a continuum, but can be broadly categorized into functionally distinct subsets based on surface marker expression, transcriptional regulators, and effector capabilities [70] [57]. Table 1 summarizes the key subsets, their defining features, and functional significance.
Table 1: Major CD8+ T Cell Subsets in Cancer Immunity
| Subset | Key Markers | Transcription Factors | Functional Features | Clinical Significance |
|---|---|---|---|---|
| Cytotoxic (Tc1) | CD29, IFN-γ, Granzyme B, Perforin | T-bet, EOMES, STAT4 | Target cell killing via perforin/granzyme, Fas-FasL; production of IFN-γ and TNF-α | Associated with "hot" tumors; favorable prognosis; correlates with response to ICB [70] |
| Progenitor Exhausted (Tpex) | PD-1int, CXCR5, TCF-1 | TCF-1, BACH2 | Self-renewal capacity, proliferative potential, ability to differentiate into exhausted subsets | Responsive to ICB; associated with better tumor control and favorable immunotherapy outcomes [71] [70] [72] |
| Terminally Exhausted (Ttex) | PD-1hi, TIM-3, CD39, TIGIT | TOX, BLIMP-1 | Progressive loss of effector function, sustained inhibitory receptor expression, impaired cytokine production | Poor responsiveness to ICB; in colorectal cancer, high density associated with better survival in MSI-high context [71] [70] |
| Tc2 | IL-4, IL-5, IL-13 | GATA3, STAT6 | Production of Th2-type cytokines; minimal direct cytotoxicity | Contributes to allergic pathology; increased in severe eosinophilic asthma; less responsive to steroids [70] |
| Circulating Memory | CD44, CD122, CD62L | Not specified | Rapid cytokine production upon re-stimulation, long-term persistence | Superior antitumor immunity compared to effector T cells; frequency predicts responsiveness to ICB [70] |
Developmental Trajectories and Plasticity
CD8+ T cell differentiation follows a hierarchical developmental program. Unified analysis of chromatin accessibility and gene expression across cancer and chronic infection models reveals an early bifurcation separating functional effector differentiation from dysfunctional pathways [57]. This branch point emerges from a TCF-1+ progenitor-like population that resembles memory precursor effector cells (MPECs) in acute infection. From this progenitor pool, cells can either differentiate into functional effector and memory cells or commit to a dysfunctional trajectory characterized by progressive epigenetic remodeling that stabilizes exhaustion [57]. The dysfunctional pathway further divides into progenitor exhausted (Tpex) and terminally exhausted (Ttex) subsets, with the former maintaining stem-like properties and treatment responsiveness while the latter represents an irreversible state of functional impairment.
Prognostic Significance Across Cancer Types
Solid Tumors
CD8+ T cell infiltration patterns and subset distribution provide powerful prognostic information across multiple solid tumors. In colorectal cancer (CRC), multiplex immunofluorescence analysis of 517 patients with stage III or high-risk stage II disease revealed that a higher ratio of terminally exhausted CD8+ T cells (Ttex) to total CD8+ T cells was associated with significantly better 5-year relapse-free survival (RFS) [71]. This counterintuitive finding—that exhausted cells correlate with improved outcomes—was particularly evident in microsatellite instability-high (MSI-H) and tumor mutational burden-high (TMB-H) tumors, suggesting contextual dependence for Ttex prognostic value.
In breast cancer, spatial distribution rather than simply density provides critical prognostic information. A retrospective cohort study of 1,467 participants established that proximity and consistency (measuring mean and variance of nearest neighbor distances between CD8+ T cells and tumor cells) strongly predicted recurrence-free survival in both ER-positive and ER-negative disease [73]. For ER-positive patients, hazard ratios for RFS were 2.04 for proximity and 1.82 for consistency, outperforming conventional lymphocyte count-based metrics (HR 1.35) [73].
Hematologic Malignancies
Single-cell transcriptomics of bone marrow CD8+ T cells in acute myeloid leukemia (AML) reveals a dichotomic differentiation program with direct therapeutic implications. Researchers identified an early memory CD8+ T cell population associated with therapy response that bifurcates into two terminal states: one enriched for activation markers and another expressing NK-like and senescence markers [74]. Clonal differentiation trajectories skewed toward senescent-like CD8+ T cells were a hallmark of therapy resistance, and an imbalance between early memory and senescent-like cells correlated with treatment refractoriness and poor survival [74].
Predictive Value for Immunotherapy Response
Checkpoint Inhibitor Responsiveness
CD8+ T cell subsets demonstrate distinct predictive values for immune checkpoint blockade outcomes. Progenitor exhausted T cells (Tpex), characterized by TCF-1 expression and self-renewal capacity, are consistently associated with favorable responses to anti-PD-1/PD-L1 therapy across multiple cancer types [71] [72]. Conversely, terminally exhausted T cells (Ttex) typically correlate negatively with ICB efficacy due to their irreversible dysfunctional state [72]. However, this relationship exhibits context dependence, as Ttex infiltration in MSI-H colorectal cancers predicts better prognosis and may indicate pre-existing antitumor immunity [71].
Circulating CD8+ T cell subsets offer a minimally invasive approach to monitoring and predicting treatment response. Memory subsets and progenitor exhausted T cells in peripheral blood show promise as predictive biomarkers for immunotherapy, reflecting the functional immune repertoire capable of responding to ICB [72].
Heterogeneity in Response Patterns
Whole-body CD8+ T cell visualization using zirconium-89-labeled anti-CD8 PET tracer (89ZED88082A) reveals enormous heterogeneity in CD8+ T cell distribution within and between patients during ICB therapy [75]. Individual lesions show diverse changes in CD8+ T cell infiltration independent of overall tumor response, challenging conventional biopsy-based assessments and highlighting the need for systemic monitoring approaches. Baseline CD8 tracer uptake was higher in patients with mismatch repair-deficient (dMMR) tumors and showed a positive association with overall survival (median OS 13.8 vs. 6.5 months for above-median vs. below-median uptake) [75].
Methodological Approaches for CD8+ T Cell Analysis
Single-Cell RNA Sequencing
Table 2: Key Experimental Protocols in CD8+ T Cell Research
| Methodology | Key Applications | Technical Considerations | Representative Findings |
|---|---|---|---|
| Single-cell RNA sequencing | Defining transcriptional states, developmental trajectories, heterogeneity | Cell viability, sequencing depth, batch effect correction, clustering resolution | Identification of progenitor and terminally exhausted subsets; unified dysfunction trajectory across cancers [28] [76] [57] |
| Multiplex immunofluorescence (mIF) | Spatial context, protein-level validation, tumor microenvironment mapping | Antibody validation, tissue preservation, spectral unmixing, signal-to-noise ratio | Prognostic significance of CD8+ T cell proximity to tumor cells in breast cancer [73]; Tpex and Ttex quantification in colorectal cancer [71] |
| ATAC-seq | Chromatin accessibility, epigenetic regulation, regulatory element identification | Nuclei quality, sequencing depth, transposase activity, fragment size selection | Universal chromatin signature of dysfunction; early bifurcation of functional and dysfunctional states [57] |
| CD8-specific PET imaging (89ZED88082A) | Whole-body CD8+ T cell visualization, treatment monitoring, lesion heterogeneity | Tracer dose, imaging timing, background signal, radiation exposure | Heterogeneous CD8+ distribution within and between patients; association with dMMR status and survival [75] |
Multiplex Immunofluorescence and Spatial Analysis
For multiplex immunofluorescence analysis of CD8+ T cell subsets in formalin-fixed paraffin-embedded (FFPE) tissues, the following protocol provides robust results:
- Tissue Preparation: Cut 4μm sections from FFPE tissue microarray blocks. Heat slides for at least 1 hour at 60°C in a dry oven [71].
- Staining Protocol: Perform sequential staining rounds using an automated stainer (e.g., Leica Bond Rx). Each round includes:
- Dewaxing with Bond Dewax solution
- Antigen retrieval using Bond Epitope Retrieval solutions (20-30 minutes)
- Blocking with specialized buffer (10-30 minutes)
- Primary antibody incubation (30 minutes)
- HRP-conjugated secondary antibody incubation (10 minutes)
- Visualization with fluorescent dyes (Astra-dye, 10 minutes)
- Antibody removal with additional antigen retrieval (20 minutes) [71]
- Antibody Panels: Design panels to identify key subsets (e.g., CK for tumor cells, CD3/CD8 for T cells, TCF-1 for progenitor exhausted, FOXP3 for regulatory T cells) [71] [73].
- Image Acquisition and Analysis: Scan slides using a multispectral imaging system (e.g., PhenoImager at 20× magnification). Use tissue analysis software (e.g., inForm) for spectral unmixing, tissue segmentation, and cell phenotyping based on marker expression intensity and compartmentalization [71].
Computational Analysis of Single-Cell Data
Processing scRNA-seq data for CD8+ T cell subset identification involves:
- Quality Control: Filtering low-quality cells based on unique feature counts, mitochondrial percentage, and doublet detection
- Integration: Batch correction across samples using methods like Harmony or Seurat's CCA
- Clustering: Community detection algorithms (e.g., Louvain, Leiden) to identify distinct cell states
- Trajectory Inference: Pseudotemporal ordering using tools like Monocle3 or Slingshot to reconstruct differentiation pathways
- Differential Expression: Identifying marker genes distinguishing CD8+ T cell subsets
Unified analysis of over 300 ATAC-seq and RNA-seq datasets from multiple studies requires specialized computational approaches, including generalized linear models to account for batch effects while preserving biological signals [57].
The Scientist's Toolkit: Essential Research Reagents
Table 3: Key Research Reagent Solutions for CD8+ T Cell Studies
| Reagent/Category | Specific Examples | Application/Function |
|---|---|---|
| Flow Cytometry Antibodies | Anti-CD3, CD8, PD-1, TCF-1, TIM-3, TIGIT, CD39, CD69, CD45RA, CCR7 | Surface and intracellular protein detection, subset identification, functional state assessment |
| Multiplex Immunofluorescence Panels | Cytokeratin (tumor masking), CD8, TCF-1, FOXP3, CD3 | Spatial context analysis, tumor-immune interface mapping, subset quantification in tissue architecture [71] [73] |
| Single-Cell RNA-seq Kits | 10x Genomics 3' Gene Expression, 5' Immune Profiling with V(D)J | Transcriptome profiling, clonotype tracking, immune receptor sequencing [28] [63] [74] |
| Cell Isolation Kits | CD8+ T cell isolation kits, dead cell removal kits, magnetic bead-based separation | Sample preparation, population enrichment, viability improvement for downstream assays |
| Cytokine/Chemokine Assays | CCL4, TGFβ, IFN-γ, Granzyme B ELISAs, LEGENDplex panels | Functional validation, secretory profile characterization, pathway activity assessment [28] |
| CD8-PET Tracers | 89ZED88082A (Zirconium-89-labeled anti-CD8) | Whole-body CD8+ T cell visualization, systemic distribution assessment, treatment monitoring [75] |
Signaling Pathways and Molecular Regulation
Dysfunctional Differentiation Network
CD8+ T Cell Differentiation Pathway: This diagram illustrates the early bifurcation of CD8+ T cell differentiation from a TCF-1+ progenitor population into functional effector/memory cells versus dysfunctional exhausted cells under conditions of chronic antigen stimulation, as revealed by unified analysis of epigenetic states [57].
Exhaustion-Associated Molecular Circuits
The establishment of CD8+ T cell exhaustion is governed by coordinated transcriptional and epigenetic reprogramming. TOX emerges as a master regulator of exhaustion, driving expression of multiple inhibitory receptors including PD-1, LAG3, 2B4, and CD39 [70]. Chronic antigen exposure stabilizes the exhausted state through extensive chromatin remodeling that creates a distinct epigenetic landscape shared across tumor types and chronic infections [57]. Progenitor exhausted T cells maintain expression of TCF-1 and limited responsiveness to ICB, while terminally exhausted cells upregulate additional inhibitors like TIM-3 and exhibit irreversible dysfunction.
In low-grade gliomas, CD8+ exhausted T cells play a paradoxical tumor-promoting role through cytokine-mediated mechanisms rather than direct cytotoxicity. Single-cell RNA sequencing reveals that these PD-1+/TIGIT+ exhausted T cells express CCL4, which activates tumor-associated monocytes to produce the mitogen CCL5, thereby supporting glioma growth [28]. This pathway operates independently of traditional cytotoxic functions and may explain limited ICB efficacy in these tumors.
The comprehensive characterization of CD8+ T cell subsets through single-cell technologies has transformed our understanding of antitumor immunity and treatment resistance. The integration of transcriptional, epigenetic, spatial, and protein-level data reveals consistent patterns of CD8+ T cell differentiation across cancer types, with profound implications for prognostic stratification and therapeutic development. The emerging paradigm recognizes that discrete CD8+ T cell states—particularly the balance between progenitor and terminally exhausted subsets—carry distinct prognostic and predictive information that can guide clinical decision-making.
Future research directions should focus on: (1) developing standardized biomarker panels incorporating multiple CD8+ T cell subsets for clinical application; (2) advancing spatial transcriptomic methods to preserve architectural context in subset analysis; (3) exploring therapeutic strategies to promote favorable CD8+ T cell states (e.g., progenitor exhausted over terminally exhausted); and (4) validating circulating CD8+ T cell subsets as minimally invasive monitoring tools. As single-cell technologies continue to evolve and become more accessible, CD8+ T cell subset classification will increasingly inform precision immuno-oncology approaches, ultimately improving patient selection and treatment outcomes across the cancer spectrum.
Single-cell RNA sequencing (scRNA-seq) has revealed extraordinary heterogeneity within human CD8+ T cells, with distinct subpopulations exhibiting specialized functions in immunity, cancer surveillance, and inflammatory regulation. However, verifying cell states and functions across independent studies presents significant computational and biological challenges. Cross-atlas comparisons aim to transcend the limitations of individual studies by integrating data from multiple sources to build robust, reproducible classifications of CD8+ T cell states. This approach enables researchers to distinguish biologically consistent cell subtypes from study-specific artifacts, technical variations, or annotation inconsistencies.
The development of comprehensive T cell atlases has highlighted the remarkable diversity of CD8+ T cell phenotypes across different disease conditions, tissue environments, and developmental stages. For example, integrative mapping of human CD8+ T cells has identified distinct exhausted T cell subtypes in cancer contexts that exhibit divergent clonal relationships with tissue-resident memory T cells or circulating T cells [5]. Similarly, longitudinal studies across the human lifespan have revealed how CD8+ T cell subpopulations dynamically change with age, with naive subsets declining and certain memory populations increasing over nine decades of life [77]. These findings underscore the critical importance of standardized approaches for verifying cell states across different biological contexts and experimental platforms.
Computational Frameworks for Cross-Atlas Integration
Deep Learning Approaches for Atlas Integration
The integration of large-scale scRNA-seq datasets requires sophisticated computational methods that can effectively mitigate batch effects while preserving biological signals. The scAtlasVAE framework represents a significant advancement in this domain, utilizing a variational autoencoder (VAE) architecture with a batch-invariant encoder to integrate single-cell data across studies [5] [32]. This model identifies biologically relevant features while learning batch-related information separately, enabling effective cross-study comparisons.
The scAtlasVAE framework has demonstrated its utility in constructing an extensive human CD8+ T cell atlas comprising 1,151,678 cells from 961 samples across 68 studies and 42 disease conditions, with paired T cell receptor information [5]. This integration has enabled researchers to establish connections between distinct cell subtypes and illuminate their phenotypic and functional transitions. Notably, this approach has characterized three distinct exhausted T cell subtypes and revealed diverse transcriptome and clonal sharing patterns in autoimmune and immune-related adverse event inflammation [5].
Automated Cell Type Annotation with Large Language Models
Recent advancements in cell type annotation leverage large language models (LLMs) to address challenges in consistency and reliability. The LICT (Large Language Model-based Identifier for Cell Types) tool employs a "talk-to-machine" approach that iteratively enriches model input with contextual information to mitigate ambiguous or biased outputs [78]. This method combines multiple LLMs through three complementary strategies: multi-model integration, iterative feedback, and objective credibility evaluation.
Validation across diverse datasets shows that LLM-based approaches can achieve annotation consistency comparable to expert annotations, with particularly strong performance in highly heterogeneous cell populations such as peripheral blood mononuclear cells (PBMCs) [78]. For CD8+ T cell research, these methods facilitate automatic annotation of cell subtypes in query scRNA-seq datasets, enabling unbiased and scalable analyses across multiple studies [5].
Table 1: Computational Frameworks for Cross-Atlas Comparison
| Framework | Methodology | Key Features | Application in CD8+ T Cell Research |
|---|---|---|---|
| scAtlasVAE [5] [32] | Variational autoencoder with batch-invariant encoder | Integrates transcriptome and paired TCR data; identifies 18 CD8+ T cell subtypes | Unified atlas of 1.1M+ cells from 68 studies; revealed exhausted T cell heterogeneity |
| LICT [78] | Multi-model LLM integration with credibility assessment | "Talk-to-machine" iterative feedback; objective reliability evaluation | Automated annotation of CD8+ T cell subtypes; enhanced consistency across studies |
| Mixed-Effect Elastic Net [77] | Machine learning algorithm for age prediction | Predicts cell age based on transcriptomic features; accounts for donor effects | Identified aging trajectories in CD8+ T cells across nine decades of life |
Experimental Protocols for Cross-Atlas Validation
Sample Processing and Single-Cell RNA Sequencing
Standardized sample processing is fundamental for reliable cross-atlas comparisons. For CD8+ T cell studies, peripheral blood mononuclear cells (PBMCs) are typically isolated from blood samples using density gradient centrifugation, followed by red blood cell lysis and filtration to obtain single-cell suspensions [79]. CD8+ T cells can be enriched using fluorescence-activated cell sorting (FACS) with anti-CD3ε and anti-CD8 antibodies, with cell viability assessed using trypan blue staining [79].
For scRNA-seq library preparation, the 10x Genomics platform is commonly employed, capturing approximately 3000-6000 cells per sample [77]. Quality control measures should exclude low-quality cells with fewer than 500 detected genes and fewer than 1000 unique molecular identifiers (UMIs) per cell, as well as cells with mitochondrial gene content exceeding 10% [79]. The Scrublet Python package (v0.2.3) can be used to identify and remove doublet cells, applying a preset doublet formation rate of 0.06-0.07 depending on the sample [79].
Data Integration and Batch Correction
The integration of multiple scRNA-seq datasets requires careful batch correction to mitigate technical variations while preserving biological signals. The Seurat package (v4.3.0.1) provides a standard integration workflow that identifies 3000 highly variable genes using the FindVariableFeatures function with the 'vst' method [79]. Batch correction should address variability induced by UMIs and mitochondrial genes through regression analysis using the vars.to.regress argument in the ScaleData function [79].
For CD8+ T cell-specific analyses, re-clustering is typically performed with dimension set to 8 and resolution set to 0.7, enabling identification of finer cellular subtypes [79]. The resulting clusters can be visualized using Unified Manifold Approximation and Projection (UMAP) to assess population structures and identify potential batch effects that require further correction.
Differential Expression and Functional Annotation
Differential gene expression analysis in cross-atlas comparisons should employ multiple methods to ensure robustness. The Wilcoxon rank sum test implemented in the Seurat FindAllMarkers function can identify genes differentially expressed between clusters [79]. Additionally, pseudobulk conversion followed by analysis with DESeq2 (v1.34.0) provides complementary insights, identifying DEGs using adjusted thresholds of p < 0.05 and |log2 FC| > 0.58 [79].
Gene Ontology (GO) enrichment analyses help annotate the functional characteristics of identified CD8+ T cell subsets. For cross-atlas validation, gene set activity can be quantified on a per-cell level by computing the average of log-expression values across all genes in a set for each cell, enabling identification of differential gene set activity between clusters [80].
Diagram 1: Cross-Atlas Analysis Workflow. The end-to-end process for cross-atlas comparison of CD8+ T cells, from sample collection to functional analysis.
Biological Insights from CD8+ T Cell Cross-Atlas Studies
Conserved CD8+ T Cell Subsets Across Human Lifespan
Cross-atlas comparisons have revealed conserved CD8+ T cell subpopulations that maintain consistent transcriptional programs across independent studies. Comprehensive analysis of CD8+ T cells across the human lifespan has identified 11 distinct subpopulations, including naïve cells (with adult and cord blood subtypes), memory stem cells (TSCM), central memory (TCM), three effector memory subpopulations (TEM1-3), two terminally differentiated effector memory cells (TEMRA1-2), and an effector cell subset (TEFF) [77]. These subpopulations exhibit characteristic gene expression patterns, with naïve cells expressing CCR7 and SELL, while effector memory populations express cytotoxic factors like GZMA, CCL5, and KLRB1 [77].
Age-related changes follow consistent patterns across studies, with naïve T cells (TNa) significantly decreasing in percentage with age, while several memory subpopulations (TSCM, TEM3, TEMRA1, and TEMRA2) increase proportionally [77]. These conserved changes highlight the value of cross-atlas comparisons in distinguishing robust biological trends from study-specific variations.
CD8+ T Cell Heterogeneity in Cancer and Inflammation
Integrative mapping of CD8+ T cells across cancer and inflammatory conditions has revealed context-dependent subsets with implications for therapeutic development. The exhaustive capacity of CD8+ T cells manifests in distinct subtypes, including GZMK+ and ITGAE+ exhausted T cells, which are enriched in specific cancer types and exhibit divergent clonal relationships with tissue-resident memory T cells or circulating T cells [5] [32].
Cross-atlas analyses have been particularly valuable in understanding CD8+ T cell behavior in autoimmune conditions and immune-related adverse events, revealing diverse transcriptome and clonal sharing patterns [5]. These findings suggest that exhausted T cell heterogeneity represents a conserved response program across different disease contexts, with implications for immunotherapy development.
Table 2: Conserved CD8+ T Cell Subpopulations Identified Through Cross-Atlas Comparisons
| Cell Subset | Key Marker Genes | Age-Related Change | Functional Characteristics |
|---|---|---|---|
| Naïve (TNa) [77] | CCR7, SELL, TCF7 | Decreases with age | Diverse TCR repertoire; responsive to novel antigens |
| Memory Stem Cell (TSCM) [77] | CCR7, CD45RA, IL-2Rβ | Increases with age | Self-renewal capacity; multipotent differentiation |
| Central Memory (TCM) [77] | CCR7, CD28, CD27 | Stable with age | Lymph node homing; proliferative capacity |
| Effector Memory (TEM1-3) [77] | GZMA, CCL5, KLRB1 | TEM3 increases with age | Tissue surveillance; immediate effector function |
| Terminally Differentiated (TEMRA) [77] | GZMB, KLRG1, CD45RA | Increases with age | Short-lived effectors; high cytotoxic potential |
Implementation Guide: The Scientist's Toolkit
Research Reagent Solutions
Table 3: Essential Research Reagents for CD8+ T Cell Cross-Atlas Studies
| Reagent/Resource | Function | Example Specifications |
|---|---|---|
| Anti-CD3ε antibody [79] | T cell isolation and sorting | Clone BB23-8E6-8C8 (BD Pharmingen); 30min incubation at 4°C |
| CD8β antibody [79] | CD8+ T cell subset discrimination | Used with CD27 and CD11a for subset classification |
| 10x Genomics Platform [81] | Single-cell library preparation | Captures 3000-6000 cells; UMI-based counting |
| Scrublet Package [79] | Doublet detection in scRNA-seq data | Python package v0.2.3; doublet probability score >0.25 |
| Seurat Integration [79] | Multi-dataset batch correction | v4.3.0.1; identifies 3000 HVGs using 'vst' method |
| LICT Annotation Tool [78] | Automated cell type annotation | Multi-LLM integration with credibility assessment |
Visualization Standards for Accessible Data Presentation
Effective visualization is crucial for interpreting complex cross-atlas comparisons. The scatterHatch R package addresses accessibility challenges by creating scatter plots with redundant coding of cell groups using both colors and patterns [82]. This approach is particularly valuable for readers with color vision deficiencies (approximately 8% of males and 0.5% of females) who may struggle to distinguish traditional color-coded groups [82].
For gene expression plots, color scale selection significantly impacts interpretability. Flipping color scales so that low expression values are mapped to lighter colors and high expression to darker colors can enhance visualization when data contain many cells with near-zero expression and few high-expression outliers [83]. This approach prevents cells with near-zero measured expression from dominating the visualization in dark colors, making highly expressing cells more visually prominent [83].
Diagram 2: Validation Framework for Cell Annotation. The iterative process for reliable cell type annotation using LLM-based approaches with credibility assessment.
Future Directions in Cross-Atlas Research
The field of cross-atlas comparison continues to evolve with emerging technologies and methodologies. Multimodal integration represents a promising frontier, combining scRNA-seq data with epigenetic information from scATAC-seq, protein expression from CITE-seq, and spatial context from spatial transcriptomics platforms [81]. These approaches will provide richer context for verifying CD8+ T cell states and functions across independent studies.
Machine learning applications are expanding beyond cell type annotation to predictive modeling of cellular behaviors. The mixed-effect elastic net (MEEN) algorithm can predict the age of individual CD8+ T cells based on transcriptomic features, with these predictions closely associated with cell differentiation state and mutation burden [77]. Such approaches validated across multiple atlases could enable precise characterization of T cell aging in various disease contexts.
As single-cell technologies continue to advance, cross-atlas comparisons will face new challenges and opportunities in managing increasing data scale and complexity. Computational frameworks that can efficiently integrate millions of cells while preserving fine-grained cellular states will be essential for extracting meaningful biological insights from these expansive datasets. The development of standardized benchmarking practices and annotation standards will further enhance the reliability and reproducibility of cross-atlas findings in CD8+ T cell biology.
Advancements in single-cell RNA sequencing (scRNA-seq) have revolutionized our understanding of CD8+ T cell heterogeneity in human health and disease. The development of a comprehensive human CD8+ T cell atlas, integrating over 1.1 million cells from 68 studies across 42 disease conditions, provides an unprecedented resource for the research community [32] [5]. This atlas, enabled by sophisticated deep-learning frameworks like scAtlasVAE, systematically characterizes CD8+ T cell subtypes, their transcriptional states, and T-cell receptor (TCR) clonal dynamics across diverse biological contexts [58]. Such large-scale, integrated references form the essential foundation for identifying robust, biologically meaningful transcriptomic patterns that can be leveraged to construct machine learning-based prognostic signatures. These signatures show remarkable potential for predicting clinical outcomes and therapeutic responses in cancer and inflammatory diseases, ultimately enabling more precise patient stratification and personalized treatment approaches [84] [85] [86].
Computational Framework and Data Integration Strategies
Data Acquisition and Preprocessing
The construction of prognostic models begins with the acquisition of high-quality transcriptomic data. As demonstrated in multiple studies, this typically involves integrating both single-cell and bulk RNA-sequencing data from public repositories such as The Cancer Genome Atlas (TCGA), Gene Expression Omnibus (GEO), and the cBioPortal for Cancer Genomics [84] [87] [85]. Initial processing of scRNA-seq data utilizes the Seurat package (v4.3.0.1) in R, applying quality control filters to remove cells with >25% mitochondrial genes or extreme feature counts [87]. Normalization is performed using the "LogNormalize" method, followed by integration and batch effect correction using algorithms like "ComBat" from the "sva" package or "Harmony" (v0.1.0) [87] [86].
For large-scale atlas construction, the scAtlasVAE framework employs a variational autoencoder (VAE) with a batch-invariant encoder and batch-dependent decoder to effectively integrate data across multiple studies while preserving biological variance [32] [5]. This approach successfully mitigates batch effects that typically complicate cross-study comparisons, enabling the creation of unified reference maps of CD8+ T cell states across diverse disease conditions.
Cell Type Identification and Subset Characterization
Cell type identification is accomplished through unsupervised clustering followed by annotation using canonical marker genes. The "FindAllMarkers" function in Seurat identifies genes with significant expression in specific clusters, using criteria such as a minimum percentage threshold of 0.25, log fold change threshold of 0.25, and adjusted p-value < 0.05 [87]. CD8+ T cell subsets are identified using established markers including CD8A, CD8B, GZMK, and others, with reference databases like CellMarkers providing additional annotation guidance [87].
Table 1: Key CD8+ T Cell Subtypes Identified in Integrated Atlas
| Subtype Category | Specific Subtypes | Key Marker Genes | Functional Characteristics |
|---|---|---|---|
| Naive/Memory | Naive T cells | TCF7, LEF1, CCR7 | Self-renewing, antigen-inexperienced |
| Central/Effector Memory | IL7R, SELL, GZMK | Antigen-experienced, recirculating | |
| Cytotoxic | Recently Activated Effector | GZMB, PRF1, IFNG | Short-lived, highly cytotoxic |
| Innate-like (ILTCK) | KLRC1, ZNF683 | High cytotoxic potential | |
| Tissue-Resident | Tissue-Resident Memory | CD69, ITGAE, CXCR6 | Non-recirculating, tissue-positioned |
| Exhausted | GZMK+ Exhausted | GZMK, HAVCR2, PDCD1 | Progenitor exhausted, responsive to ICB |
| ITGAE+ Exhausted | ITGAE, CXCL13 | Terminal exhausted, tumor-enriched | |
| XBP1+ Exhausted | XBP1, ENTPD1 | Distinct exhausted program | |
| Proliferating | Proliferating | MKI67, TOP2A | Actively cycling |
Signature Construction Methodologies
Feature Selection and Gene Prioritization
The process of identifying CD8+ T cell-related genes (CTRGs) for prognostic model construction employs multiple complementary approaches. Weighted Gene Co-expression Network Analysis (WGCNA) identifies gene modules correlated with CD8+ T cell abundance, as implemented in studies of breast cancer [85]. Univariate Cox regression analysis then screens these genes for prognostic significance, typically using p < 0.05 as a threshold [85] [86]. For cervical cancer, CD8+ T cell heterogeneity analysis through scRNA-seq revealed four distinct subsets (progenitor, intermediate, proliferative, and terminally differentiated), each with unique transcriptomic features that informed prognostic gene selection [84] [87].
Machine Learning Algorithms for Model Construction
Multiple machine learning algorithms are employed to construct robust prognostic signatures. Research demonstrates the implementation of 101 different combinations of 10 distinct ML algorithms to develop prognostic signatures with optimal accuracy and stability [87]. The most frequently utilized algorithms include:
- CoxBoost: Incorporates feature selection while fitting Cox proportional hazards models
- LASSO (Least Absolute Shrinkage and Selection Operator): Performs regularized regression with L1 penalty for feature selection
- Random Survival Forest (RSF): Ensemble tree-based method for survival data
- Stepwise Cox: Stepwise selection based on Akaike information criterion
- Survival Support Vector Machine: Adapts SVM principles to censored survival data
- Generalized Boosted Regression Modeling (GBM): Boosting algorithm for enhancing model performance
In the cervical cancer study, the model with the highest average C-index across validation cohorts was selected as the final model [87]. Similarly, breast cancer research employed eight machine learning algorithms (LASSO, Ridge, SurvReg, StepCox, Survival-SVM, plsRcox, GBM, and CoxBoost) to construct a CD8+ T cell-related prognostic signature (CTR score), with the highest C-index algorithm selected for the final model [85].
Table 2: Machine Learning Algorithms for Prognostic Signature Development
| Algorithm Category | Specific Methods | Key Characteristics | Application Examples |
|---|---|---|---|
| Regularized Regression | LASSO, Ridge, Elastic Net | Prevents overfitting, performs feature selection | Cervical cancer [87], Breast cancer [85] |
| Tree-Based Methods | Random Survival Forest, XGBoost | Handles non-linear relationships, feature importance | Breast cancer [85] |
| Cox-Based Approaches | Stepwise Cox, CoxBoost, plsRcox | Survival-specific, handles censored data | Cervical cancer [87], Thyroid cancer [86] |
| Other ML Approaches | Survival-SVM, GBM | Flexible, captures complex patterns | Breast cancer [85] |
Model Validation and Performance Assessment
Prognostic models require rigorous validation to ensure clinical applicability. Studies typically partition data into training and validation sets (often 60:40 ratio) and utilize external datasets for independent validation [85]. Model performance is evaluated using the concordance index (C-index) and time-dependent receiver operating characteristic (ROC) curves at 1, 3, and 5 years [87] [85]. Kaplan-Meier survival analysis with log-rank tests compares overall survival between high-risk and low-risk groups, while univariate and multivariate Cox regression analyses assess whether the prognostic signature provides independent predictive value beyond standard clinical parameters [85] [86].
Experimental Protocols and Workflows
Comprehensive scRNA-seq Analysis Pipeline
Diagram 1: Integrated scRNA-seq and ML Workflow
Intercellular Communication Analysis
The CellChat toolkit enables systematic analysis of cell-cell communication networks using scRNA-seq data [88] [87]. The protocol involves:
- Database Selection: Using CellChatDB.human to annotate ligand-receptor interactions, focusing on secretory signaling pathways
- Probability Calculation: Computing communication probabilities for overexpressed ligand-receptor pairs
- Significance Assessment: Performing permutation tests to identify statistically significant interactions
- Network Analysis: Identifying top pathways and interaction strengths between cell types
- Visualization: Generating bubble plots and network diagrams to display intercellular communication patterns
In kimchi dietary intervention studies, paired CellChat analysis revealed how antigen-presenting cells enhanced MHC class II-mediated signaling through the JAK/STAT1-CIITA axis [88]. Similarly, in cervical cancer, this approach demonstrated significant interactions between CD8+ T cell subsets and macrophages through CCL-CCR signaling pathways and costimulatory molecules [87].
Pseudotime Trajectory and Regulatory Network Analysis
Pseudotime analysis reconstructs developmental trajectories using Monocle2 (v2.26.0) or Monocle3 [87] [89]. The methodology includes:
- Gene Selection: Identifying genes with average expression ≥ 0.1 for trajectory analysis
- Dimensionality Reduction: Applying "DDRTree" algorithm
- Cell Ordering: Using "orderCells" function to position cells along pseudotime
- Branch Analysis: Identifying key transition genes through BEAM analysis
- Visualization: Plotting trajectories on t-SNE embeddings with dynamic expression heatmaps
For transcriptional regulatory network construction, the pySCENIC workflow (version 0.12.1) implements:
- Co-expression Analysis: Using GRNBoost2 algorithm to form gene co-expression networks
- Motif Enrichment: Applying RcisTarget for cis-regulatory motif analysis
- Regulon Activity Scoring: Utilizing AUCell to calculate regulon activity
- Network Visualization: Employing Cytoscape (version 3.9.1) to illustrate regulatory relationships
In diabetic NOD mice, this approach revealed dynamic transcriptional regulation during CD8+ T cell differentiation and identified exhausted (Texh) and pre-exhausted (Pexh) DN T cell populations that fluctuated throughout disease pathogenesis [43] [89].
Key Reagents and Computational Tools
Table 3: Essential Research Reagents and Computational Tools
| Category | Specific Tool/Reagent | Application Purpose | Key Features |
|---|---|---|---|
| Wet Lab Reagents | Anti-CD3ε Biotin-conjugated | T cell isolation | Magnetic separation of T cells |
| PBMC from blood samples | Immune cell source | Representative systemic immunity | |
| Tumor tissue dissociates | Tumor microenvironment | Preserves tissue-resident cells | |
| Computational Packages | Seurat (v4.3.0.1) | scRNA-seq analysis | Comprehensive single-cell toolkit |
| Monocle2/3 (v2.26.0) | Trajectory analysis | Reconstructs developmental paths | |
| CellChat | Intercellular communication | Maps ligand-receptor interactions | |
| pySCENIC (v0.12.1) | Regulatory networks | Identifies TF-regulon activities | |
| ML & Statistical Tools | glmnet (v4.1) | Regularized regression | Implements LASSO, Ridge, Elastic Net |
| randomForestSRC | Survival forests | Tree-based survival prediction | |
| timeROC (v0.4) | Model validation | Time-dependent ROC analysis | |
| scAtlasVAE | Deep learning integration | Cross-study atlas construction |
Analytical Techniques for Model Interpretation
Tumor Microenvironment Deconvolution
Understanding the relationship between prognostic signatures and the broader tumor microenvironment is crucial. Multiple algorithms enable deconvolution of bulk RNA-seq data to estimate immune cell infiltration:
- CIBERSORT: Estimates relative fractions of 22 immune cell types using support vector regression
- ESTIMATE: Calculates stromal, immune, and combined scores to infer tumor purity
- MCP-counter: Provides absolute abundance scores for eight immune and two stromal cell populations
- xCell: Generates enrichment scores for 64 immune and stromal cell types
- QUANTISEQ: Estimates absolute fractions of 11 immune cell types
In thyroid carcinoma, the exhaustion-related gene score (ERGS) showed a higher prevalence of M2 macrophages in the high-ERGS group, indicating an immunosuppressive microenvironment [86]. Single-cell deconvolution using the 'BisqueRNA' package (v1.0.5) further revealed that SPP1+ macrophages and CD14+ monocyte infiltrations were positively associated with higher ERGS [86].
Functional Enrichment and Pathway Analysis
Gene Set Variation Analysis (GSVA) investigates biological pathway activities across risk groups using the 'GSVA' package (v1.42) with gene sets from The Molecular Signatures Database [86]. Differential pathway activity is identified using the 'limma' package (v3.50), with FDR < 0.01 considered significant. Gene Ontology (GO) and Kyoto Encyclopedia of Genes and Genomes (KEGG) enrichment analyses are performed using the "clusterProfiler" package (v4.8.2) to identify biological processes, molecular functions, and cellular components associated with prognostic genes [85] [86].
Diagram 2: Multi-modal Signature Interpretation
Clinical Translation and Therapeutic Applications
Predictive Biomarkers for Immunotherapy
CD8+ T cell-derived prognostic signatures demonstrate significant value in predicting immunotherapy response. In cervical cancer, the CD8+ T cell-related risk signature effectively stratified patients into responder and non-responder subgroups for anti-PD-L1 therapy [87]. Analysis of immune checkpoint molecule expression revealed distinct patterns between risk groups, with the low-risk group showing better responses to immune checkpoint inhibition [85].
The IMvigor210 cohort, comprising patients with urothelial carcinoma treated with anti-PD-L1 therapy, provides a valuable validation dataset for assessing prognostic signatures [87] [86]. Wilcoxon tests compare risk scores between responder and non-responder subgroups, establishing the clinical utility of CD8+ T cell-based classification.
Drug Repurposing and Combination Therapies
Machine learning approaches applied to CD8+ T cell transcriptomic data have identified promising therapeutic candidates. In cervical cancer, molecular docking and drug screening nominated sorafenib as a potential immunotherapeutic agent [84] [87]. Experimental validation demonstrated that sorafenib enhances CD8+ T cell cytotoxicity by increasing IFN-γ and TNF-α secretion, significantly inhibiting cervical cancer cell invasiveness and survival [84].
Drug sensitivity analysis using the "oncoPredict" R package (Version 0.2) calculates half-maximal inhibitory concentration (IC50) values to represent chemotherapeutic sensitivity across risk groups [85]. This approach identifies tailored therapeutic strategies for patients in different risk categories, potentially enhancing treatment efficacy while minimizing toxicity.
The integration of single-cell transcriptomic atlas data with machine learning algorithms provides a powerful framework for developing robust CD8+ T cell-related prognostic signatures across diverse disease contexts. The comprehensive workflow—from data integration and cell subtype characterization through feature selection, model construction, and clinical validation—enables researchers to transform complex transcriptomic data into clinically actionable tools. As single-cell technologies continue to evolve and reference atlases expand, these approaches will increasingly facilitate precision medicine applications in oncology, autoimmunity, and inflammatory diseases. The ongoing development of deep learning methods like scAtlasVAE for large-scale data integration promises to further enhance the resolution and generalizability of prognostic models, ultimately improving patient stratification and treatment outcomes.
Conclusion
The construction of comprehensive single-cell CD8+ T cell atlases represents a paradigm shift in immunology, providing a unified framework to decipher T cell heterogeneity across health, aging, and disease. The integration of massive datasets via advanced AI, coupled with robust projection and annotation methods, has moved the field from simply cataloging subsets to understanding their functional relationships, developmental trajectories, and clonal dynamics. These resources are already yielding clinically actionable insights, from prognostic signatures in cancers like cervical carcinoma to identifying novel therapeutic candidates. Future efforts must focus on increasing the diversity of donor populations, standardizing annotation practices across the community, and deepening the integration of transcriptomic data with epigenetic, proteomic, and spatial information. This will be crucial for fully realizing the potential of single-cell atlases in guiding the next generation of precision immunotherapies and diagnostic tools.
References
- 1. Naive, effector and memory CD8 T-cell trafficking [https://pmc.ncbi.nlm.nih.gov/articles/PMC3214994/]
- 2. Multiparameter flow cytometric analysis of CD4 and CD8 T cell ... [https://pmc.ncbi.nlm.nih.gov/articles/PMC2515281/]
- 3. Single-cell transcriptomics of human T cells reveals tissue ... [https://www.nature.com/articles/s41467-019-12464-3]
- 4. Analysis of the three-dimensional genome of exhausted ... [https://www.nature.com/articles/s41590-025-02330-4]
- 5. Integrative mapping of human CD8+ T cells in inflammation ... [https://pubmed.ncbi.nlm.nih.gov/39614111/]
- 6. Articles Human effector CD8 + T cells with an activated and ... [https://www.sciencedirect.com/science/article/pii/S2352396424002767]
- 7. CD8 + T cell exhaustion [https://pubmed.ncbi.nlm.nih.gov/30989321/]
- 8. Article Simulating CD8 T cell exhaustion [https://www.sciencedirect.com/science/article/pii/S2589004225011587]
- 9. Review Decoding immune aging at single-cell resolution [https://www.sciencedirect.com/science/article/abs/pii/S1471490625002200]
- 10. Single-cell atlas of healthy human blood unveils age ... [https://pubmed.ncbi.nlm.nih.gov/37963457/]
- 11. Single-cell atlas of healthy human blood unveils age ... [https://explore.data.humancellatlas.org/projects/896f377c-8e88-463e-82b0-b2a5409d6fe4]
- 12. General and individualized changes in T cell immunity ... [https://pmc.ncbi.nlm.nih.gov/articles/PMC12123213/]
- 13. Multi-omic profiling reveals age-related immune dynamics ... [https://www.nature.com/articles/s41586-025-09686-5]
- 14. Enhanced cytotoxicity of aging associated NKG2C + CD8 + T ... [https://arthritis-research.biomedcentral.com/articles/10.1186/s13075-025-03585-w]
- 15. Single-cell immune aging clocks reveal inter-individual ... [https://pubmed.ncbi.nlm.nih.gov/40044970/]
- 16. Interpretation of T cell states from single ... [https://www.nature.com/articles/s41467-021-23324-4]
- 17. CD8+ T cell states in human cancer - PubMed Central - NIH [https://pmc.ncbi.nlm.nih.gov/articles/PMC7115982/]
- 18. Single-cell transcriptomics of human T cells reveals tissue and ... [https://pmc.ncbi.nlm.nih.gov/articles/PMC6797728/]
- 19. Single-cell atlas of healthy human blood unveils age ... [https://www.sciencedirect.com/science/article/pii/S1074761323004533]
- 20. Current annotation strategies for T cell phenotyping of ... [https://www.frontiersin.org/journals/immunology/articles/10.3389/fimmu.2023.1306169/full]
- 21. CD8+ T cell metabolic rewiring defined by scRNA-seq ... [https://www.sciencedirect.com/science/article/pii/S2211124722015108]
- 22. Single-cell analysis by mass cytometry reveals metabolic ... [https://www.sciencedirect.com/science/article/pii/S1074761321000844]
- 23. Early-life human CD8+ T cells exhibit rapid, short-lived ... [https://pmc.ncbi.nlm.nih.gov/articles/PMC12337316/]
- 24. Effector, Memory, and Dysfunctional CD8+ T Cell Fates in the ... [https://pmc.ncbi.nlm.nih.gov/articles/PMC4893440/]
- 25. A unified atlas of CD8 T cell dysfunctional states in cancer and ... [https://pubmed.ncbi.nlm.nih.gov/33891860/]
- 26. Dysfunction of exhausted T cells is enforced by MCT11- ... [https://www.nature.com/articles/s41590-024-01999-3]
- 27. Single‐cell RNA‐seq reveals a microenvironment and an ... [https://pmc.ncbi.nlm.nih.gov/articles/PMC10551605/]
- 28. Human single cell RNA-sequencing reveals a targetable ... [https://www.nature.com/articles/s41467-024-54569-4]
- 29. NK cell exhaustion in Wilson's disease revealed by single ... [https://elifesciences.org/articles/98867]
- 30. Atlas Aims [https://huarc.net/v2/atlas/]
- 31. Integrative mapping of human CD8+ T cells in inflammation ... [https://bms.zju.edu.cn/bmsen/2024/1225/c85258a3007024/page.htm]
- 32. a deep learning framework for generating a human CD8+ T ... [https://www.nature.com/articles/s41568-025-00811-0]
- 33. Chapter 9 Heatmap Color Palette | Single Cell Multi-Omics ... [https://bookdown.org/ytliu13207/SingleCellMultiOmicsDataAnalysis/heatmap-color-palette.html]
- 34. Palo: Spatially-aware color palette optimization for single-cell ... [https://winnie09.github.io/Wenpin_Hou/pages/Palo.html]
- 35. ProjecTILs human reference atlas of CD8+ tumor ... [https://figshare.com/articles/dataset/ProjecTILs_human_reference_atlas_of_CD8_tumor-infiltrating_T_cells_CD8_TIL_version_1/23608308]
- 36. Single-cell RNA-seq reveals disease-specific CD8+ T ... [https://pubmed.ncbi.nlm.nih.gov/40106422]
- 37. a deep learning method for integrating paired single-cell RNA ... [https://genomebiology.biomedcentral.com/articles/10.1186/s13059-023-03129-y]
- 38. Evaluation of T Cell Receptor Construction Methods from ... [https://pmc.ncbi.nlm.nih.gov/articles/PMC11846667/]
- 39. Reproducible single-cell annotation of programs ... [https://www.nature.com/articles/s41592-025-02793-1]
- 40. Integrating single-cell RNA and T cell/B cell receptor ... [https://www.nature.com/articles/s41590-024-02059-6]
- 41. A guide to multi-omics data collection and integration for ... [https://pmc.ncbi.nlm.nih.gov/articles/PMC9747357/]
- 42. Sketching T cell atlases in the single‐cell era: challenges and ... [https://pmc.ncbi.nlm.nih.gov/articles/PMC12392707/]
- 43. Single-cell RNA-seq reveals disease-specific CD8+ T cell ... [https://journals.plos.org/plosone/article?id=10.1371/journal.pone.0317987]
- 44. Single-cell RNA sequencing reveals different cellular ... [https://www.nature.com/articles/s41523-025-00808-w]
- 45. Single‐cell RNA sequencing technologies and applications [https://pmc.ncbi.nlm.nih.gov/articles/PMC8964935/]
- 46. Single-cell RNA-seq reveals cell type-specific molecular ... [https://www.nature.com/articles/s41392-025-02438-x]
- 47. Tumor evolution and immune microenvironment dynamics in ... [https://pmc.ncbi.nlm.nih.gov/articles/PMC12490240/]
- 48. Current annotation strategies for T cell phenotyping of single ... [https://pmc.ncbi.nlm.nih.gov/articles/PMC10768068/]
- 49. Integrating Deep Supervised, Self ... [https://pmc.ncbi.nlm.nih.gov/articles/PMC7397036/]
- 50. scBubbletree: computational approach for visualization of ... [https://bmcbioinformatics.biomedcentral.com/articles/10.1186/s12859-024-05927-y]
- 51. a semi-supervised clustering model for single-cell RNA-seq data [https://bmcbioinformatics.biomedcentral.com/articles/10.1186/s12859-023-05339-4]
- 52. Integrating single-cell RNA-seq datasets with substantial ... [https://pmc.ncbi.nlm.nih.gov/articles/PMC12577435/]
- 53. Integrating single-cell RNA-seq datasets with substantial ... [https://bmcgenomics.biomedcentral.com/articles/10.1186/s12864-025-12126-3]
- 54. Highly effective batch effect correction method for RNA-seq ... [https://pmc.ncbi.nlm.nih.gov/articles/PMC11718288/]
- 55. Minireview Integration of Single-Cell RNA-Seq Datasets [https://www.sciencedirect.com/science/article/pii/S101684782300016X]
- 56. Reference-informed evaluation of batch correction for ... [https://www.nature.com/articles/s42003-025-07947-7]
- 57. A unified atlas of CD8 T cell dysfunctional states in cancer and ... [https://pmc.ncbi.nlm.nih.gov/articles/PMC8454502/]
- 58. New AI tool maps millions of CD8+ T cells to advance ... [https://www.news-medical.net/news/20241204/New-AI-tool-maps-millions-of-CD82b-T-cells-to-advance-disease-research.aspx]
- 59. Multimodal single-cell datasets characterize antigen- ... [https://www.nature.com/articles/s41590-023-01608-9]
- 60. HArmonized single-cell RNA-seq Cell type Assisted ... [https://pmc.ncbi.nlm.nih.gov/articles/PMC10619225/]
- 61. Benchmarking atlas-level data integration in single-cell ... [https://www.nature.com/articles/s41592-021-01336-8]
- 62. Benchmarking and optimizing organism wide single-cell ... [https://arxiv.org/html/2503.20730v1]
- 63. Single-cell transcriptomics of human T cells reveals tissue ... [https://explore.data.humancellatlas.org/projects/4a95101c-9ffc-4f30-a809-f04518a23803]
- 64. Fully-automated and ultra-fast cell-type identification using ... [https://www.nature.com/articles/s41467-022-28803-w]
- 65. Tumour-reactive heterotypic CD8 T cell clusters from ... [https://www.nature.com/articles/s41586-025-09754-w]
- 66. How to Reliably Define Human CD8+ T-Cell Subsets [https://pmc.ncbi.nlm.nih.gov/articles/PMC8559543/]
- 67. Cross-species single-cell analysis reveals divergence and ... [https://bmcgenomics.biomedcentral.com/articles/10.1186/s12864-024-11030-6]
- 68. In-depth cross-validation of human and mouse CD4 ... [https://pmc.ncbi.nlm.nih.gov/articles/PMC11373626/]
- 69. Cross-species single-cell RNA-seq analysis reveals ... [https://www.nature.com/articles/s42003-024-07315-x]
- 70. CD8 T-cell subsets: heterogeneity, functions, and ... [https://www.nature.com/articles/s12276-023-01105-x]
- 71. Immunogenomic characteristics and prognostic ... [https://www.frontiersin.org/journals/immunology/articles/10.3389/fimmu.2025.1601188/full]
- 72. CD8+ T Cell Subsets as Biomarkers for Predicting ... [https://www.mdpi.com/2227-9059/13/4/930]
- 73. breast cancer: A retrospective cohort study | PLOS Medicine [https://journals.plos.org/plosmedicine/article?id=10.1371/journal.pmed.1004647]
- 74. CD8+ T-cell differentiation and dysfunction inform ... [https://www.sciencedirect.com/science/article/pii/S0006497124013740]
- 75. Whole-body CD8+ T cell visualization before and during ... [https://www.nature.com/articles/s41591-022-02084-8]
- 76. Single-cell transcriptomics reveals CD8 + T cell structure ... [https://www.sciencedirect.com/science/article/pii/S0161589024001184]
- 77. Heterogeneity and transcriptome changes of human CD8 ... [https://www.nature.com/articles/s41467-022-32869-x]
- 78. Evaluation of cell type annotation reliability using a large ... [https://www.nature.com/articles/s42003-025-08745-x]
- 79. Single-Cell RNA-Sequencing Reveals Heterogeneity and ... [https://pmc.ncbi.nlm.nih.gov/articles/PMC11049515/]
- 80. Chapter 7 Cell type annotation | Basics of Single- ... [https://bioconductor.org/books/3.13/OSCA.basic/cell-type-annotation.html]
- 81. A Review of Single-Cell RNA-Seq Annotation, Integration, and ... [https://pmc.ncbi.nlm.nih.gov/articles/PMC10417635/]
- 82. Generating colorblind-friendly scatter plots for single-cell data [https://elifesciences.org/articles/82128]
- 83. Better Color Scales for Gene Expression Plots [https://singlecell.broadinstitute.org/single_cell/features/2021-12-09-better-color-scales-for-genetic-expression-plots]
- 84. Single-cell transcriptomic analysis reveals CD8 + T ... [https://pubmed.ncbi.nlm.nih.gov/40102789/]
- 85. Integration of Bioinformatics and Machine Learning to ... [https://www.mdpi.com/2073-4425/15/8/1093]
- 86. Novel T cell exhaustion gene signature to predict ... [https://www.nature.com/articles/s41598-024-58419-7]
- 87. Single-cell transcriptomic analysis reveals CD8 + T cell ... [https://bmccancer.biomedcentral.com/articles/10.1186/s12885-025-13901-x]
- 88. Single-cell RNA sequencing reveals that kimchi dietary ... [https://www.nature.com/articles/s41538-025-00593-7]
- 89. Single-cell RNA-seq reveals disease-specific CD8+ T ... [https://pmc.ncbi.nlm.nih.gov/articles/PMC11922263/]