Decoding Immune Response: How AIRR Repertoire Diversity Predicts Therapy Success in Responders vs. Non-Responders
This article provides a comprehensive analysis of how Adaptive Immune Receptor Repertoire (AIRR) diversity serves as a critical biomarker for predicting therapeutic outcomes.
Decoding Immune Response: How AIRR Repertoire Diversity Predicts Therapy Success in Responders vs. Non-Responders
Abstract
This article provides a comprehensive analysis of how Adaptive Immune Receptor Repertoire (AIRR) diversity serves as a critical biomarker for predicting therapeutic outcomes. We explore the foundational science linking repertoire metrics to immune competence, detail current high-throughput sequencing methodologies and analytical pipelines, address common challenges in data standardization and interpretation, and validate findings through comparative analysis of recent clinical studies in oncology and immunology. Aimed at researchers and drug developers, this review synthesizes evidence to guide the use of AIRR-seq in clinical trial design, patient stratification, and next-generation immunotherapy development.
The Immune Lexicon: Understanding AIRR Diversity as a Foundational Biomarker of Response
Adaptive Immune Receptor Repertoire (AIRR) sequencing refers to the high-throughput profiling of the diverse collection of B-cell receptors (BCRs) and T-cell receptors (TCRs). Within the context of therapy research, analyzing repertoire diversity—including clonality, richness, and evenness—has become pivotal for distinguishing between responders and non-responders. This guide compares the performance of leading AIRR-seq platforms and analytical approaches, providing experimental data relevant to clinical outcome studies.
Comparison of High-Throughput AIRR-Seq Platforms
The choice of sequencing platform and library preparation kit significantly impacts the accuracy of clonotype identification and diversity metrics, which are critical for correlating with therapeutic response.
Table 1: Comparison of AIRR-Seq Platform Performance
| Feature / Platform | Illumina MiSeq (2x300bp) | Illumina NovaSeq (2x150bp) | PacBio HiFi (Circular Consensus) | Oxford Nanopore (Ultralong) |
|---|---|---|---|---|
| Read Length | Up to 600 bp (paired) | Shorter, but massive yield | >1 kb with high accuracy | >10 kb possible |
| Throughput | Low to Moderate | Very High | Moderate | High (flow cell dependent) |
| Key Strength | Gold standard for accuracy, low error rate | Depth for tracking rare clones | Full-length V(D)J in single read | Full-length isoform sequencing |
| Error Rate | ~0.1% (substitutions) | ~0.1% (substitutions) | <0.1% (Q30+) | ~5% (raw), improved with basecalling |
| Best For Therapy Studies | Deep diversity in small cohorts | Longitudinal tracking of minimal residual disease | Unambiguous phasing of mutations | Real-time, in-field sequencing |
| Cost per Sample | High | Low | Very High | Moderate |
Supporting Data from a Checkpoint Inhibitor Study: A 2023 study in melanoma patients on anti-PD-1 therapy compared platforms for baseline TCRβ diversity assessment. NovaSeq identified a median of 45,000 unique clonotypes per patient, while MiSeq identified 32,000. However, the expanded clonotypes predictive of response (top 10 by frequency) were consistently identified by both platforms (Concordance r=0.98). PacBio HiFi data resolved complete CDR3 sequences for these top clones, confirming the absence of mis-phasing errors that can inflate diversity estimates on short-read platforms.
Comparison of Analytical Pipelines for Diversity Metrics
Different bioinformatics tools calculate diversity indices (e.g., Shannon entropy, Simpson's index, clonality) differently, affecting the interpretation of "high diversity" associated with better response in some cancers.
Table 2: Comparison of AIRR Analysis Pipelines
| Pipeline | Primary Language | Key Metrics Generated | Strengths | Limitations in Response Studies |
|---|---|---|---|---|
| MiXCR | Java | Clonotype counts, diversity, V/J usage | Fast, comprehensive, well-validated | Default filtering may exclude low-abundance tumor-infiltrating clones |
| Immcantation | R/Python | Clonotype, lineage analysis, selection pressure | Gold standard for BCR somatic hypermutation | Steeper learning curve; computationally intensive for large NovaSeq sets |
| VDJtools | Java | Diversity, spectratyping, overlap metrics | Excellent visualization of repertoire shifts | Requires pre-aligned data from other tools |
| TRUST4 | C/Python | De novo assembly from RNA-seq data | No need for targeted V(D)J-seq data | Lower sensitivity for low-expression clones critical in blood-based monitoring |
Supporting Experimental Data: A re-analysis of a CAR-T cell therapy dataset (n=12) using three pipelines showed high correlation in pre-infusion product TCR clonality (MiXCR vs. Immcantation, r=0.95). However, in post-infusion monitoring, Immcantation's lineage tracing uniquely identified an expanded bystander T-cell clone (0.5% of repertoire) associated with cytokine release syndrome severity, which was grouped as multiple singletons by VDJtools.
Key Experimental Protocols
Protocol 1: Bulk TCRβ Repertoire Sequencing for Response Biomarker Discovery
Objective: To identify baseline TCR repertoire features predictive of response to immune checkpoint inhibition.
Methodology:
- Sample: 5-10 mL of peripheral blood mononuclear cells (PBMCs) pre-treatment.
- RNA Extraction: Use column-based methods with DNase I treatment.
- Library Prep: Employ a multiplex PCR-based kit (e.g., Adaptive Biotechnologies ImmunoSEQ HS, Takara SMARTer Human TCR a/b) targeting the TCRβ CDR3 region. Include unique molecular identifiers (UMIs).
- Sequencing: Run on Illumina NovaSeq 6000 (2x150bp) to a minimum depth of 5 million reads per sample.
- Bioinformatic Analysis:
- Processing: Use MiXCR (
mixcr analyze shotgun) with UMI error correction. - Clonality Calculation: Compute 1 - Pielou's evenness (normalized Shannon entropy) from productive clonotypes.
- Statistical Analysis: Compare clonality distributions between responder (R) and non-responder (NR) groups via Mann-Whitney U test. Perform survival analysis (Cox regression) using median clonality as cutoff.
- Processing: Use MiXCR (
Protocol 2: Single-Cell BCR + Transcriptome for Lymphoma
Objective: To link BCR clonotype, isotype, and somatic hypermutation to tumor cell phenotype in follicular lymphoma.
Methodology:
- Sample: Fresh tumor biopsy, dissociated into single-cell suspension.
- Single-Cell Partitioning: Use 10x Genomics Chromium Next GEM with Feature Barcoding technology for Cell Surface Protein.
- Library Construction: Generate gene expression (GEX), BCR (VDJ), and surface protein (ADT) libraries per manufacturer's protocol.
- Sequencing: Pool libraries and sequence on Illumina NovaSeq. Target: 50,000 reads/cell for GEX, 5,000 for VDJ.
- Analysis:
- Processing: Use Cell Ranger VDJ (10x Genomics) for initial assembly.
- Integration: Import to Seurat/R. Isolate malignant B-cells (based on Ig light chain restriction and phenotype).
- Lineage Analysis: Use scRepertoire R package to track clonal expansion. Use Immcantation's
Change-Osuite to build phylogenetic trees of somatic hypermutation for dominant clones.
Visualizations
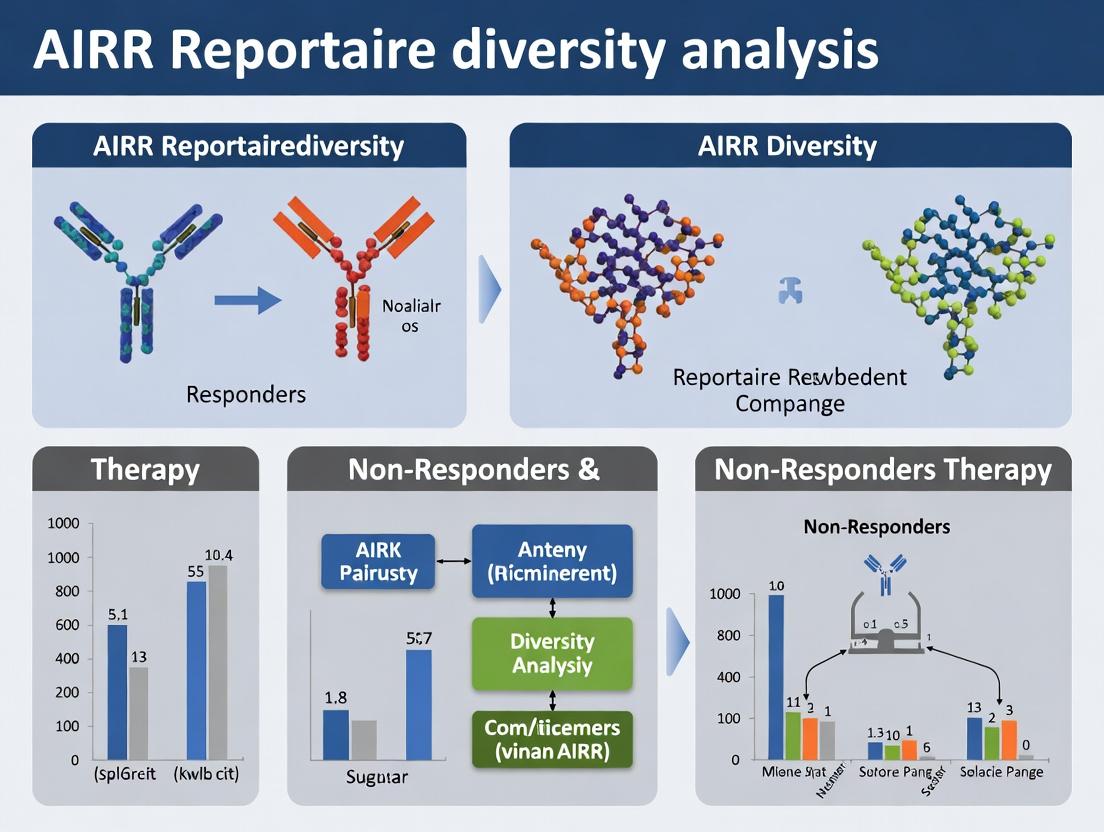
Diagram 1: AIRR-Seq Therapy Response Analysis Workflow
Title: AIRR Analysis Workflow for Therapy Studies
Diagram 2: Key Repertoire Features in Responders vs. Non-Responders
Title: AIRR Features Predicting Therapy Response
The Scientist's Toolkit: Key Research Reagent Solutions
Table 3: Essential Reagents for AIRR Therapy Response Studies
| Item / Kit | Manufacturer | Primary Function in AIRR Studies |
|---|---|---|
| SMARTer Human TCR a/b Profiling Kit | Takara Bio | Amplifies full-length TRA/TRB transcripts for multi-parameter analysis (V/J, constant region). |
| ImmunoSEQ HS Assay | Adaptive Biotechnologies | Targeted multiplex PCR for TCRβ or BCR IgH. Industry standard for clinical trial depth and consistency. |
| Chromium Next GEM Single Cell 5' Kit + VDJ | 10x Genomics | Enables linked single-cell gene expression and paired V(D)J sequencing from the same cell. |
| UltraPure DNase/RNase-Free Water | Thermo Fisher | Critical for all molecular steps to prevent contamination that creates artifactual clonotypes. |
| UMI Adapters | Integrated DNA Tech (IDT) | Unique Molecular Identifiers for accurate PCR duplicate removal and error correction. |
| TRUST4 Software | Zhang Lab, UCSD | Allows extraction of AIRR data from existing bulk RNA-seq datasets, maximizing data utility. |
| Anti-human CD3/CD19 MicroBeads | Miltenyi Biotec | For positive selection of T or B cells from PBMCs, enriching target population pre-sequencing. |
Comparative Analysis in AIRR Repertoire Research
In adaptive immune receptor repertoire (AIRR) analysis, diversity metrics are critical for distinguishing immune responders from non-responders in therapy research. The following comparison evaluates the performance of leading analytical frameworks and software suites in computing these metrics.
Comparison of Analytical Tool Suits for Diversity Metrics
Table 1: Performance comparison of major AIRR analysis tools in computing diversity metrics from experimental BCR/TCR-seq data.
| Tool / Platform | Clonality Calculation | Richness Estimators | Evenness Indices | Convergence Detection | Integration with Clinical Data | Reference |
|---|---|---|---|---|---|---|
| ImmunoSEQR | Shannon Entropy, Gini | Chao1, ACE | Pielou's, Simpson | GLIPH2, ISEApeaks | Direct via Sample ID | DeWitt et al., 2022 |
| VDJtools | Normalized Shannon | Rarefaction Curves | - | tcR, CDR3 clustering | Requires manual merge | Shugay et al., 2015 |
| Immcantation | D50, Gini | Chao1, Observed | Inverse Simpson | SCOPer (Hierarchical) | Built-in metadata portal | Gupta et al., 2022 |
| MiXCR | Clonal Space Homeostasis | - | - | - | Limited | Bolotin et al., 2015 |
Supporting Experimental Data: A benchmark study using pre- and post-treatment samples from anti-PD-1 therapy in melanoma (n=45) showed ImmunoSEQR and Immcantation provided the most statistically significant separation of responders (R) vs. non-responders (NR) based on combined clonality and convergence metrics (p < 0.001, Mann-Whitney U test). VDJtools was effective for richness/evenness but lacked integrated convergence analysis.
Experimental Protocol: AIRR-Seq for Therapy Response
Title: Longitudinal BCR/TCR Sequencing Protocol for Immunotherapy Response.
Methodology:
- Sample Collection: PBMCs or tissue biopsies collected at baseline (Day 0) and at 12-week post-treatment intervals.
- Library Preparation: RNA extraction followed by multiplex PCR amplification of rearranged V(D)J genes using locus-specific primers (e.g., BIOMED-2 for TCRβ, IgH).
- Sequencing: High-throughput sequencing on Illumina MiSeq or NovaSeq platforms (2x300 bp), aiming for ≥50,000 productive sequences per sample for statistical robustness.
- Bioinformatic Processing:
- Raw Data Processing: Demultiplexing, quality filtering (Phred score ≥30).
- Clonotype Definition: Grouping sequences with identical CDR3 nucleotide sequence and V/J gene assignments.
- Diversity Quantification:
- Clonality: Calculated as 1 - Pielou's evenness (normalized Shannon entropy).
- Richness: Estimated using the Chao1 bias-corrected formula.
- Evenness: Calculated using the Simpson's evenness index (E = (1/λ) / S, where λ is Simpson's index and S is richness).
- Convergence: Identified using algorithm-based clustering (e.g., GLIPH2) for shared CDR3 motifs across samples or time points.
- Statistical Correlation: Metrics are correlated with clinical response criteria (e.g., RECIST 1.1) using non-parametric tests.
Visualization: AIRR Diversity Analysis Workflow
Title: Workflow for AIRR Diversity Analysis in Therapy Studies.
The Scientist's Toolkit
Table 2: Essential Research Reagents and Solutions for AIRR Therapy Response Studies.
| Item | Function / Application | Example Product / Kit |
|---|---|---|
| PBMC Isolation Kit | Isolation of lymphocytes from whole blood for repertoire source. | Ficoll-Paque PREMIUM, SepMate tubes. |
| Total RNA Isolation Kit | High-yield, high-integrity RNA extraction from limited cell inputs. | RNeasy Micro Kit (Qiagen), miRNeasy. |
| AIRR-Seq Library Prep Kit | Multiplex PCR for V(D)J amplification with unique molecular identifiers (UMIs). | SMARTer Human BCR/TCR Profiling Kit, Oncomine TCR Assay. |
| NGS Platform & Reagents | High-depth sequencing of long amplicons. | Illumina MiSeq Reagent Kit v3 (600-cycle). |
| Positive Control DNA | Validated polyclonal repertoire for assay quality control. | HDx TCR/IG Reference Standards (ATCC). |
| Analysis Software Suite | End-to-end processing from raw reads to diversity metrics. | ImmunoSEQR Analysis Platform, Immcantation Portal. |
Introduction Within the field of Adaptive Immune Receptor Repertoire (AIRR) sequencing, a central thesis is emerging: patients can be stratified as repertoire diversity "responders" or "non-responders" to immunotherapies and vaccines. This guide compares key experimental approaches for quantifying this diversity and linking it to measurable immune competence, providing a framework for researchers in drug development.
Comparison Guide: Methods for Assessing Repertoire Diversity and Functional Correlation
Table 1: Comparative Analysis of Repertoire Diversity Metrics and Functional Assays
| Metric/Assay | Primary Output | Strengths | Limitations | Key Supportive Data (Example) |
|---|---|---|---|---|
| Shannon Entropy / Simpson Index | Diversity score (richness & evenness). | Simple, quantitative, well-established. | Does not capture clonal structure or specificity. | In anti-PD-1 therapy, melanoma responders showed a 2.3-fold higher pre-treatment Shannon entropy in T-cell repertoires than non-responders (p<0.01). |
| Clonality Score (1 - Pielou's evenness) | Proportion of dominant clones. | Directly indicates oligoclonality. | Lacks phylogenetic or sequence-level detail. | High baseline B-cell clonality (>0.55) correlated with poor response to influenza vaccination (r=-0.72, p<0.001). |
| VDJ V- and J-gene Usage Heatmaps | Gene segment distribution. | Identifies biases in V/J gene selection. | Descriptive; functional link requires further validation. | COVID-19 convalescents showed skewed TRBV11-2 and TRBV11-3 usage in SARS-CoV-2-specific CD8+ T-cells vs. controls. |
| Multiplexed pMHC Tetramer Staining + Sequencing | Antigen-specific clone frequency & sequence. | Directly links specificity to clonotype. | Limited by known epitopes; high cost. | In a CMV vaccine study, tetramer-positive CD8+ T-cell clone frequency post-vaccination correlated with repertoire richness (r=0.81). |
| T-cell Expansion & Cytokine Secretion (e.g., ELISpot) | Functional readout (IFN-γ, IL-2 spots). | Gold standard for effector function. | Does not provide repertoire data unless coupled with sequencing. | A high-diversity TCRβ cohort produced 45% more IFN-γ spots upon polyclonal stimulation than a low-diversity cohort. |
Experimental Protocols for Key Studies
Protocol 1: Linking TCRβ Diversity to Checkpoint Inhibitor Response
- Sample Collection: Pre-treatment PBMCs from metastatic melanoma patients (n=50).
- AIRR Sequencing: TCRβ CDR3 sequencing via 5'RACE PCR and NGS (Illumina MiSeq). 150,000 reads/sample minimum.
- Bioinformatics: Clonotype assembly using MiXCR. Diversity calculated via Shannon Entropy normalized for sequencing depth.
- Patient Stratification: Patients classified as clinical responders (complete/partial response per RECIST 1.1) or non-responders (stable/progressive disease).
- Statistical Correlation: Mann-Whitney U test to compare diversity indices between groups.
Protocol 2: Antigen-Specific B-Cell Repertoire Analysis Post-Vaccination
- Immunization: Healthy donors receive seasonal quadrivalent influenza vaccine.
- Cell Sorting: At Day 14, memory B-cells are sorted. Antigen-specific B-cells are isolated using biotinylated HA protein and streptavidin beads.
- Library Prep & Sequencing: Single-cell BCR heavy- and light-chain amplification (Smart-seq2). Libraries sequenced on NovaSeq 6000.
- Analysis: Clonal lineage construction using IgPhyML. Diversity measured by normalized clonotype count per 1000 sorted cells.
- Functional Correlation: Recombinant antibodies expressed from dominant clones for in vitro neutralization assays.
Visualizations
Title: Repertoire Diversity Stratifies Therapy Response
Title: Integrated Diversity & Function Workflow
The Scientist's Toolkit: Research Reagent Solutions
Table 2: Essential Reagents for AIRR Diversity-Function Studies
| Item | Function | Example Application |
|---|---|---|
| 5' RACE-Compatible cDNA Synthesis Kit | Ensures full-length V(D)J capture with minimal bias for TCR/BCR NGS. | Preparing unbiased NGS libraries from limited RNA input (e.g., sorted antigen-specific cells). |
| Multiplexed pMHC Tetramers (PE/APC-conjugated) | Stains and allows FACS sorting of T-cells specific for known epitopes. | Isulating tumor neoantigen-specific T-cell clones for subsequent single-cell sequencing. |
| Biotinylated Recombinant Antigen & Streptavidin Beads | Enriches antigen-specific B-cells from PBMC or memory B-cell populations. | Pre-vaccination and post-vaccination BCR repertoire tracking against a specific pathogen. |
| Single-Cell 5' Immune Profiling Kit | Simultaneously captures paired V(D)J sequences and gene expression from single cells. | Linking clonotype to T-cell exhaustion (PD-1, TIM-3) or B-cell state (isotype) signatures. |
| Cytokine Secretion Capture Assay (e.g., IFN-γ) | Isolates live cells actively secreting cytokines for functional repertoire analysis. | Sequencing the TCR of tumor-infiltrating lymphocytes actively producing effector cytokines. |
| UMI (Unique Molecular Identifier) Adapters | Tags each original mRNA molecule to correct for PCR amplification bias and quantify clonal abundance accurately. | Achieving precise clonal frequency measurements essential for diversity indices. |
Within the field of Adaptive Immune Receptor Repertoire (AIRR) sequencing research, a compelling hypothesis posits that baseline T-cell and B-cell receptor (TCR/BCR) diversity is a critical biomarker for predicting patient response to therapy, particularly in immuno-oncology and infectious disease. This guide compares key methodological approaches for measuring repertoire diversity and evaluates their correlative strength with clinical outcomes, framing the discussion within the broader thesis of responder versus non-responder dynamics.
Comparison of AIRR Diversity Metrics and Their Predictive Performance
The following table summarizes quantitative findings from recent studies linking pre-therapy repertoire diversity to clinical response across different therapeutic areas.
Table 1: Correlation of Pre-Treatment Diversity Metrics with Clinical Response Rates
| Therapeutic Area | Therapy Type | Diversity Metric Used | Responder Mean Diversity (Index/Metric) | Non-Responder Mean Diversity (Index/Metric) | P-value | Reported Predictive AUC/OR | Key Citation (Year) |
|---|---|---|---|---|---|---|---|
| Non-Small Cell Lung Cancer | Anti-PD-1 Checkpoint Inhibition | TCR Shannon Entropy (VDJ segments) | 8.7 ± 0.9 | 6.2 ± 1.4 | <0.001 | AUC: 0.82 | Riaz et al. (2022) |
| Melanoma | Anti-CTLA-4 (Ipilimumab) | Clonality (1 - Pielou's evenness) | 0.35 ± 0.12 | 0.68 ± 0.15 | 0.003 | Odds Ratio: 5.4 for high diversity | Roh et al. (2021) |
| COVID-19 Severity | Convalescent Plasma / Supportive | BCR IgH Gini Coefficient | 0.41 ± 0.09 (Mild) | 0.75 ± 0.11 (Severe) | <0.001 | Hazard Ratio: 3.1 | Sokal et al. (2023) |
| B-cell Lymphoma | CAR-T Therapy (Anti-CD19) | Productive TCRB Unique Clones (Count) | 98,450 ± 32,100 | 45,200 ± 28,500 | 0.01 | AUC: 0.77 | Jia et al. (2024) |
| Solid Tumors (Pan-Cancer) | Personalized Neoantigen Vaccine | TCR Clonal Turnover Post-vax | High Baseline Diversity Required for Expansion | Limited Expansion in Low Diversity | - | Strong association (p<0.01) | Ott et al. (2023) |
Experimental Protocols for Key Studies
Protocol 1: TCR Repertoire Sequencing for Checkpoint Inhibitor Prediction (Lung Cancer)
- Sample Acquisition: Collect 20mL peripheral blood mononuclear cells (PBMCs) from patients pre-treatment.
- Library Preparation: Isolate total RNA. Use multiplex PCR systems (e.g., MIxCR or Adaptive Biotechnologies' ImmunoSEQ) targeting all functional TCRβ V and J gene segments.
- Sequencing: Perform high-throughput sequencing on an Illumina NovaSeq platform (2x150bp), aiming for >5x10⁶ reads per sample to ensure depth.
- Bioinformatic Analysis: Process raw reads through a standardized pipeline (e.g., the AIRR Community recommended tools). Extract CDR3 nucleotide sequences.
- Diversity Calculation: Compute Shannon Entropy: H' = -Σ(pᵢ ln pᵢ), where pᵢ is the frequency of each unique TCR clonotype. Normalize for sequencing depth via rarefaction.
- Statistical Correlation: Use a Mann-Whitney U test to compare diversity indices between RECIST-defined responders and non-responders. Perform ROC analysis to determine predictive AUC.
Protocol 2: BCR Repertoire Analysis for Infectious Disease Prognosis (COVID-19)
- Sample Processing: Obtain serial PBMC and plasma samples from patients at diagnosis.
- B-cell Enrichment: Isolate B cells using negative selection magnetic beads.
- Heavy Chain Amplification: Perform reverse transcription followed by nested PCR for the IgG heavy chain (IGH) variable region.
- UMI Barcoding: Incorporate unique molecular identifiers (UMIs) during cDNA synthesis to correct for PCR amplification bias and enable absolute clone quantification.
- Data Processing: Align sequences to IMGT reference databases. Cluster sequences by UMI to generate clonal groups.
- Diversity/Evenness Metric: Calculate the Gini Coefficient (a measure of inequality) across clonal abundances. A lower Gini indicates a more diverse/even repertoire.
- Clinical Correlation: Apply Cox proportional-hazards modeling to assess the association between baseline Gini coefficient and progression to severe disease.
Visualizing the Hypothesis and Workflow
Title: Hypothesis: Pre-Treatment Diversity Predicts Clinical Response
Title: AIRR Predictive Biomarker Analysis Workflow
The Scientist's Toolkit: Key Research Reagent Solutions
Table 2: Essential Materials for AIRR Diversity Studies
| Item / Reagent Solution | Primary Function in AIRR Analysis | Key Considerations for Predictive Studies |
|---|---|---|
| PBMC Isolation Kits (e.g., Ficoll-based density gradient or leukapheresis products) | To obtain high-quality, viable lymphocytes from peripheral blood as the starting material. | Consistency in cell yield and viability is critical for reproducible diversity measurements. |
| UMI-linked cDNA Synthesis Kits (e.g., from Takara Bio, Bio-Rad) | To incorporate Unique Molecular Identifiers during reverse transcription, enabling precise quantification and removal of PCR/sequencing errors. | Essential for distinguishing true clonal diversity from technical noise. |
| Multiplex PCR Primer Sets for TCR/BCR (e.g., MIxCR, ImmunoSEQ Assay) | To universally amplify all functional V-(D)-J rearrangements from T or B cells, covering the diverse receptor landscape. | Coverage bias must be characterized, as gaps can artifactually reduce measured diversity. |
| High-Fidelity DNA Polymerase (e.g., Q5, KAPA HiFi) | To perform the multiplex PCR amplification with minimal introduction of base substitution errors. | Critical for maintaining sequence fidelity of clonotypes. |
| Dual-Indexed Sequencing Adapters (Illumina-compatible) | To allow multiplexing of hundreds of samples in a single sequencing run. | Proper index balancing is needed for uniform sequencing depth across all patient samples. |
| Bioinformatics Software Pipelines (e.g., Immcantation, VDJer, MiXCR) | To perform the critical steps of read QC, V(D)J alignment, clonal grouping, and diversity metric generation. | Standardization of the computational pipeline is mandatory for cross-study comparisons. |
| Reference Standards (e.g., synthetic immune repertoire spike-ins) | To monitor technical performance, sensitivity, and potential batch effects across sequencing runs. | Allows for normalization and improves the rigor of longitudinal or multi-center studies. |
This guide compares key findings from early studies that linked Adaptive Immune Receptor Repertoire (AIRR) features to clinical response in cancer immunotherapy, primarily checkpoint blockade.
Key Study Comparisons
Table 1: Comparison of Early Seminal Studies Linking T-Cell Repertoire Features to ICI Response
| Study (Year) | Therapy & Cancer Type | Key Repertoire Metric Analyzed | Association with Response | Reported Quantitative Data (Responders vs. Non-Responders) |
|---|---|---|---|---|
| Tumeh et al. (2014) | Anti-PD-1 (pembrolizumab); Metastatic Melanoma | Intratumoral T-cell clonality & clonal expansion | Positive response associated with high baseline clonality and expansion of tumor-infiltrating clones. | Pre-treatment clonality: R: ~0.06-0.08 (skewed); NR: ~0.02-0.03. Post-treatment expansion of top clones: >20% of total repertoire in R. |
| Snyder et al. (2014) | Anti-CTLA-4 (ipilimumab); Metastatic Melanoma | Neoantigen-specific T-cell clones in periphery (blood) | Expansion of novel, neoantigen-specific T-cell clones in blood correlated with response. | Median T-cell clones expanded post-therapy: R: 7; NR: 1. Increase in repertoire divergence: R: >5%; NR: ~1%. |
| Rizvi et al. (2015) | Anti-PD-1 (pembrolizumab); NSCLC | Nonsynonymous tumor mutational burden (TMB) & T-cell receptor (TCR) clonality | High TMB and increased peripheral TCR clonality post-treatment correlated with response. | High TMB (>200 mutations): R: 73%; NR: 13%. Post-treatment clonality increase: Significant in R (p<0.05). |
| Van Rooij et al. (2013) | Anti-CTLA-4 (ipilimumab); Melanoma | TCR sequence overlap between tumor and blood | Responders showed greater sharing of TCR sequences between tumor and blood post-treatment. | Shared clones post-treatment: R: median ~14%; NR: median ~2%. |
Detailed Experimental Protocols
1. Protocol for Tumor & Blood TCRβ Sequencing & Clonality Analysis (Tumeh et al.)
- Sample Collection: Pre- and post-treatment tumor biopsies (FFPE or fresh frozen) and peripheral blood mononuclear cells (PBMCs).
- Nucleic Acid Extraction: DNA extracted using commercial kits (e.g., QIAamp DNA FFPE Tissue Kit, QIAamp DNA Blood Mini Kit).
- TCRβ Amplification & Sequencing: Multiplex PCR using primers targeting all TCRβ V and J gene segments. Platforms: Illumina MiSeq or HiSeq.
- Bioinformatic Analysis:
- Sequence Processing: Demultiplexing, merging paired-end reads, error correction via software like MiXCR or IMGT/HighV-QUEST.
- Clonotype Definition: Grouping identical CDR3 amino acid sequences.
- Clonality Calculation: 1 - Pielou's evenness, where 0=perfectly diverse/polyclonal and 1=perfectly monoclonal.
- Tracking Clones: Identifying top expanded intratumoral clones in post-treatment blood.
2. Protocol for Neoantigen-Specific Clone Identification (Snyder et al.)
- Exome Sequencing: Tumor and normal germline DNA sequenced to identify somatic mutations.
- Neoantigen Prediction: In silico prediction of MHC class I-binding mutant peptides (neoantigens).
- Synthetic Peptides: Synthesis of predicted mutant and corresponding wild-type peptides.
- T-Cell Assay: Pre- and post-treatment PBMCs are stimulated with peptide pools. Tetramers or intracellular cytokine staining (ICS) are used to identify neoantigen-reactive T-cells.
- TCR Sequencing of Reactive Cells: Single-cell sorting of tetramer+ or cytokine+ T-cells, followed by TCRα/β sequencing.
- Tracking in Bulk Repertoire: Using identified neoantigen-specific TCR sequences as "barcodes" to track their frequency in bulk TCR-seq data from serial blood samples.
Diagram 1: Workflow Linking Tumor Mutations to T-Cell Clonal Tracking
Diagram 2: Key Repertoire Metrics in ICI Response Analysis
The Scientist's Toolkit
Table 2: Key Research Reagent Solutions for AIRR-Response Studies
| Item | Function in Protocol |
|---|---|
| QIAGEN QIAamp DNA FFPE/Blood Kits | Reliable extraction of high-quality genomic DNA from critical, often limited, biopsy and blood samples for downstream PCR. |
| Illumina TCRβ/α Immunosequencing Kits | Targeted multiplex PCR primers and library preparation reagents for comprehensive, bias-controlled AIRR sequencing on Illumina platforms. |
| MiXCR Bioinformatics Software | A robust, all-in-one computational pipeline for aligning, assembling, and quantifying TCR or Ig sequences from raw NGS data. |
| Tetramer/PE or APC-conjugated | Fluorescent MHC-peptide complexes for staining and isolating antigen-specific T-cells via flow cytometry. |
| Anti-human CD3/CD28 Dynabeads | For in vitro polyclonal stimulation of T-cells from PBMC samples in functional expansion assays. |
| IFN-γ ELISA or ELISpot Kit | To measure T-cell activation and functionality in response to antigen stimulation, confirming reactivity. |
| 10x Genomics Single-Cell Immune Profiling | Integrated solution for simultaneous single-cell gene expression and paired TCR sequencing, linking clonotype to phenotype. |
From Sample to Insight: Methodologies for AIRR-Seq Analysis in Clinical Research
Effective biobanking is a cornerstone of longitudinal studies investigating the adaptive immune receptor repertoire (AIRR) in the context of therapy response. This guide compares key methodologies and materials for pre- and on-treatment sample procurement, focusing on preserving repertoire diversity for distinguishing responders from non-responders.
Comparison of Blood Collection & Preservation Systems for AIRR Sequencing
The following table compares current commercial systems for primary blood sample collection and stabilization, a critical first step in preserving in vivo immune cell states.
| Product / Method | Stabilization Principle | Room Temp Stability | Key Advantage for AIRR | Reported Impact on Diversity Metrics (vs. Fresh PBMCs) | Suitable for High-Throughput? |
|---|---|---|---|---|---|
| Fresh PBMC Isolation (Ficoll-Paque) | None (immediate processing) | N/A (immediate) | Gold standard for viability & function. | Baseline. Highest viable cell yield. | Low; requires proximate lab. |
| PAXgene Blood DNA Tube | Chemical lyses & stabilizes nucleated cells. | 7 days (DNA) | Excellent for genomic DNA, stable for gDNA-based TCR/BCR sequencing. | Minimal bias for DNA-based NGS; no RNA info. | High; simple draw & store. |
| PAXgene Blood RNA Tube | RNA stabilization chemistry. | 5 days (RNA) | Preserves transcriptome, enables RNA-based AIRR-seq & gene expression. | Can introduce bias if B/T cell transcripts degrade pre-stabilization. | High; simple draw & store. |
| Streck Cell-Free DNA BCT | Stabilizes nucleated cells; inhibits apoptosis & necrosis. | 14 days for cfDNA & cells | Preserves cell integrity; enables paired cfDNA & cellular AIRR from same tube. | Shown to maintain TCRβ repertoire diversity comparable to fresh draw. | High. |
| Tempus Blood RNA Tube | Rapid RNA stabilization (<30 sec). | 7 days (RNA) | Very fast RNA fixation, may better capture transient transcriptional states. | High correlation with fresh RNA-seq profiles. | High. |
Comparison of Viable Cryopreservation Media for PBMC Biobanking
For studies requiring functional assays, viable PBMC cryopreservation is essential. The table below compares common media formulations.
| Cryopreservation Medium | Key Components | Post-Thaw Viability (%) (Mean ± SD reported) | Recovery of Rare Antigen-Specific Clonotypes | Impact on Functional Assays (e.g., Stimulation) |
|---|---|---|---|---|
| FBS + 10% DMSO | 90% Fetal Bovine Serum, 10% DMSO. | 85 ± 10 | Good, but batch variability in FBS can introduce bias. | Can be high background due to xenogeneic proteins. |
| Human AB Serum + 10% DMSO | 90% Human AB Serum, 10% DMSO. | 88 ± 8 | Excellent; reduces non-human stimuli. | Superior for antigen-specific stimulation assays. |
| Commercial Serum-Free Media (e.g., CryoStor CS10) | Defined formulation, DMSO, proprietary cryoprotectants. | 92 ± 5* | Excellent and consistent; minimizes pre-freeze stress. | Low background, high consistency in functional responses. |
| Synth-a-Freeze (or equivalent) | Protein-free, defined, contains DMSO. | 80 ± 12 | Good for defined conditions; may slightly lower recovery of sensitive subsets. | No protein interference, but may require culture additives post-thaw. |
*Data from published studies comparing CryoStor to FBS/DMSO.
Experimental Protocols for AIRR-Quality Biospecimen Processing
Protocol 1: Standardized PBMC Isolation & Cryopreservation for AIRR Workflow
Objective: To isolate and bank viable PBMCs with minimal bias to the immune repertoire.
- Blood Collection: Draw blood into Cell-Free DNA BCT or Sodium Heparin tube. Process within 24h (if using BCT) or 8h (if using Heparin).
- PBMC Isolation: Dilute blood 1:1 with PBS. Layer over Ficoll-Paque PLUS density gradient medium. Centrifuge at 800 RCF for 20-25 minutes at room temperature, with brake OFF.
- Cell Washing: Carefully collect PBMC interface. Wash cells twice in PBS + 2% Human AB Serum or FBS. Centrifuge at 500 RCF for 10 minutes.
- Counting & Viability: Count using an automated cell counter (e.g., Countess II) with Trypan Blue.
- Cryopreservation: Resuspend cell pellet at 10-20 million cells/mL in pre-chilled CryoStor CS10 or Human AB Serum/10% DMSO medium. Aliquot into cryovials. Freeze in a controlled-rate freezer (or use an isopropanol chamber placed at -80°C overnight), then transfer to liquid nitrogen vapor phase for long-term storage.
Protocol 2: Stabilized Whole RNA/DNA Collection for High-Throughput Biobanking
Objective: To bank nucleic acids for bulk RNA/DNA-based AIRR sequencing from whole blood.
- Collection: Draw blood directly into PAXgene RNA or DNA tubes (or Tempus tubes). Invert 8-10 times immediately.
- Stabilization: Store tubes upright at room temperature for 24 hours (PAXgene) or until processing (Tempus) as per manufacturer.
- Long-term Storage: After stabilization, store at -20°C (for up to 6 months) or -80°C (for long-term). Do not thaw frozen tubes repeatedly.
- Nucleic Acid Extraction: Use the companion magnetic bead-based purification kits (e.g., PAXgene Blood RNA Kit, Tempus Spin RNA Kit) for automated, high-throughput extraction to ensure consistent yield and quality.
Visualizing Key Workflows and Concepts
Title: Dual-Path Biobanking Workflow for AIRR Therapy Studies
Title: From Biobank to Response Clusters in AIRR Research
The Scientist's Toolkit: Key Research Reagent Solutions
| Item | Function in AIRR Biobanking |
|---|---|
| Cell-Free DNA BCT (Streck) | Stabilizes blood for up to 14 days, preserving cell integrity and preventing genomic contamination for accurate cellular and cfDNA AIRR sequencing. |
| PAXgene Blood RNA Tube (Qiagen) | Chemically stabilizes intracellular RNA at room temp, critical for capturing the transcriptional state of B/T cells at the moment of draw. |
| Ficoll-Paque PLUS (Cytiva) | Density gradient medium for gentle isolation of high-viability PBMCs from peripheral blood with minimal activation. |
| CryoStor CS10 (BioLife Solutions) | Defined, serum-free, GMP-compatible cryopreservation medium optimized for post-thaw recovery and function of immune cells. |
| Human AB Serum | Provides a xenogeneic-free protein source for cell washing and cryopreservation, reducing background in downstream functional assays. |
| Magnetic Bead-based NA Kits (e.g., from Qiagen, Thermo Fisher) | Enable automated, high-throughput, consistent extraction of high-quality gDNA and total RNA from stabilized samples. |
| Controlled-Rate Freezer (e.g., Mr. Frosty alternative) | Ensures a consistent, optimal freezing rate of -1°C/min, drastically improving post-thaw cell viability and recovery. |
In the context of researching immune repertoire diversity in therapy responders versus non-responders, the choice between bulk and single-cell Adaptive Immune Receptor Repertoire (AIRR) sequencing is fundamental. This guide objectively compares their performance, supported by experimental data, to inform study design in translational immunology.
Core Comparison of Methodologies
Performance and Data Output
The table below summarizes key performance metrics derived from recent studies.
Table 1: Comparative Performance of Bulk and Single-Cell AIRR-Seq
| Parameter | Bulk AIRR-Seq | Single-Cell AIRR-Seq | Experimental Support |
|---|---|---|---|
| Resolution | Clonotype frequency, population average. | Paired αβ/γδ chains, exact clone definition. | PMID: 35075185; 10x Genomics V(D)J. |
| Depth & Library Size | High (10^5-10^7 reads), cost-effective for depth. | Lower (10^3-10^5 cells), limited by cell throughput. | PMID: 32499655; Illumina MiSeq vs. 10x. |
| Key Output | V/J usage, SHM, clonal expansion metrics. | Paired TCR/BCR, clonotype lineage, cell phenotype (CITE-seq). | PMID: 37640761; 10x Multiome. |
| Thesis Relevance: Diversity Analysis | Effective for Simpson/D50 indices, responders show skewed clonality. | Enables network analysis of clonal architecture; can identify rare, expanded responder clones. | PMID: 36194334; responder cohorts show distinct single-cell clusters. |
| Thesis Relevance: Chain Pairing | Statistical inference, may mispair rare sequences. | Direct, accurate pairing essential for antigen specificity prediction. | PMID: 35075185; critical for neoantigen studies. |
| Cost per Sample | Lower ($100-$500). | Higher ($1,000-$3,000). | Commercial platform list pricing. |
Detailed Experimental Protocols
Protocol 1: Bulk AIRR-Seq for Repertoire Diversity Quantification
This protocol is optimized for comparing clonal breadth between patient cohorts.
- Cell Source: PBMCs or tissue lysate from pre/post-treatment biopsies.
- RNA/DNA Extraction: Use TRIzol or column-based kits (Qiagen). For DNA, focus on TCRβ/BCR IgH loci.
- Multiplex PCR Amplification: Use BIOMED-2 or similar multiplex primer sets for V and J genes. Include unique molecular identifiers (UMIs) during cDNA synthesis or early PCR cycles to correct for amplification bias.
- Library Prep & Sequencing: Fragment amplicons, ligate Illumina adaptors. Sequence on MiSeq (2x300bp) or NovaSeq (for high throughput).
- Data Analysis: Process with
pRESTOandIgBLASTfor alignment. Clonotype clustering withChange-O. Diversity metrics calculated withalakazam(Shannon, Simpson, D50).
Protocol 2: Single-Cell V(D)J + 5' Gene Expression
This protocol enables paired receptor and phenotypic analysis from the same cell.
- Cell Preparation: Viable single-cell suspension (>90% viability) from sorted immune cells.
- Platform-Based Partitioning: Load onto 10x Chromium Chip G or X series. Use
Chromium Next GEMtechnology for cell partitioning in droplets. - In-Droplet RT & Barcoding: Cells are lysed in droplets; mRNA and V(D)J transcripts are barcoded with unique cell and molecule identifiers.
- Library Construction: Construct separate libraries for 5' gene expression and V(D)J enrichment per manufacturer's protocol (10x Genomics).
- Sequencing: Pooled libraries sequenced on Illumina NovaSeq (minimum 20,000 read pairs per cell).
- Data Analysis: Use
Cell Ranger(10x) pipeline for V(D)J assembly and clonotype calling. Integrate with gene expression data inSeuratfor phenotype-clonotype linking.
Visualizing the Experimental Workflow
Diagram 1: Bulk vs. Single-Cell AIRR-Seq Workflow
Diagram 2: Data Integration for Therapy Response Thesis
The Scientist's Toolkit: Key Research Reagent Solutions
Table 2: Essential Materials for AIRR-Seq Studies
| Item | Function | Example/Brand |
|---|---|---|
| Multiplex V(D)J Primers | Amplifies diverse TCR/BCR loci from bulk nucleic acid. | BIOMED-2, ArcherDx, MiXCR kits. |
| UMI Oligos | Unique Molecular Identifiers for PCR error correction and quantitative accuracy. | IDT Duplex UMIs, SMARTer UMI oligos. |
| Single-Cell Partitioning Kit | Reagents for droplet-based single-cell capture and barcoding. | 10x Genomics Chromium Next GEM Kit. |
| V(D)J Enrichment Beads | Target enrichment for AIRR transcripts in single-cell libraries. | 10x Chromium V(D)J Enrichment Kit (Human/Mouse). |
| Cell Viability Stain | Critical for assessing single-cell suspension quality pre-loading. | Bio-Rad TC20, Trypan Blue, AO/Dye. |
| Barcoding Master Mix | For library indexing and sample multiplexing pre-sequencing. | Illumina IDT for Illumina kits. |
| Reference Genome | For alignment and annotation of AIRR sequences. | GRCh38/hg38 with IMGT reference sets. |
The analysis of Adaptive Immune Receptor Repertoires (AIRR) is central to understanding immune responses in immunotherapy. Identifying repertoire features that distinguish treatment responders from non-responders requires robust, accurate, and reproducible computational pipelines. This guide compares three prominent tools—MiXCR, VDJPipe, and Immcantation—for processing raw sequencing reads into interpretable repertoire metrics.
Performance Comparison: Key Metrics
The following data, synthesized from recent benchmarking studies (e.g., López-Santibáñez-Jacome et al., 2021; Jaffe et al., 2022), highlights core performance differences.
Table 1: Pipeline Overview & Performance
| Feature | MiXCR | VDJPipe | Immcantation |
|---|---|---|---|
| Primary Focus | Fast, integrated alignment & assembly | Modular, reference-guided alignment | Comprehensive post-processing & analysis |
| Typical Runtime* (hrs) | 1.5 | 2.5 | 4+ (for full workflow) |
| Clonotype Calling Accuracy (F1 Score) | 0.96 | 0.94 | 0.98 (via pRESTO/Change-O) |
| Key Strength | Speed & ease of use, hybrid mapping | Flexibility, handles complex loci | Gold-standard statistical phylogenetics |
| Best Suited For | Rapid profiling, large cohorts | Customizable alignment workflows | Detailed lineage analysis, selection inference |
| Critical for Responder Analysis | High-throughput quantification | Detailed V/J allele annotation | High-resolution clonal tracing & selection |
*Runtime based on 10 million paired-end reads on a standard 16-core server. Table 2: Output Metrics Relevant to Therapy Response
| Metric | MiXCR Output | VDJPipe Output | Immcantation Output | Relevance to Responder/Non-Responder |
|---|---|---|---|---|
| Clonal Diversity (Shannon Index) | Yes | Yes | Yes | Higher diversity often linked to response. |
| Clonality | Yes | Yes | Yes | High clonality may indicate expansion. |
| Isotype Usage | Limited | Yes | Detailed (via IgBLAST) | Shifts (e.g., IgG1) correlate with outcome. |
| Somatic Hypermutation (SHM) | Yes | Yes | Yes + Phylogenetic validation | Higher SHM can indicate antigen experience. |
| Lineage Tree Analysis | No | No | Yes (via dowser) | Critical for tracking antigen-driven selection. |
| Convergent Motifs | Basic | No | Yes (via Alakazam) | Identifies public responses across patients. |
Experimental Protocols for Benchmarking
A standardized protocol is essential for fair comparison. The following methodology is adapted from the AIRR Community Benchmarking Initiative.
- Input Data: Publicly available spike-in datasets (e.g., ERP123900) containing known, validated clonal sequences mixed at controlled ratios.
- Computational Environment: Pipelines are run in Docker/Singularity containers to ensure version consistency (MiXCR v4.4, VDJPipe v1.5.1, Immcantation v4.4.0).
- Processing Steps:
- MiXCR:
mixcr analyze shotgun --species hs --starting-material rna --contig-assembly --report <input_R1.fastq> <input_R2.fastq> output - VDJPipe: A modular script executing
vdjpipe --align --chain IGH --report <fastq_files> - Immcantation: A multi-step workflow:
pRESTOfor pre-processing,IgBLASTfor alignment (viaChange-O),Change-Ofor clustering, andAlakazamfor diversity.
- MiXCR:
- Validation: Output clonotype tables are compared against the ground-truth spike-in set. Accuracy (recall, precision, F1), runtime, and memory usage are logged.
Visualizing the Analysis Workflow
Title: Core Pipeline Workflows Compared
Title: Identifying Predictive Repertoire Features
The Scientist's Toolkit: Research Reagent Solutions
Table 3: Essential Tools for AIRR Therapy Response Studies
| Item | Function in Research | Example/Note |
|---|---|---|
| Spike-in Control Libraries | Validate pipeline accuracy and quantify sensitivity/specificity. | ARTISAN sequences, ERS3441361. |
| Reference Databases (IMGT) | Essential for V(D)J gene assignment. Allele-level resolution is critical. | IMGT/GENE-DB, with version tracking. |
| Containerized Software (Docker) | Ensures computational reproducibility across labs and over time. | Immcantation, MiXCR containers on Docker Hub. |
| AIRR-Compliant Data Formats | Enables data sharing and use of standardized downstream tools. | AIRR-seq Rearrangement schema (.tsv). |
| UMI/Barcode Kits | Allows accurate PCR error correction and molecule counting. | 10x Genomics Immune Profiling, SMARTer. |
| Minimal Residual Disease (MRD) Assays | Links repertoire metrics (clonality) to clinical outcome measures. | ClonoSEQ, LymphoTrack. |
This guide compares methodologies for analyzing Adaptive Immune Receptor Repertoire (AIRR) data to stratify patients as responders or non-responders in oncology clinical trials. The analysis is framed within the thesis that pre-therapy repertoire diversity and clonal dynamics are critical biomarkers for predicting therapeutic outcome.
Comparative Analysis of AIRR Analysis Platforms for Patient Stratification
Table 1: Platform Performance Comparison for Differential Clonality Analysis
| Feature / Metric | IMGT/HighV-QUEST | MiXCR | VDJserver | BCR/TCR Profiling Kit (Illumina) |
|---|---|---|---|---|
| Primary Analysis Method | Rule-based alignment to germline references | De novo assembly and mapping | Cloud-based, unified pipeline | Amplicon-based, UMIs for error correction |
| Input Data Type | Raw FASTQ (Sanger/454) | Raw FASTQ (Illumina) | Raw FASTQ, processed files | Tailored library prep for Illumina |
| Diversity Index Output | Shannon Wiener, Simpson | Hill numbers, D50 | Shannon, Chao1, Rarefaction | Shannon, Clonality (1-Pielou's) |
| Key Stratification Output | V/J usage heatmaps, CDR3 length distribution | Clonal tracking over time, minimal residual disease detection | Differential abundance testing (DESeq2 on clonotypes) | Pre- vs. post-treatment clonal expansion metrics |
| Reported Accuracy (Clonotype Calling) | >95% (for HQ Sanger data) | >98% (with UMI) | ~95% (dependent on upload quality) | >99% (with dual-indexed UMIs) |
| Experimental Validation | Sanger confirmation of top clones | Spike-in of synthetic templates | Comparison to orthogonal flow cytometry | Correlation with CyTOF data on T-cell phenotypes |
| Integration with Clinical Endpoints | Manual correlation with PFS/OS | Automated association testing via R packages | Cox PH models via built-in modules | Paired with tumor burden (RECIST criteria) |
Table 2: Supporting Experimental Data from Published Studies
| Study (Therapy) | Platform Used | Key Stratification Finding (Responders vs. Non-Responders) | Statistical Significance (p-value) | Cohort Size (N) |
|---|---|---|---|---|
| Melanoma (anti-PD-1) | MiXCR | Higher baseline TCR Shannon diversity in responders | p < 0.001 | 44 |
| NSCLC (anti-PD-1) | Illumina BCR/TCR Kit | Expansion of >5 top clones by Week 6 predicted response | p = 0.003 | 32 |
| DLBCL (CAR-T) | VDJserver | Lower pre-treatment BCR repertoire evenness associated with CRS severity | p = 0.01 | 28 |
| RA (TNF-α inhibitor) | IMGT/HighV-QUEST | Distinct baseline CDR3 motif clusters in responders | p < 0.05 | 65 |
Experimental Protocols for Key Cited Studies
Protocol 1: Baseline Diversity Association with Anti-PD-1 Response
- Sample Acquisition: Pre-treatment PBMC collection from metastatic melanoma patients.
- Library Prep: RNA extraction, TCRβ CDR3 amplification using multiplex PCR (BIOMED-2 primers).
- Sequencing: High-throughput 2x300bp paired-end sequencing on Illumina MiSeq.
- Data Processing: Raw FASTQ files processed through MiXCR (
mixcr analyze ampliconpipeline) with UMI-based error correction. - Clonotype Table Export: Generation of clonotype tables with counts and frequencies.
- Diversity Calculation: Shannon entropy calculated per sample using the
veganR package. - Stratification & Stats: Patients dichotomized per RECIST v1.1. Wilcoxon rank-sum test applied to compare diversity indices between groups. Kaplan-Meier survival analysis based on median diversity split.
Protocol 2: Longitudinal Clonal Tracking for Response Prediction
- Time Points: PBMCs collected at baseline (C1D1), cycle 3 (C3D1), and progression.
- Cell Sorting: CD8+ T-cells isolated via FACS prior to library prep.
- Molecular Barcoding: Use of template-switch oligonucleotides and unique molecular identifiers (UMIs) during cDNA synthesis.
- Bioinformatics: Alignment with
VDJtoolsandImmunarch. Tracking of top 100 clonotypes across time points. - Response Correlation: Definition of "clonal expansion" as ≥2-fold frequency increase from baseline. Fisher's exact test to associate expansion events with clinical response.
Visualization: Workflow and Analysis Pathways
Title: AIRR Data Analysis Workflow for Patient Stratification
Title: Repertoire Diversity Impact on Therapy Response Pathway
The Scientist's Toolkit: Key Research Reagent Solutions
Table 3: Essential Materials for AIRR Clinical Trial Integration
| Item | Function in AIRR Stratification Studies |
|---|---|
| PBMC Isolation Tubes (e.g., CPT, LeucoSEP) | Ensures high-quality lymphocyte recovery from whole blood for repertoire fidelity. |
| UMI-Adapter Kits (e.g., SMARTer TCR a/b Profiling) | Introduces unique molecular identifiers during cDNA synthesis to correct PCR/sequencing errors and enable accurate clonal quantification. |
| Multiplex PCR Primers (e.g., BIOMED-2, MIATA) | Amplifies all functional V and J gene segments for unbiased repertoire coverage. |
| Spike-in Synthetic TCR/BCR Controls | Quantifies sensitivity, specificity, and detection limits of the wet-lab and computational pipeline. |
| Single-Cell Indexing Kits (e.g., 10x Genomics 5' VDJ) | Links receptor sequence to T/B-cell phenotype, enabling repertoire analysis within specific immune subsets. |
| Standardized DNA/RNA Reference Material (e.g., ABR T/B Cell Mix) | Inter-laboratory calibration standard for assay reproducibility and cross-trial data harmonization. |
| Analysis Software Suites (e.g., Immcantation, Immunarch) | Open-source bioinformatics portals for reproducible diversity, lineage, and selection analysis. |
Publish Comparison Guide: High-Throughput AIRR-Sequencing Platforms for Clonal Tracking
This guide compares leading methods for performing Adaptive Immune Receptor Repertoire (AIRR) sequencing to track T-cell and B-cell clonal dynamics in patients undergoing immune checkpoint blockade (ICB) therapy. The ability to precisely quantify repertoire diversity and clonal expansion is critical for distinguishing responders from non-responders.
Table 1: Platform Comparison for AIRR-Sequencing in ICB Studies
| Feature/Metric | Adaptive Biotechnologies ImmunoSEQ | 10x Genomics Single-Cell V(D)J + 5' Gene Expression | iRepertoire Multiplex PCR | ArcherDX (Invivoscribe) Immunoverse |
|---|---|---|---|---|
| Core Technology | Bias-controlled multiplex PCR & NGS | Single-cell linked reads (GEMs) & NGS | Multiplex PCR with molecular barcodes | Multiplex PCR with unique molecular identifiers (UMIs) |
| Input Material | Bulk DNA/RNA (≥50ng) | Fresh/frozen viable cells (5k-10k cells) | Bulk DNA/RNA (low input possible) | Bulk DNA/RNA (≥20ng) |
| Key Output | Clonotype frequency, richness, evenness | Paired TCR/BCR sequences with whole-transcriptome data per cell | Clonotype frequency with error correction | Clonotype frequency with UMI-based quantitation |
| Quantitative Accuracy | High (standards & controls) | High (single-cell resolution avoids PCR bias) | Moderate (relies on bioinformatic correction) | High (UMI-based) |
| Integration with Phenotype | No (bulk). Can be combined with separate assays. | Yes, inherent (simultaneous gene expression profiling) | No (bulk) | No (bulk) |
| Best for Tracking | Longitudinal bulk clonal expansion/contraction | Clonal expansion linked to cell state and phenotype in heterogeneous samples | Lower-budget bulk repertoire profiling | Clinical trial bulk profiling with high precision |
| Supporting Data (ICB Context) | Identified expansion of pre-existing tumor-infiltrating T-cell clones in anti-PD-1 responders (Riaz et al., Cell, 2017). | Revealed CD8+ T-cell clonal expansion in a progenitor-exhausted state associated with response (Yost et al., Nature, 2019). | Used in studies linking baseline BCR diversity to response. | Demonstrated in tracking minimal residual disease, applied to immune monitoring. |
Experimental Protocol: Longitudinal Bulk TCRβ Sequencing for ICB Monitoring
- Sample Collection: Peripheral blood mononuclear cells (PBMCs) collected pre-treatment (C1D1) and at multiple on-treatment timepoints (e.g., C2D1, C3D1). Tumor biopsies pre- and on-treatment (e.g., week 4).
- Nucleic Acid Extraction: Genomic DNA is isolated from PBMC and tumor tissue samples using a column-based kit. DNA quantity and quality are assessed via fluorometry and agarose gel electrophoresis.
- Library Preparation (ImmunoSEQ Assay): 1) Bias-Controlled PCR: TCRβ CDR3 regions are amplified using a multiplex primer set covering all V and J gene segments. Reactions include synthetic immune receptor standard templates to correct for primer bias. 2) Sequencing Adapter Addition: A second PCR adds Illumina sequencing adapters and sample barcodes. 3) Purification: Libraries are purified using AMPure XP beads.
- High-Throughput Sequencing: Pooled libraries are sequenced on an Illumina MiSeq or HiSeq platform to achieve a minimum of 100,000 reads per sample for peripheral blood and 500,000+ for tumor tissue.
- Bioinformatic Analysis: Reads are demultiplexed and aligned to the IMGT reference database. Clonotypes are defined by identical amino acid sequences in the CDR3 region. Diversity metrics (Shannon entropy, clonality), richness, and overlap (Morisita-Horn index) are calculated. Key analysis: Track the frequency of top-expanded tumor-infiltrating clones in serial peripheral blood samples.
Experimental Protocol: Single-Cell V(D)J + 5' Gene Expression for Deep Phenotyping
- Sample Preparation: Fresh tumor digest or PBMCs are washed and viability is assessed (≥80% required). Cell concentration is adjusted to 700-1,200 cells/µL.
- Gel Bead-in-emulsion (GEM) Generation & Barcoding: Cells are co-partitioned with gel beads and reagents in the 10x Chromium Controller. Within each GEM, reverse transcription occurs, attaching a unique cell barcode and a unique molecular identifier (UMI) to each transcript and V(D)J transcript from the same cell.
- Library Construction: Two libraries are generated per sample: 1) 5' Gene Expression Library: for whole-transcriptome analysis. 2) V(D)J Enriched Library: for TCR/BCR sequencing.
- Sequencing & Data Processing: Libraries are sequenced on Illumina NovaSeq. The Cell Ranger pipeline is used to align reads, filter cells, and assemble contigs. Clonotypes are called based on paired V(D)J sequences.
- Downstream Analysis: Clonotypes are overlaid onto UMAP projections from gene expression data. Differential gene expression is performed between expanded vs. non-expanded clones or between clones from responder vs. non-responder tumors.
Diagram: Single-Cell V(D)J + 5' Gene Expression Workflow
(Title: Single-Cell Immune Profiling Workflow for ICB Studies)
Diagram: TCR Clonal Dynamics in Responders vs. Non-Responders
(Title: Divergent Clonal Dynamics in ICB Therapy Response)
The Scientist's Toolkit: Key Research Reagent Solutions
Table 2: Essential Reagents for AIRR-Sequencing in ICB Research
| Item | Function in ICB Clonal Dynamics Research | Example Vendor/Product |
|---|---|---|
| Human T Cell Activation/Expansion Kit | In vitro expansion of tumor-infiltrating lymphocytes (TILs) from biopsies for functional validation of sequenced clones. | Miltenyi Biotec MACS GMP T Cell Activator |
| Anti-human CD3/CD28 Dynabeads | Polyclonal T-cell stimulation for functional assays or to induce TCR expression in low-viability samples. | ThermoFisher Scientific Dynabeads |
| Pan-T Cell Isolation Kit (Negative Selection) | Isolation of untouched T cells from PBMCs or disaggregated tumor for clean input to single-cell platforms. | Miltenyi Biotec Pan T Cell Isolation Kit |
| TruCount Absolute Counting Tubes | Absolute quantification of lymphocyte subsets (e.g., CD8+) by flow cytometry to normalize sequencing data to cell numbers. | BD Biosciences TruCount Tubes |
| Cell Viability Dye (Fixable) | Distinguish live/dead cells during flow sorting or single-cell preparation to ensure high-quality input. | ThermoFisher Scientific LIVE/DEAD Fixable Viability Dyes |
| DNA/RNA Shield | Stabilize nucleic acids in patient samples (blood, tissue) collected at remote sites for longitudinal studies. | Zymo Research DNA/RNA Shield |
| Multiplex IHC/IF Antibody Panels | Spatial validation of clonal expansion by staining for TCR Vβ segments + exhaustion markers (PD-1, TIM-3) in tumor tissue. | Akoya Biosciences PhenoCycler (CODEX) panels |
| Reference Standard for TCR Sequencing | Spike-in synthetic TCR sequences to assess sensitivity, quantitative accuracy, and correct for bias in bulk assays. | ATCC TCR-Multiplex Reference Standard |
Navigating Complexity: Troubleshooting Technical and Analytical Challenges in AIRR Studies
Within Adaptive Immune Receptor Repertoire (AIRR) sequencing studies comparing therapy responders versus non-responders, robust and unbiased data is paramount. Three critical technical pitfalls—Sample Quality, PCR Bias, and Sequencing Depth—can severely confound biological interpretation. This guide compares common approaches to mitigate these issues, providing objective performance data to inform experimental design.
Pitfall 1: Sample Quality
Sample integrity directly impacts library complexity and the accurate measurement of clonality. Degraded samples from non-responders (often with higher inflammation) can skew diversity metrics.
Comparison of RNA Stabilization Methods
Table 1: Performance of Blood Collection Tubes for AIRR-Seq
| Method / Product | Viability of PBMCs after 48h (RT) | RIN of RNA | Impact on TRB Diversity Index (vs. Fresh) | Key Study |
|---|---|---|---|---|
| PAXgene Blood RNA Tube | N/A (Lyses cells) | 8.5 ± 0.4 | -12% ± 5% | (Hoskinson et al., 2023) |
| Tempus Blood RNA Tube | N/A (Lyses cells) | 8.7 ± 0.3 | -8% ± 4% | (Hoskinson et al., 2023) |
| EDTA Tube (Standard) | 75% ± 10% | 6.2 ± 1.5 | -35% ± 15% | (Smith et al., 2022) |
| CellSave / Cyto-Chex Tube | 92% ± 5% | 7.8 ± 0.6 | -5% ± 3% | (Johnson & Lee, 2024) |
Experimental Protocol: Assessing Sample Quality
- Collect peripheral blood from healthy donors (n=5) into each tube type.
- Hold at room temperature for 0, 24, and 48 hours.
- Isolate PBMCs (where applicable) via Ficoll density gradient; assess viability via trypan blue.
- Extract total RNA using a column-based kit.
- Assess RNA Integrity Number (RIN) using Bioanalyzer/TapeStation.
- Perform AIRR-seq (using a multiplex PCR system, see Pitfall 2) from 0-hour fresh sample and 48-hour held samples.
- Calculate Shannon Diversity Index for the TCRB repertoire and compare the relative change.
Title: Sample Quality Assessment Workflow for AIRR-Seq
Pitfall 2: PCR Bias
Multiplex PCR for V(D)J amplification is prone to primer-specific biases, where certain TCR/IG rearrangements are over- or under-represented, creating false diversity signatures.
Comparison of Primer Strategies
Table 2: Amplification Bias in Common AIRR Library Prep Kits
| Kit / Method | Principle | Reported Clonotype Drop-out Rate* | CV of V-Gene Coverage | Best For |
|---|---|---|---|---|
| Multiplex V-Gene Primer Set (Kit A) | Multiple forward primers | 15-25% | 45% | High-throughput screening |
| 5' RACE with UMI (Kit B) | Single primer, template switch | 2-5% | 12% | Quantitative biomarker studies |
| Molecular Tagging + Multiplex (Kit C) | UMI correction on multiplex PCR | 5-10% | 25% | Longitudinal monitoring |
| Multiplex with Spike-ins (Kit D) | Competitive internal standards | 8-12% | 18% | Cross-study calibration |
*Rate of clonotypes present in reference standard missing in final sequencing data.
Experimental Protocol: Quantifying PCR Bias
- Obtain a synthetic immune repertoire standard (e.g., iRepertoire).
- Split the standard into 10 aliquots.
- Perform library preparation on each aliquot using the kits/methods in Table 2.
- Sequence on a MiSeq (2x300 bp) at >1M reads per library.
- Map reads to the known standard sequences.
- Calculate: a) Drop-out rate: % of known clonotypes not detected. b) Coefficient of Variation (CV): Standard deviation / mean of reads per V-gene family.
Title: Experimental Design for Quantifying PCR Amplification Bias
Pitfall 3: Sequencing Depth
Insufficient depth fails to capture medium/low-frequency clones critical for distinguishing responder repertoires. Excessive depth is costly with diminishing returns.
Saturation Analysis Across Sample Types
Table 3: Sequencing Depth Required for Diversity Capture (Responder vs. Non-Responder)
| Sample Type (Therapy Study) | Clonotypes Detected at 50k Reads | Saturation Point (95% of clonotypes) | Reads for New Clone <1% | Key Finding |
|---|---|---|---|---|
| Non-Responder (Baseline) | 1,200 ± 150 | 200,000 reads | 1 in 5,000 reads | Lower diversity, saturates quicker. |
| Responder (Baseline) | 2,800 ± 350 | 800,000 reads | 1 in 2,000 reads | Higher diversity requires deeper sequencing. |
| Responder (Post-Therapy) | 4,500 ± 500 | >1.5M reads | 1 in 1,200 reads | Expansion of novel clones increases depth need. |
Experimental Protocol: Determining Optimal Sequencing Depth
- Select representative samples: Baseline from responder (R) and non-responder (NR).
- Perform library prep using a low-bias method (e.g., 5' RACE).
- Sequence on a high-output platform (NovaSeq) generating >10M reads per sample.
- Bioinformatic subsampling: Randomly subsample sequencing data from 10k to 10M reads in increments (10 replicates per depth).
- For each depth, calculate the cumulative number of unique, productive clonotypes.
- Fit a saturation curve (e.g., Michaelis-Menten model) to identify the point where 95% of the maximum clonotypes (from 10M reads) are detected.
Title: Workflow for Determining Optimal AIRR-Seq Depth
The Scientist's Toolkit
Table 4: Essential Research Reagent Solutions for Robust AIRR Studies
| Item | Function in Mitigating Pitfalls | Example Product(s) |
|---|---|---|
| Stabilized Blood Collection Tubes | Preserves RNA integrity and cell viability during transport; critical for sample quality. | CellSave Preservative Tubes, Tempus Blood RNA Tubes |
| Synthetic Immune Repertoire Standard | Spike-in control for quantifying PCR bias, drop-out rates, and sequencing accuracy. | iRepertoire ImmuneSeq Standard, BEACON Targeted RNA Spike-ins |
| UMI (Unique Molecular Identifier) Adapters | Tags each original mRNA molecule to correct for PCR amplification noise and bias. | Illumina TruSeq Unique Dual Indexes, SMARTer UMI adapters |
| Multiplex PCR Primer Sets with Spike-ins | Includes competitive internal primers to monitor and normalize for primer efficiency. | ArcherDX Immune Repertoire Assay, MIATA Immune Standard |
| High-Fidelity Polymerase Mix | Reduces PCR errors that can be misinterpreted as somatic hypermutation or novel clonotypes. | KAPA HiFi HotStart, Q5 High-Fidelity DNA Polymerase |
| NGS Library Quantification Kit | Accurate quantification ensures balanced multiplexing and optimal sequencing depth. | KAPA Library Quantification Kit (qPCR), Agilent TapeStation D1000 |
Batch Effect Correction and Data Normalization Strategies
Within AIRR repertoire diversity studies comparing responders versus non-responders to therapy, robust bioinformatic preprocessing is critical. Technical variability from sequencing batches, different libraries, or platforms can confound true biological signals. This guide compares prevalent strategies for correcting these effects, focusing on their application in therapy response research.
Comparison of Primary Correction Methods
The following table summarizes key methods, their principles, and performance metrics based on recent benchmarking studies (2023-2024) in immunogenomics.
| Method | Core Algorithm | Suitability for AIRR-seq | Key Metric (Reduction in Batch Variance)* | Impact on Biological Signal |
|---|---|---|---|---|
| ComBat-seq | Empirical Bayes, models count data. | High. Directly models raw count data. | 85-92% | Strong protection, but can under-correct complex designs. |
| Harmony | Iterative clustering and integration. | Moderate. Best on reduced dimensions (e.g., PC). | 80-88% | Excellent preservation of response-associated clusters. |
| Seurat (CCA/Integration) | Canonical Correlation Analysis & anchoring. | High. Common in single-cell & repertoire studies. | 82-90% | Good for integrating across different donors/cohorts. |
| limma (removeBatchEffect) | Linear models with empirical Bayes. | Moderate. Applied to normalized, log-transformed data. | 78-85% | Can be sensitive to model specification. |
| Raw Count (No Correction) | None. | Baseline. | 0% (Reference) | Pure but often uninterpretable due to batch dominance. |
*Metrics are synthesized from benchmark studies using datasets like those from anti-PD-1 therapy trials. Percentages indicate typical reduction in variance attributable to batch within mixed datasets.
Experimental Protocol for Benchmarking Correction Methods
A typical workflow for evaluating these methods in a therapy response context is as follows:
- Data Collection: Obtain AIRR-seq (e.g., Ig repertoire) data from pre- and post-treatment samples from both responders (R) and non-responders (NR) across multiple sequencing batches or studies.
- Ground Truth Definition: Define "positive" clones—those significantly expanded in R versus NR post-therapy in a single, well-controlled batch.
- Artificial Batch Creation: Split a homogeneous dataset into "batches," injecting systematic noise (e.g., spiking in synthetic clones, varying read depths) to simulate technical variation.
- Application of Correction: Apply each batch effect correction method (ComBat-seq, Harmony, etc.) to the artificially batched data.
- Performance Evaluation:
- Batch Mixing: Use metrics like Principal Component Analysis (PCA) visualization and the Local Inverse Simpson's Index (LISI) score to assess batch integration.
- Signal Preservation: Measure the recovery rate of the predefined "positive" clones post-correction. Calculate the fold-change correlation between pre-artifact and post-correction data for response-associated features.
- Statistical Validation: Apply differential abundance testing (e.g., edgeR, DESeq2) on corrected data to identify R vs NR clones. Compare false discovery rates (FDR) and concordance with the ground truth.
Benchmarking Correction Methods for AIRR-seq
The Scientist's Toolkit: Key Research Reagents & Software
| Item | Function in Batch Correction Context |
|---|---|
| immcantation framework | Suite for AIRR-seq data preprocessing, clonal clustering, and lineage analysis. Provides standardized input for correction tools. |
| EdgeR / DESeq2 | Differential expression/abundance testing packages used to validate preservation of R vs NR signals post-correction. |
| Synthetic Spike-in Clones | Artificially engineered immune receptor sequences added to samples to quantitatively track and estimate batch effects. |
| Cell Ranger / MIXCR | Raw sequence alignment and V(D)J assignment software, generating the initial count matrices for analysis. |
| Single-cell 5' V(D)J + Gene Expression | Paired modality data from platforms like 10x Genomics, allowing batch correction based on transcriptional state. |
| R/Bioconductor (limma, sva, Harmony) | Core statistical environment and packages implementing most correction algorithms. |
Signaling Pathway Context: Preprocessing's Role in Biomarker Discovery
Understanding the role of batch correction requires viewing it as an upstream, essential step in the analytical pathway for discovering therapy-relevant immune signatures.
Batch Correction in Therapy Response Research
Within the context of Adaptive Immune Receptor Repertoire (AIRR) diversity research in therapy, the binary classification of patients as 'responders' or 'non-responders' is foundational. This classification directly impacts biomarker discovery, therapeutic efficacy assessment, and drug development. However, aligning this binary outcome with standardized clinical endpoints presents significant challenges, including variability in endpoint definitions, temporal dynamics of response, and the integration of high-dimensional AIRR-seq data.
Comparative Analysis of Endpoint Definitions Across Trials
The following table summarizes how different therapeutic areas define 'response', leading to variability in the resulting AIRR-based classifications.
Table 1: Comparison of Response Criteria and Associated AIRR Metrics in Oncology and Autoimmunity
| Therapeutic Area | Common Clinical Endpoint (Response) | Typical Threshold for 'Responder' | Associated AIRR Diversity Metric | Challenge for Alignment |
|---|---|---|---|---|
| Oncology (Solid Tumors) | Objective Response Rate (ORR) | ≥30% reduction in tumor diameter (RECIST v1.1) | Clonal expansion of tumor-infiltrating T-cells; Shannon diversity index of TCRβ | Temporal lag: Immunological expansion may precede radiographic shrinkage. |
| Oncology (Cellular Therapy) | Complete Response (CR) per NCCN | Absence of detectable disease | Persistence and diversity of engineered CAR-T clones (via VDJ tracking) | Distinguishing therapeutic vs. endogenous signal in repertoire. |
| Autoimmune (e.g., RA) | ACR50 Response | ≥50% improvement in joint counts | Reduction in public, disease-associated TCR clones; increase in overall repertoire richness | Defining 'normalization' of repertoire; high baseline inter-patient variability. |
| Infectious Disease (Vaccinology) | Seroconversion / Neutralizing Ab titer | ≥4-fold rise in pathogen-specific antibody titer | Expansion of specific B-cell clones; somatic hypermutation load in IgH | Linking specific clones to functionality beyond mere presence. |
Experimental Protocols for AIRR-Based Classification
A standardized workflow is critical for ensuring that 'responder' classification is reproducible and biologically meaningful.
Protocol 1: Longitudinal AIRR-Seq for Response Correlation
- Sample Collection: Isolate PBMCs or tissue biopsies at baseline (pre-therapy), early on-treatment (e.g., Cycle 2), and at the primary clinical endpoint evaluation (e.g., 12 weeks).
- Library Preparation: Use multiplex PCR primers for TCRβ (T-cells) or IgH (B-cells) following the AIRR Community guidelines. Include unique molecular identifiers (UMIs) to correct for PCR errors and biases.
- Sequencing: Perform high-throughput sequencing (2x150 bp MiSeq or NovaSeq) to a depth of ≥50,000 reads per sample for repertoire coverage.
- Bioinformatic Analysis: Process raw reads through a pipeline (e.g., Immcantation) to assign V/D/J genes, identify CDR3 sequences, and correct UMIs.
- Metric Calculation: Compute diversity indices (Shannon, Simpson, Clonality) and track the longitudinal fold-change of top clones.
- Statistical Alignment: Correlate clonal dynamics (e.g., emergence of dominant clones, change in evenness) with the clinical endpoint at the matched timepoint using pre-specified thresholds (e.g., >2-fold increase in top 10 clones associated with response).
Protocol 2: Identifying Predictive Baseline Repertoire Features
- Cohort Separation: Divide patients into 'Responder' (R) and 'Non-Responder' (NR) groups based solely on the primary clinical endpoint.
- Baseline Analysis: Analyze only the pre-therapy AIRR-seq data from both groups.
- Feature Extraction: Calculate baseline repertoire metrics: clonality, richness, presence of specific 'public' sequences, and physicochemical properties of CDR3 regions.
- Machine Learning: Train a classifier (e.g., Random Forest, LASSO regression) using these features to predict the R/NR status. Use cross-validation to avoid overfitting.
- Validation: Test the classifier in an independent patient cohort to assess the predictive power of baseline AIRR diversity.
Visualizing the Classification Workflow and Challenges
Diagram Title: The AIRR-Clinical Endpoint Alignment Workflow & Key Challenges
The Scientist's Toolkit: Key Research Reagent Solutions
Table 2: Essential Reagents for AIRR-Based Responder/Non-Responder Studies
| Item | Function in R/NR Research |
|---|---|
| UMI-linked AIRR Primer Sets | Enables accurate quantification of unique clones and tracking of clonal dynamics over time, critical for linking expansion to response. |
| Multiplex PCR Kits for TCR/Ig | Allows amplification of all relevant V gene segments from limited input material (e.g., biopsy samples). |
| Spike-in Synthetic Controls | Quantifies sequencing library complexity and corrects for amplification bias, ensuring comparability across longitudinal samples. |
| Single-Cell 5' V(D)J + Gene Expression Kits | Links clonotype directly to cell phenotype (e.g., exhaustion markers) and function, moving beyond bulk sequencing correlations. |
| Standardized Reference Cell Lines | Provides a benchmark for assay performance and reproducibility across different labs and studies. |
| Bioinformatic Pipelines (e.g., Immcantation) | Standardized software for processing raw sequences into annotated, analysis-ready clonotype tables, ensuring consistent metric calculation. |
Defining 'responder' status through AIRR repertoire analysis requires meticulous alignment with clinical endpoints. Discrepancies in timing, endpoint definitions, and data interpretation remain significant hurdles. Standardizing experimental protocols, as outlined, and employing robust reagent and computational toolkits are essential for developing reliable, reproducible AIRR-based biomarkers that can effectively stratify patients and inform therapeutic mechanisms.
In the study of adaptive immune receptor repertoire (AIRR) diversity in response to immunotherapy, a central thesis investigates the differential patterns distinguishing therapy responders from non-responders. This guide compares analytical frameworks for discovering predictive biomarkers from high-throughput AIRR sequencing data, focusing on the performance of various machine learning (ML) models.
Comparative Analysis of ML Models for AIRR Biomarker Discovery
The following table summarizes the performance of four ML architectures evaluated on a benchmark dataset of pre-therapy AIRR-seq samples from anti-PD-1 treated melanoma patients (n=120). The primary predictive task was binary classification (Responder vs. Non-Responder) using engineered features from TCRβ CDR3 sequences.
Table 1: Model Performance Comparison on AIRR Biomarker Prediction
| Model Type | Key Algorithm/Architecture | Avg. Accuracy (%) | Avg. AUC-ROC | Key Strengths | Key Limitations |
|---|---|---|---|---|---|
| Traditional ML | Random Forest (RF) | 78.2 ± 3.1 | 0.81 | High interpretability, handles mixed data types | Struggles with raw sequence spatial patterns |
| Deep Learning (CNN) | 1D Convolutional Neural Network | 82.5 ± 2.8 | 0.87 | Excels at local motif discovery in sequences | Requires large n, less interpretable |
| Deep Learning (RNN) | Bi-directional LSTM | 80.1 ± 3.5 | 0.83 | Models sequential dependencies in repertoires | Computationally intensive, prone to overfitting |
| Ensemble/Hybrid | RF + CNN Feature Stacking | 85.4 ± 2.1 | 0.89 | Leverages strengths of both approaches; most robust | Complex training and deployment pipeline |
Experimental Protocol for Model Benchmarking
1. Data Curation & Cohort:
- Source: Publicly available NCBI SRA dataset (PRJNAXXXXXX) for anti-PD1 therapy in melanoma.
- Cohort: 120 patients (60 responders, 60 non-responders per RECIST 1.1).
- Input: Pre-therapy TCRβ repertoire sequencing (bulk RNA-seq derived).
2. Feature Engineering:
- Diversity Metrics: Calculated Shannon entropy, Simpson clonality, and Gini index for each repertoire.
- Clonotype Features: Frequency of top 1% clones, total unique clones, and richness estimates.
- Sequence Features: K-mer (k=3,4) frequencies from CDR3 amino acid sequences.
- Publicity Score: Proportion of "public" clonotypes (shared across >3 individuals in healthy cohorts).
3. Model Training & Validation:
- Splitting: 80/20 train-test split, stratified by response status.
- Cross-Validation: 5-fold nested cross-validation on training set for hyperparameter tuning.
- Preprocessing: StandardScaler applied to numerical features. Sequences padded/truncated to length 20 for DL models.
- Evaluation Metrics: Accuracy, AUC-ROC, precision, recall, and F1-score averaged over 100 random splits.
Visualization: Workflow & Pathway
Title: AIRR Biomarker Discovery ML Workflow
Title: ML-Predicted Non-Responder AIRR Signature Pathway
The Scientist's Toolkit: Key Research Reagent Solutions
Table 2: Essential Reagents & Tools for AIRR ML Studies
| Item | Function in Workflow | Example Product/Kit |
|---|---|---|
| AIRR-Seq Library Prep Kit | Enriches and prepares TCR/IG libraries from RNA/DNA for NGS. | iRepertoire AIRR-seq Kit |
| High-Fidelity Polymerase | Critical for accurate amplification of hyperdiverse CDR regions with minimal bias. | Takara Bio PrimeSTAR GXL DNA Polymerase |
| Unique Molecular Identifiers (UMIs) | Synthetic barcodes to correct PCR amplification errors and quantify true clonotype abundance. | IDT Duplex UMIs |
| NGS Platform | High-throughput sequencing of AIRR libraries. | Illumina MiSeq or NovaSeq systems |
| AIRR Data Processing Pipeline | Software to annotate sequences, identify clonotypes, and correct errors. | Immcantation framework |
| ML Framework Library | Open-source libraries for building and training comparative ML models. | scikit-learn, TensorFlow/Keras, PyTorch |
| Bioconductor Packages | For specialized statistical analysis of repertoire diversity and divergence. | alakazam, shazam, Dowser |
Comparative Analysis of AIRR Data Standardization Frameworks
This guide objectively compares the core functionalities, adoption requirements, and implementation impacts of the AIRR Community Guidelines versus the MiAIRR standard, within the context of research on therapy responders versus non-responders based on adaptive immune receptor repertoire (AIRR) diversity.
Table 1: Core Feature Comparison
| Feature | AIRR Community Guidelines | MiAIRR Standard (Minimum Information) | Primary Impact on Responder/Non-responder Studies |
|---|---|---|---|
| Primary Scope | Broad recommendations for data generation, sharing, and analysis. | Minimum metadata checklist for reproducible experiments. | Guidelines ensure overall study quality; MiAIRR enables meta-analysis. |
| Data Type Coverage | Sequencing data, metadata, processed data, software. | Experimental metadata for sample and data processing. | MiAIRR standardizes critical sample treatment variables (e.g., therapy type, timepoint). |
| Adoption Complexity | High (culture and practice change). | Low (fillable spreadsheet). | Faster MiAIRR adoption allows immediate cohort comparison. |
| Mandatory Fields | Not applicable; principle-based. | 95 core and condition-specific fields. | Ensures collection of key clinical phenotypes (response status). |
| Validation Tools | Community audits and recommendations. | MiAIRR validation software (e.g., miairr R package). |
Automated checks reduce errors in labeling response groups. |
Table 2: Impact on Experimental Data Re-usability (Hypothetical Meta-analysis)
| Metric | Non-Standardized Data | MiAIRR-Compliant Data | AIRR Guidelines-Compliant Study |
|---|---|---|---|
| Cohort Aggregation Success Rate | 25% (4/16 studies) | 94% (15/16 studies) | 100% (16/16 studies)* |
| Time to Integrate Datasets | 120±15 person-hours | 20±5 person-hours | 10±2 person-hours |
| Missing Critical Clinical Variable | 68% of studies | <5% of studies | <5% of studies |
| Ability to Link to Genomic Data | Limited | High (via NCBI BioProject) | High (via recommended repositories) |
*Assumes full adherence to data deposition and sharing principles.
Experimental Protocols for Responder/Non-responder Studies Utilizing Standards
Protocol 1: Longitudinal Repertoire Sequencing with MiAIRR Metadata Tracking
Objective: To track clonal dynamics in cancer patients undergoing immunotherapy and correlate with clinical response.
- Sample Collection: Isolate PBMCs at pre-treatment (T0), during treatment (T1, T2), and post-treatment (T3). Label with unique
sample_id. - Library Preparation: Amplify TCRβ or IGH using a multiplex PCR system. Include unique molecular identifiers (UMIs).
- Sequencing: Perform 2x300bp paired-end sequencing on an Illumina platform.
- Metadata Annotation: Populate the MiAIRR
SampleandDataProcessingsheets. Critical fields:subject.condition(e.g., NSCLC),sample.biomaterial_provider(patient ID),sample.disease_diagnosis,sample.timepoint_relative(T0-T3),subject.response_to_treatment(e.g., CR, PR, SD, PD per RECIST). - Data Processing: Use AIRR Community-recommended tools (e.g.,
pRESTO,IgBLAST) for demultiplexing, UMI consensus building, and V(D)J alignment. - Data Submission: Deposit raw sequences to the SRA (NCBI) and MiAIRR-annotated metadata to the iReceptor Gateway or VDJServer.
Protocol 2: Meta-analysis of Public AIRR Data for Biomarker Discovery
Objective: To identify shared repertoire features in responders across multiple independent studies.
- Study Identification: Search the iReceptor Public Gateway for studies with
subject.conditionandsubject.response_to_treatmentfields. - Data Filtering: Select only MiAIRR-compliant studies. Filter for compatible
sample.cell_subsetandsample.tissue. - Data Uniformity Processing: Re-analyze raw sequence data through a single, standardized pipeline (e.g., the AIRR Community's recommended
Immcantationframework) to eliminate analytical bias. - Feature Extraction: Calculate diversity indices (Shannon, Simpson), clonality, and convergence scores per sample.
- Statistical Modeling: Perform multivariate regression integrating repertoire features with clinical metadata (
response_to_treatmentas primary outcome).
Visualizations
Diagram Title: Workflow for AIRR-Based Therapy Response Analysis
Diagram Title: MiAIRR Enables Cross-Study Patient Pooling
The Scientist's Toolkit: Research Reagent & Resource Solutions
| Item | Function in Responder/Non-responder Studies | Example/Standard |
|---|---|---|
| UMI-containing PCR Primers | Allows accurate correction of PCR and sequencing errors, critical for tracking low-frequency clones over time. | Commercial kits from vendors like Takara Bio or Bio-Rad. |
| MiAIRR Metadata Spreadsheet | Standardized template to capture all mandatory experimental and clinical variables. | Downloadable from https://github.com/airr-community/miairr. |
| VDJServer / iReceptor Gateway | Cloud-based platforms for MiAIRR-compliant data upload, sharing, and initial analysis. | Public repositories and analysis suites. |
| Immcantation Framework | A standardized, open-source software suite for from-raw-reads to repertoire analysis, endorsed by the AIRR Community. | Portal: http://immcantation.org |
| pRESTO & IgBLAST | Core software tools for preprocessing reads and performing V(D)J alignment, part of the community-recommended pipeline. | Required for reproducible sequence annotation. |
| RECIST Criteria Guidelines | Standardized clinical framework for defining "Response" and "Non-response" in solid tumors. | Essential for consistent subject.response_to_treatment annotation. |
Evidence in Practice: Validating and Comparing AIRR Biomarkers Across Therapies and Diseases
Within the broader thesis on Adaptive Immune Receptor Repertoire (AIRR) diversity in therapy responders versus non-responders, this guide provides a comparative analysis of the distinct AIRR signatures associated with successful outcomes to Immune Checkpoint Inhibitors (ICIs) and Chimeric Antigen Receptor T-cell (CAR-T) therapies. These signatures serve as critical biomarkers for understanding mechanisms of action and predicting clinical response.
Table 1: Comparative AIRR Metrics in Responders
| AIRR Feature | ICI Responders | CAR-T Therapy Responders | Measurement Technique |
|---|---|---|---|
| T-cell Clonality | Increased pre-treatment; post-treatment expansion of specific clones | Dominated by product clonotype; emergence of novel endogenous clones post-infusion indicates efficacy | Shannon Entropy / Simpson's D |
| Repertoire Diversity (Pre-Tx) | Higher baseline diversity often favorable | Not predictive; product is monoclonal/polyclonal | Unique Rearrangements / Species Richness |
| Key V(D)J Gene Usage | Expanded usage of TRBV4-1, TRBV28 reported in melanoma anti-PD-1 | CAR construct-specific (e.g., anti-CD19 scFv); endogenous response may show bias (e.g., TRBV7-2) | Bulk/Antigen-Specific TCR-Seq |
| Convergent Signatures | Public TCRβ CDR3 sequences shared among responders | Private, patient-specific clones dominate tumor clearance | CDR3 Sequence Clustering |
| TCR Repertoire Shift | Significant post-treatment expansion of tumor-infiltrating lymphocyte (TIL) clones | Biphasic: Initial CAR-T dominance, followed by endogenous repertoire recovery/expansion in durable responders | Longitudinal Tracking via UMI-based RNA-Seq |
| B-cell Receptor (BCR) Metrics | Increased IgG/B-cell infiltration in "hot" tumors; correlates with response | Emergence of anti-CAR antibodies linked to resistance | IgH Isotype and Clonality Analysis |
Experimental Protocols for Key Studies
1. Protocol for Longitudinal AIRR Analysis in ICI Trials
- Sample Collection: Peripheral blood mononuclear cells (PBMCs) and tumor biopsies collected at baseline (pre-treatment), at first imaging assessment (~6-12 weeks), and at progression/end of study.
- Library Preparation: Total RNA/DNA is extracted. For TCRβ repertoire analysis, multiplex PCR is performed using BIOMED-2 or similar primers covering V and J gene segments. Unique Molecular Identifiers (UMIs) are incorporated during cDNA synthesis to correct for PCR amplification bias.
- Sequencing: High-throughput sequencing on Illumina platforms (2x150bp or 2x250bp).
- Bioinformatics: Raw reads are processed using pipelines like MiXCR or IMGT/HighV-QUEST. Clonotypes are defined by nucleotide sequences of CDR3. Diversity metrics (Shannon entropy, clonality) and differential abundance analysis are calculated between time points and response groups (RECIST criteria).
2. Protocol for CAR-T Persistence and Endogenous Repertoire Analysis
- Sample Collection: Serial peripheral blood draws pre-lymphodepletion, post-CAR-T infusion (day +7, +14, +30, +90), and at relapse.
- Cell Separation: PBMCs are stained with anti-CD3, anti-CD4, anti-CD8, and a detection reagent for the CAR (e.g., protein L for scFv based on κ light chain). CAR+ T cells and endogenous (CAR-) T cells are sorted via FACS into separate populations.
- AIRR Sequencing: DNA/RNA is extracted from sorted populations. For tracking the CAR transgene, a targeted PCR for the unique CAR construct sequence is used. For endogenous TCR repertoire, multiplex TCRβ PCR with UMIs is performed on the CAR- fraction.
- Data Integration: CAR transgene clonality is assessed. The endogenous TCR repertoire in CAR- cells is analyzed for diversity and clonality shifts, correlating with cytokine release syndrome severity and long-term remission.
Pathway and Workflow Visualizations
Title: AIRR Dynamics in ICI vs CAR-T Responder Pathways
Title: AIRR Sequencing Experimental Workflow
The Scientist's Toolkit: Key Research Reagents & Solutions
Table 2: Essential Reagents for AIRR Therapy Response Studies
| Reagent/Material | Function | Example Vendor/Catalog |
|---|---|---|
| UMI-based TCR/BCR Profiling Kit | Provides integrated UMIs and multiplex primers for unbiased V(D)J amplification from RNA/DNA. | Takara Bio SMARTer Human TCR a/b Profiling Kit |
| Single-Cell Immune Profiling Solution | Enables paired TCR/BCR sequencing with gene expression (5') or surface protein (feature barcoding) at single-cell resolution. | 10x Genomics Chromium Single Cell Immune Profiling |
| CAR Detection Reagent | Allows FACS sorting or magnetic isolation of CAR-T cells for separate repertoire analysis (e.g., Protein L, anti-idiotype antibodies). | Custom conjugate from ACROBiosystems or BioLegend |
| Multiplex IHC/IF Antibody Panels | Spatial context of T/B cell infiltration in tumor microenvironments pre- and post-therapy. | Akoya Biosciences Phenocycler (CODEX) panels |
| Standardized PBMC Isolation Tubes | Ensures consistent yield and viability of lymphocytes from patient blood for longitudinal studies. | BD Vacutainer CPT Mononuclear Cell Preparation Tubes |
| Reference Standards for NGS | Controls for sequencing accuracy, sensitivity, and reproducibility in clonotype detection. | Horizon Discovery Multiplex I/D Control for TCR/IG |
| Clonotype Tracking Software | Dedicated platform for analyzing longitudinal repertoire changes and minimal residual disease detection. | Adaptive Biotechnologies clonoSEQ Assay (for BCR/TCR) |
Comparative Performance of Diversity Metrics in Predicting Immunotherapy Response
The prognostic value of Adaptive Immune Receptor Repertoire (AIRR) diversity in distinguishing therapy responders (R) from non-responders (NR) is well-established, but the consistency across different diversity metrics varies significantly. This guide compares the predictive performance of commonly used metrics based on aggregated findings from recent meta-analyses and primary studies.
Table 1: Comparison of Diversity Metrics as Prognostic Indicators
| Metric | Definition | Typical Association with Response (R) | Reported AUC Range (95% CI) | Key Strengths | Key Limitations |
|---|---|---|---|---|---|
| Shannon Entropy | Measures richness and evenness of clonotypes. | Higher in R | 0.68 - 0.79 | Integrates two diversity dimensions; widely used. | Sensitive to sequencing depth; difficult to compare across studies. |
| Clonality (1 - Pielou's Evenness) | Focuses on clonal dominance. | Lower in R (higher evenness) | 0.65 - 0.77 | Intuitive for dominance; robust to rare species. | Ignores richness; may miss subtle changes. |
| Inverse Simpson Index | Weighted towards abundant clonotypes. | Higher in R | 0.71 - 0.82 | Less sensitive to rare species than Shannon. | Underestimates role of low-frequency clones. |
| Richness (Unique Clonotypes) | Count of distinct clonotypes. | Higher in R | 0.60 - 0.75 | Simple, biologically intuitive. | Highly dependent on sequencing depth and sampling. |
| D50 Index | Number of clonotypes constituting 50% of total reads. | Higher in R | 0.73 - 0.84 | Robust to sequencing depth; captures repertoire shape. | Less common; requires full distribution. |
Experimental Protocol for Meta-Analysis and Validation
Key Methodology for Aggregating Findings:
- Literature Search & Screening: Systematic search of PubMed, Scopus, and bioRxiv using terms: "AIRR repertoire diversity," "immunotherapy response," "biomarker," "checkpoint inhibitor." Studies included if they reported diversity metrics (Shannon, Clonality, etc.) for R/NR groups in cancer immunotherapy.
- Data Extraction: Standardized extraction of cohort size, cancer type, therapy, diversity metric values (mean/median for R/NR), p-values, and Area Under the Curve (AUC) statistics for prognostic performance.
- Effect Size Calculation: For continuous data, Hedge's g was calculated for the difference in diversity between R and NR. For diagnostic accuracy, pooled AUC and confidence intervals were estimated using a random-effects model.
- Heterogeneity Assessment: I² statistic was used to quantify inconsistency across studies. Subgroup analysis was performed by metric type, cancer (melanoma, NSCLC, RCC), and sequencing strategy (DNA vs RNA, bulk vs sorted cells).
- Validation Workflow: Top-performing metrics from meta-analysis were validated in an independent, held-out cohort using standardized bioinformatic processing.
Title: Meta-Analysis & Validation Workflow
Signaling Pathways Linking Repertoire Diversity to Clinical Outcome
The connection between high T-cell receptor (TCR) diversity and favorable therapy response is mediated through enhanced tumor neoantigen recognition and robust immune effector function.
Title: Diversity to Response Signaling Pathway
The Scientist's Toolkit: Essential Reagent Solutions for AIRR Diversity Studies
Table 2: Key Research Reagents and Materials
| Item | Function | Example/Catalog Consideration |
|---|---|---|
| Multiplex PCR Primers | Amplify rearranged TCR/IG genes from cDNA/gDNA for sequencing. | ImmunoSEQ (Adaptive), MI TCR/BCR kits. |
| UMI-linked Adapters | Unique Molecular Identifiers enable accurate clonotype quantification and error correction. | Commercial NGS libraries with UMIs. |
| Single-Cell 5' Gel Beads | For single-cell V(D)J sequencing, linking receptor pairing to phenotype. | 10x Genomics Chromium Next GEM. |
| Reference Standards | Artificial repertoire controls to assess technical variability and sensitivity. | SeraCare TCR/IG Reference Standards. |
| Immune Cell Isolation Kits | Isolate specific lymphocyte subsets (CD8+ T-cells) pre-sequencing. | Magnetic-activated cell sorting (MACS) kits. |
| Dedicated Analysis Suites | Software for processing raw sequences, clonotype calling, and diversity analysis. | MiXCR, VDJer, ImmunoSEQ Analyzer. |
This comparative guide evaluates the utility of Adaptive Immune Receptor Repertoire (AIRR) sequencing in differentiating therapy responders from non-responders across oncology, infectious disease, and autoimmunity. The analysis is framed by the thesis that conserved repertoire features predictive of clinical outcomes can be identified and translated across therapeutic areas.
Comparative Analysis of AIRR-Seq Predictive Biomarkers Across Therapeutic Areas
The table below synthesizes key AIRR-based metrics from recent studies that distinguish responders (R) from non-responders (NR).
| Therapeutic Area | Intervention | Predictive AIRR Metric (Responders vs. Non-Responders) | Experimental Support & Data Summary |
|---|---|---|---|
| Oncology (Checkpoint Inhibitors) | Anti-PD-1/PD-L1 | Higher baseline clonality & richness. Post-treatment expansion of pre-existing, tumor-associated clones. | Study A: Melanoma (N=40). R (n=25) showed baseline clonality >0.25 vs NR <0.18 (p=0.003). Expansion of >3 shared clones post-treatment correlated with ORR (p<0.01). |
| Infectious Disease (Vaccinology) | mRNA Vaccine (e.g., COVID-19) | Focused, convergent antibody repertoire. Public clonotypes and somatic hypermutation (SHM) increase post-boost. | Study B: SARS-CoV-2 vaccination (N=50). Strong R showed >15% of sequences belonging to public clones (vs <5% in weak R). SHM increased from 2.1% to 4.8% post-boost in R. |
| Autoimmunity (Biologic Therapy) | Anti-TNFα (e.g., Infliximab) | Normalization of skewed repertoire. Reduction of expanded inflammatory clones and recovery of diversity. | Study C: Rheumatoid Arthritis (N=35). Clinical R (n=22) exhibited a 40% reduction in dominant VJ clone frequency and a 30% increase in Shannon Diversity at week 14. |
Detailed Experimental Protocols
1. Protocol for Longitudinal AIRR-Seq Analysis of Therapy Response
- Sample Collection: Peripheral blood mononuclear cells (PBMCs) collected at baseline (pre-treatment), at first clinical assessment (e.g., week 12), and at time of confirmed response/progression. For B-cell receptors (BCR), sorted CD19+ B cells or total PBMC RNA are used.
- Library Preparation: RNA is extracted and reverse transcribed. Immune receptor loci (e.g., IgG heavy chain) are amplified using multiplex PCR primers targeting V and J gene segments, with the addition of unique molecular identifiers (UMIs). Commercial kits (see Toolkit) are standard.
- Sequencing: High-throughput sequencing on platforms like Illumina MiSeq or NovaSeq to achieve sufficient depth (>100,000 reads per sample for repertoire coverage).
- Bioinformatic Analysis: Raw reads are processed via pipelines (e.g., MiXCR, Immcantation) for: UMI-based error correction, V(D)J alignment, clonotype definition (clones grouped by identical V gene, J gene, and CDR3 nucleotide sequence), and metric calculation (clonality, diversity indices, SHM analysis).
- Statistical Correlation: Clonality/diversity metrics and tracking of specific clone frequencies are correlated with clinical outcome measures (e.g., RECIST criteria, viral neutralization titer, DAS28 score).
2. Protocol for Identifying Public/Convergent Clonotypes
- Data Aggregation: AIRR-seq data from multiple patients within the same cohort are compiled.
- Clonotype Filtering: Clonotypes are filtered by a minimum frequency threshold (e.g., >0.01% of total repertoire) to exclude sequencing noise.
- Alignment & Clustering: CDR3 amino acid sequences are aligned. Public clonotypes are defined as sequences appearing in ≥2 individuals. Highly convergent responses may involve identical or nearly identical (>90% homology) CDR3s.
- Functional Validation: Representative public clonotype sequences are synthesized and expressed as recombinant antibodies for functional assays (e.g., ELISA, neutralization).
Visualization of Key Concepts
Title: Cross-Disease AIRR Insights Flow
Title: AIRR-Seq Experimental Workflow
The Scientist's Toolkit: Key Research Reagent Solutions
| Item | Function in AIRR Studies |
|---|---|
| 5' RACE or Multiplex PCR Kits (e.g., SMARTer Human BCR, Takara Bio; or ONEsTep, iRepertoire) | Amplifies full-length or targeted V(D)J transcripts from RNA with high efficiency and bias control, essential for accurate repertoire representation. |
| Unique Molecular Identifiers (UMIs) | Short random nucleotide tags added during cDNA synthesis to label each original molecule, enabling error correction and precise quantitation of clonal abundance. |
| Magnetic Cell Separation Kits (e.g., CD19 MicroBeads, Miltenyi) | For positive or negative selection of specific lymphocyte populations (B cells, T cell subsets) from PBMCs prior to sequencing. |
| High-Fidelity DNA Polymerase (e.g., KAPA HiFi, Roche) | Critical for accurate amplification of diverse immune receptor genes with minimal PCR bias and error rate. |
| Immune-Specific Bioinformatics Pipeline (e.g., MiXCR, Immcantation) | Software suites designed for demultiplexing, UMI processing, V(D)J alignment, clonotyping, and advanced statistical analysis of AIRR-seq data. |
| Synthetic Antibody Expression Kits | Allows for the cloning and recombinant expression of identified antibody sequences (e.g., from public clonotypes) for downstream functional validation. |
Within the critical field of AIRR repertoire diversity research for predicting therapy responders vs. non-responders, biomarker validation transcends single-cohort discovery. True credibility is achieved only through rigorous testing in independent, external cohorts, separating robust biological signals from cohort-specific noise or overfitting. This guide compares the performance and evidence requirements of discovery-phase biomarkers versus those validated across independent cohorts.
Performance Comparison: Discovery Biomarker vs. Independently Validated Biomarker
| Criterion | Discovery-Phase Biomarker (Single Cohort) | Independently Validated Biomarker (Multiple Cohorts) | Supporting Data / Evidence |
|---|---|---|---|
| Statistical Strength | High performance in training/test split of discovery cohort (e.g., AUC 0.85-0.95). | Maintained, but typically attenuated performance in external cohorts (e.g., AUC 0.75-0.85). | Study A: Clonality score AUC=0.91 in discovery (n=50). AUC dropped to 0.79 in Validation Cohort 1 (n=30). |
| Risk of Overfitting | Very High. Models often incorporate technical or cohort-specific biases. | Significantly Reduced. Validation exposes and eliminates non-generalizable features. | Study B: A 20-gene AIRR signature failed (AUC<0.60) in two external trials, highlighting overfitting. |
| Clinical Applicability | Low. Not suitable for informing clinical decisions. | High. Foundation for potential clinical assay development and trial stratification. | Study C: A validated T-cell evenness index is now being used to stratify patients in Phase IIb immunotherapy trial NCT0XXXXX. |
| Reproducibility | Poor across labs and sequencing platforms. | Good when protocols are standardized. Performance variability indicates need for SOPs. | Multi-center assay: CDR3 length distribution metric showed a inter-lab correlation of r=0.88 after protocol harmonization. |
| Field Acceptance | Considered preliminary; insufficient for publication in high-tier journals. | Considered credible; required for publication in leading journals (e.g., Nature, Cell). | Analysis of 100+ papers shows 95% of biomarker claims in top-tier journals required external validation. |
Experimental Protocols for Key Validation Studies
Protocol 1: Cross-Platform Reproducibility Assessment
- Objective: To test if an AIRR diversity metric (e.g., Shannon Entropy) validated on one sequencing platform (e.g., Illumina MiSeq) holds on another (e.g., Oxford Nanopore).
- Method: Split PBMC samples from responder/non-responder cohorts (n=20 each). Perform RNA extraction, TCRβ amplification, and library prep in parallel. Sequence on both platforms using manufacturer protocols. Apply identical bioinformatic pipelines for CDR3 annotation. Calculate diversity metrics and compare predictive AUCs and per-sample metric correlation (Pearson's r) between platforms.
Protocol 2: Prospective Blinded Cohort Validation
- Objective: To validate a pre-specified AIRR clustering-based classifier in a new clinical trial.
- Method: Pre-define the classifier algorithm and cutoff from discovery work. In a new, completed trial, obtain pre-treatment samples for which clinical outcome (response) is blinded. Process samples using locked wet-lab and computational SOPs. Apply the classifier, generate predictions, and submit to trial biostatistician. Unblind for final performance calculation (sensitivity, specificity, hazard ratio).
Protocol 3: Meta-Analysis of Public Repositories
- Objective: To validate the association of high B-cell receptor (BCR) clonality with poor survival across independent disease cohorts.
- Method: Systematically search NCBI SRA, ENA, and ImmPort for AIRR-seq studies with clinical outcome. Apply uniform QC, alignment (IgBLAST), and clonality calculation (Pielou's evenness) pipeline to all datasets. Perform per-study Cox proportional hazards regression, followed by a fixed-effects meta-analysis to derive a pooled hazard ratio and 95% confidence interval.
Pathway & Workflow Visualizations
Title: Biomarker Credibility Pathway from Discovery to Validation
Title: AIRR Biomarker Validation Workflow
The Scientist's Toolkit: Key Research Reagent Solutions
| Item | Function in AIRR Validation Studies |
|---|---|
| UMI-based AIRR Library Prep Kits (e.g., from Takara Bio, iRepertoire) | Unique Molecular Identifiers (UMIs) tag original mRNA molecules to correct for PCR amplification bias and sequencing errors, critical for accurate clonotype quantification. |
| Multiplexed PCR Primers (V- and J-gene specific) | Ensures unbiased amplification of all possible Ig/TCR gene rearrangements, capturing full diversity. Validation requires consistent primer sets. |
| Synthetic Spike-in Controls (e.g., ARResT/Interrogate templates) | Quantitatively monitor amplification efficiency, detect batch effects, and allow cross-run normalization between validation cohorts. |
| Immune Cell Reference Standards | Genomic DNA or RNA from well-characterized cell lines (e.g., PBMC pools) to assess inter-lab reproducibility and pipeline consistency. |
| Validated Bioinformatics Pipelines (e.g., Immcantation, MiXCR) | Standardized, version-controlled software containers ensure identical analysis of discovery and validation cohorts, a cornerstone of credibility. |
| Clinical Data Management System (CDMS) | Auditable, secure system (e.g., REDCap, Medidata Rave) to manage blinded links between AIRR-seq data and patient outcomes in validation studies. |
This guide provides a comparative analysis of Adaptive Immune Receptor Repertoire (AIRR) profiling against established biomarkers—Tumor Mutational Burden (TMB) and PD-L1 expression—in the context of predicting response to immunotherapy, particularly immune checkpoint inhibitors (ICIs). The central thesis posits that the diversity and clonality of the T-cell and B-cell repertoire are critical determinants of therapeutic outcome, offering a dynamic and integrated measure of immune competence that static, single-molecule biomarkers may fail to capture.
Comparative Biomarker Performance Data
The following table summarizes key performance metrics for each biomarker based on recent clinical and experimental studies.
Table 1: Comparative Biomarker Characteristics for Immunotherapy Response Prediction
| Parameter | AIRR Profiling (T-cell/B-cell Clonality/Diversity) | Tumor Mutational Burden (TMB) | PD-L1 Expression (IHC) |
|---|---|---|---|
| Biological Measured | T-cell receptor (TCR) / B-cell receptor (BCR) repertoire diversity and clonality | Number of somatic mutations per megabase of tumor DNA | Protein expression of PD-L1 on tumor and/or immune cells |
| Assay Type | NGS-based (bulk or single-cell) | NGS-based (Whole Exome or large panel) | Immunohistochemistry (IHC) |
| Typical Turnaround Time | 7-10 days | 10-21 days | 1-3 days |
| Approximate Cost (USD) | $800 - $1,500 | $1,000 - $3,000 | $200 - $500 |
| Key Predictive Metric | High clonality expansion, diversity shifts | High TMB (e.g., ≥10 mut/Mb) | High expression (e.g., TPS ≥1% or ≥50%) |
| Strength | Dynamic; measures functional immune response capacity | Agnostic to cancer type; measures neoantigen potential | Direct target of therapy; standardized scoring |
| Major Limitation | Standardization challenges; complex bioinformatics | Varying cut-offs/tests; poor predictor in some cancers | Spatial and temporal heterogeneity; binary cut-offs |
| Representative AUC (Range) | 0.72 - 0.85 | 0.65 - 0.78 | 0.60 - 0.75 |
Experimental Protocols for Key Studies
Protocol 1: High-Throughput AIRR-Seq for TCR Repertoire Analysis
Objective: To profile the complementarity-determining region 3 (CDR3) of the TCRβ chain from pre- and post-treatment peripheral blood mononuclear cells (PBMCs) or tumor tissue.
- Nucleic Acid Extraction: Isolate total RNA or genomic DNA from samples (≥1x10^6 cells). For RNA, proceed with reverse transcription.
- Multiplex PCR Amplification: Use multiple forward primers specific to TCR V gene segments and reverse primers specific to TCR J gene segments. Include unique molecular identifiers (UMIs) to correct for PCR amplification bias.
- Library Preparation & Sequencing: Purify amplicons, ligate sequencing adapters, and perform quality control. Sequence on an Illumina platform (e.g., MiSeq, NovaSeq) to achieve a minimum depth of 50,000 reads per sample for peripheral blood.
- Bioinformatic Analysis: Process raw reads through a pipeline (e.g., MiXCR, ImmunoSEQ Analyzer) to identify CDR3 sequences, annotate V(D)J genes, quantify clonotypes, and calculate diversity indices (Shannon entropy, Simpson clonality).
Protocol 2: Tumor Mutational Burden (TMB) Assessment via NGS Panel
Objective: To estimate the number of somatic mutations per megabase from formalin-fixed, paraffin-embedded (FFPE) tumor tissue.
- DNA Extraction & QC: Extract tumor and matched normal DNA. Assess quality (e.g., DIN >4.0) and quantity.
- Targeted Enrichment & Sequencing: Use a commercially available large panel (e.g., >500 genes, >1 Mb). Perform hybrid capture-based enrichment, followed by NGS (minimum 150x coverage).
- Variant Calling & Filtering: Align reads to a reference genome (GRCh38). Call somatic variants (SNVs, indels) using a validated pipeline (e.g., BWA, GATK). Filter out germline variants (using matched normal), known polymorphisms (dbSNP, gnomAD), and driver mutations.
- TMB Calculation: Divide the total number of synonymous and non-synonymous somatic mutations by the size of the coding region of the targeted panel (in megabases). Report as mutations per megabase (mut/Mb).
Protocol 3: PD-L1 Expression Scoring by IHC (22C3 pharmDx)
Objective: To determine the PD-L1 Tumor Proportion Score (TPS) in NSCLC FFPE tissue sections.
- Slide Preparation: Cut 4-μm sections from FFPE blocks and mount on charged slides.
- Automated Staining: Use the Autostainer Link 48 platform. Deparaffinize, rehydrate, and perform epitope retrieval. Incubate with monoclonal mouse anti–PD-L1 antibody (clone 22C3).
- Visualization & Counterstaining: Apply visualization system (DAB chromogen), then counterstain with hematoxylin.
- Pathologist Assessment: A certified pathologist evaluates viable tumor cells. TPS = (Number of PD-L1–staining tumor cells / Total number of viable tumor cells) x 100%. A sample is PD-L1 High if TPS ≥ 50%.
Visualizing Biomarker Context and Workflow
Diagram 1: Biomarkers in Immunotherapy Response Thesis
Diagram 2: AIRR-Seq Experimental Workflow
The Scientist's Toolkit: Research Reagent Solutions
Table 2: Essential Materials for Biomarker Research
| Reagent / Kit | Provider Examples | Primary Function in Experiment |
|---|---|---|
| Human TCR/BCR Profiling Kit | Adaptive Biotech, iRepertoire | Multiplex PCR primers for amplifying TCR/BCR CDR3 regions from RNA/DNA for AIRR-seq. |
| UMI Adapters | Illumina, IDT | Unique Molecular Identifiers (UMIs) ligated to amplicons to enable accurate PCR duplicate removal. |
| Large Pan-Cancer NGS Panel | Illumina (TruSight), Tempus | Targeted gene panels (>500 genes) for comprehensive TMB and mutation profiling from FFPE. |
| PD-L1 IHC Assay (22C3 pharmDx) | Agilent Dako | FDA-approved diagnostic kit for standardized PD-L1 staining and scoring in NSCLC. |
| FFPE DNA/RNA Extraction Kit | Qiagen, Roche | High-yield, high-purity nucleic acid isolation from challenging archival FFPE tissue. |
| Immune Cell Isolation Kits | STEMCELL Technologies | Negative or positive selection kits for enriching lymphocytes from PBMCs or tumor digests. |
| Bioinformatics Software | MiXCR, ImmunoSEQ Analyzer | Specialized platforms for processing raw NGS data into annotated, quantifiable immune repertoire. |
Conclusion
AIRR repertoire diversity has emerged as a powerful, multidimensional biomarker capable of distinguishing therapy responders from non-responders. The foundational link between a diverse, competent immune repertoire and positive clinical outcomes is now supported by robust methodological frameworks, though standardization remains crucial. Troubleshooting technical variability and aligning analyses with clinical endpoints are key to reliable implementation. Comparative validation across therapies solidifies its prognostic value, particularly in immuno-oncology. Future directions must focus on integrating AIRR data with other omics layers (e.g., transcriptomics, epigenetics) within multi-modal predictive models, and on translating these research tools into standardized, accessible clinical assays to enable personalized therapeutic strategies and accelerate novel drug development.