Divergent Pathogenicity of SARS-CoV-2 Delta and Omicron Variants: Insights from 3D Respiratory Models
This article synthesizes current research comparing the pathogenicity of SARS-CoV-2 Delta and Omicron variants, with a specific focus on findings from advanced 3D respiratory models.
Divergent Pathogenicity of SARS-CoV-2 Delta and Omicron Variants: Insights from 3D Respiratory Models
Abstract
This article synthesizes current research comparing the pathogenicity of SARS-CoV-2 Delta and Omicron variants, with a specific focus on findings from advanced 3D respiratory models. It explores the foundational mechanisms of viral entry and replication, detailing how Delta variant's efficient TMPRSS2-mediated fusion and syncytia formation contrast with Omicron's altered cellular tropism. The review covers methodological applications of human airway epithelial (HAE) cultures and computational analyses for investigating host-pathogen interactions. It further addresses troubleshooting in variant-specific research and validates in vitro findings against animal model and human clinical data. Aimed at researchers and drug development professionals, this analysis provides a critical framework for understanding variant-specific pathogenesis and informs the development of targeted therapeutics.
Fundamental Mechanisms of Variant Pathogenicity: From Spike Protein to Cellular Entry
The emergence of SARS-CoV-2 variants of concern, particularly Delta and Omicron, represented a significant shift in the pandemic landscape, characterized by distinct mutations in the viral spike protein. These mutations critically alter the virus's infectivity, pathogenicity, and immune evasion capabilities. This guide provides a comparative computational analysis of the structural and functional consequences of Delta and Omicron spike protein mutations. We synthesize data from molecular dynamics simulations, binding affinity assessments, and ex vivo replication studies to objectively compare their mechanisms of action. The analysis is framed within research utilizing primary human nasal cultures and 3D respiratory models, offering insights relevant to therapeutic and vaccine development.
The evolution of SARS-CoV-2 has been marked by the emergence of variants with distinct pathogenic profiles, largely driven by mutations in the spike (S) protein. The Delta and Omicron variants represent two pivotal points in this evolution. The Delta variant is associated with more severe disease and a degree of immune evasion, whereas the Omicron variant demonstrates dramatically increased transmissibility but reduced intrinsic severity. These divergent clinical outcomes are rooted in fundamental differences in their spike protein structures and dynamics. This review leverages computational analyses and data from primary human respiratory models to dissect the molecular basis for these differences, providing a comparative guide for researchers and drug developers.
Mutational Landscapes and Their Structural Consequences
The Delta and Omicron variants possess unique and complex sets of mutations that define their behavior.
Key Mutations and Their Functional Roles
The following table summarizes the major spike protein mutations and their documented impacts for each variant.
Table 1: Comparative Overview of Key Spike Protein Mutations in Delta and Omicron Variants
| Feature | Delta Variant (B.1.617.2) | Omicron Variant (B.1.1.529) |
|---|---|---|
| Notable Mutations | T478K, L452R, P681R, D614G [1] [2] | K417N, N440K, G446S, S477N, T478K, E484A, Q493R, Q498R, N501Y, Y505H, D614G, H655Y, N679K, P681H [3] [4] [2] |
| Immune Evasion | Moderate; reduced susceptibility to neutralizing antibodies [1] | High; significant escape from vaccine- and infection-elicited antibodies [2] |
| Spike Protein Stability | Lower stability; mutations disturb complex stability [3] | Higher stability; unique mutational pattern enhances stability [3] [5] |
| Entry Pathway | Primarily TMPRSS2-dependent, membrane fusion pathway [6] | Increased cathepsin-dependent, endosomal entry pathway [6] |
Computational Analysis of Structural Stability
Protein Contact Network (PCN) analysis, which models protein structures as networks of amino acid interactions, reveals that Omicron’s mutations lead to a unique mutational pattern with distinct structural consequences compared to Alpha and Delta variants [5]. Molecular Dynamic (MD) simulations further show that while mutations in both variants disturb the stability of the spike protein or its complex with the hACE-2 receptor, the Delta variant has a greater instability impact [3]. This observed instability in the Delta spike protein complex may be linked to its reported higher pathogenicity.
Omicron’s stability is partly achieved through a trade-off. The D614G mutation weakens the interaction between the S1 and S2 subunits of the spike protein. However, several other Omicron-specific mutations (T547K, H655Y, N764K, N856K, N969K, L981F) enhance the S2-S1 interaction, compensating for the destabilizing effect of D614G and contributing to the variant's overall fitness [7].
Comparative Experimental Protocols and Data
To understand the real-world implications of these structural differences, researchers employ advanced ex vivo models and computational techniques.
Ex Vivo Replication Kinetics in Human Respiratory Tissues
A critical experimental protocol for evaluating variant-specific pathogenicity involves culturing human bronchus and lung tissue explants and directly comparing viral replication kinetics [6].
Table 2: Replication Capacity of SARS-CoV-2 Variants in Human Ex Vivo Cultures
| Variant | Replication in Human Bronchi | Replication in Human Lung Parenchyma | Reference |
|---|---|---|---|
| Wild-Type | Baseline | Baseline | [6] |
| Delta | Significantly higher than WT at 72h | Similar to or slightly reduced vs. WT | [6] |
| Omicron | Faster than all other VOCs at 24h and 48h; ~70-fold higher than WT | Significantly reduced replication compared to WT and Delta | [6] |
This data provides a clear biological correlate for epidemiological observations: Omicron's high replication in the upper airway facilitates transmission, while its poor replication in the lungs is a key factor underlying its reduced severity [6]. Complementary research in primary human nasal cultures confirms that Omicron is the fastest-replicating variant in the upper airway, while Delta is the most cytopathic, causing the most damage to the respiratory epithelium, including loss of ciliary function [8].
Computational Evaluation of Binding Dynamics
The binding affinity between the spike Receptor Binding Domain (RBD) and the human angiotensin-converting enzyme 2 (hACE-2) receptor is a critical determinant of infectivity. Computational studies use molecular docking and dynamics simulations to evaluate this.
Methodology Overview:
- Structures: The crystal structure of the SARS-CoV-2 spike glycoprotein in complex with hACE-2 (e.g., PDB ID: 7DF4) is obtained [3].
- Mutagenesis: Mutations for each variant are introduced into the wild-type spike protein structure using tools like the rotamer library in UCSF Chimera [3].
- Docking: The spike RBD for each variant is docked to hACE-2 using servers like HADDOCK [3].
- Simulations & Analysis: Molecular dynamics (MD) simulations (e.g., using AMBER) are run on the docked complexes. Post-simulation analysis, such as calculating binding free energy with methods like MM/PBSA, reveals the strength and stability of the interaction [3] [9].
Findings from these analyses show that the Omicron variant has high receptiveness towards hACE-2 compared to the Delta variant, contributing to its increased transmission [3]. Interestingly, a computational analysis introducing a Binding Influence Score found that most of Omicron's RBD mutations, except for N501Y, actually reduce ACE2 binding affinity when considered in isolation. However, this reduced affinity is offset by other mutations that dramatically increase the propensity of the spike protein to adopt an "open" conformation, thereby increasing the chances of initiating contact with ACE2 [4].
Diagram 1: Relationship between spike protein mutations and the pathogenic profiles of Delta and Omicron variants. Mutations drive differences in stability, binding, and entry, which ultimately determine tissue tropism and clinical severity.
The Scientist's Toolkit: Key Research Reagent Solutions
Research into the structural biology and pathogenicity of SARS-CoV-2 variants relies on a suite of specialized reagents and model systems.
Table 3: Essential Research Reagents and Models for Variant Analysis
| Tool / Reagent | Function / Application | Relevance to Variant Research |
|---|---|---|
| Primary Human Nasal Cultures (ALI) | Models human upper respiratory infection; assesses viral replication, cytopathicity, and host responses [8]. | Directly demonstrated Omicron's fast replication and Delta's high cytopathicity in the human airway [8]. |
| Ex Vivo Human Bronchus/Lung Explants | Provides a physiologically relevant model of the human lower respiratory tract [6]. | Showcased Omicron's tropism for the bronchus and impaired replication in lung tissue, explaining reduced severity [6]. |
| hACE-2 Expressing Cell Lines | Cell lines engineered to express the human ACE2 receptor for in vitro infection studies. | Fundamental for testing viral entry efficiency, tissue tropism, and neutralization assays across variants. |
| Molecular Dynamics Software (AMBER, GROMACS) | Simulates physical movements of atoms and molecules over time to explore structural stability and interactions [3]. | Revealed differences in spike protein stability and RBD-hACE2 binding energy between Delta and Omicron [3] [9]. |
| Molecular Docking Servers (HADDOCK) | Computationally predicts the preferred orientation of a protein (spike) when bound to its receptor (hACE-2) [3]. | Used to evaluate how specific mutations alter the binding interface and affinity of the spike protein [3] [4]. |
The computational and experimental data clearly delineate the structural and functional divergence between the Delta and Omicron spike proteins. The Delta variant's profile—characterized by moderate binding affinity, TMPRSS2-driven entry, and efficient lung replication—underpins its heightened pathogenicity. In contrast, the Omicron variant's profile—featuring a stabilized spike, altered entry pathway, and superior upper respiratory replication—accounts for its hyper-transmissibility but attenuated severity. For researchers and drug developers, these findings underscore the necessity of targeting conserved viral regions or host factors, such as TMPRSS2, to develop broad-spectrum therapeutics and vaccines resilient to ongoing viral evolution.
The cellular entry of SARS-CoV-2 is a critical determinant of viral tropism, transmission, and pathogenesis. This process is mediated primarily by the viral spike (S) protein and its interactions with host cell receptors [10]. While angiotensin-converting enzyme 2 (ACE2) serves as the primary entry receptor, its affinity alone does not fully explain the distinct pathogenic profiles observed among SARS-CoV-2 variants [10] [11]. The Omicron variant, characterized by numerous mutations in its spike protein, exhibits significantly altered receptor binding properties compared to earlier variants like Delta [12] [13]. These differences are particularly evident in their utilization of alternative receptors and entry pathways, including those involving Neuropilin-1 (NRP1) and different cellular proteases [14] [11]. Understanding these variant-specific interactions is crucial for explaining their differing clinical manifestations and for developing targeted therapeutic interventions. This review synthesizes current evidence on the differential binding affinities of SARS-CoV-2 variants to ACE2 and NRP1, and explores how these interactions shape viral entry pathways and ultimately, disease outcomes.
Quantitative Comparison of Variant-Receptor Interactions
The Delta and Omicron variants of SARS-CoV-2 exhibit distinct quantitative profiles in their interactions with host receptors and subsequent entry pathways. These differences, summarized in the table below, significantly influence their cellular tropism and pathogenicity.
Table 1: Comparative Analysis of Delta and Omicron Variant-Receptor Interactions and Entry Pathways
| Parameter | Delta Variant (B.1.617.2) | Omicron Variant (B.1.1.529) | Experimental Evidence |
|---|---|---|---|
| ACE2 Binding Affinity | High affinity, efficient utilization | Enhanced binding strength compared to Delta [12] | Surface plasmon resonance and pseudovirus entry assays [12] |
| NRP1 Utilization | Efficient utilization of NRP1-mediated entry | Reduced NRP1 dependence [13] | Blocking antibody assays and infection studies in NRP1-expressing cells [13] [11] |
| Primary Entry Route | TMPRSS2-mediated plasma membrane fusion [13] | Cathepsin-dependent endosomal entry [13] | Infection studies with protease inhibitors in Calu-3 and Caco-2 cells [13] |
| Cell Entry Rate | High cell entry rate | Significantly lower cell entry rate [13] | Mathematical modeling of infection kinetics in lung and intestinal cell lines [13] |
| Fusogenicity | High syncytia formation [15] [16] | Attenuated fusogenicity (BA.1/BA.2); Enhanced in BA.5 [15] | Quantitative syncytia formation assays in VeroE6/TMPRSS2 cells [15] |
| Innate Immune Activation | Moderate cytokine production | Stronger cytokine production rate in infected cells [13] | Transcriptomic analysis of infected cells and mathematical modeling [13] |
Table 2: Comparative Pathogenicity of SARS-CoV-2 Variants in Respiratory Models
| Variant | In Vitro Replication (Calu-3) | Barrier Disruption (Airway-on-a-Chip) | In Vivo Pathogenicity (Hamster Model) |
|---|---|---|---|
| Ancestral (B.1.1) | High [15] | Severe respiratory epithelial and endothelial barrier disruption [15] | Severe weight loss, respiratory dysfunction [15] |
| Delta | High (similar to ancestral) [17] | Not fully characterized | Augmented lung pathology, immune cell infiltration [17] |
| Omicron BA.1 | Lower replication rate [15] | Moderate disruption [15] | Minimal weight change, milder respiratory dysfunction [15] |
| Omicron BA.2 | Intermediate between BA.1 and BA.5 [15] | Moderate disruption [15] | Minimal weight change, milder respiratory dysfunction [15] |
| Omicron BA.5 | Comparable to ancestral virus [15] | Enhanced disruption compared to BA.1/BA.2 [15] | Moderate weight loss, slightly higher than other Omicron subvariants [15] |
Key Experimental Methodologies in Receptor Binding Studies
Mathematical Modeling of Viral Entry Dynamics
Mathematical modeling has provided crucial insights into the differential entry mechanisms of SARS-CoV-2 variants. A refined integro-differential equation model was fitted to experimental data from Delta and Omicron infections in Caco-2 (human intestinal epithelium model) and Calu-3 (lung epithelium model) cell lines [13]. The experimental data included infectious virus titers determined by TCID50 assays at 8, 24, and 48 hours post-infection (hpi), and intracellular viral RNA measurements using RT-qPCR at 2, 8, 24, and 48 hpi [13]. The model quantified variant- and cell-line-specific parameters, particularly the cell entry rate and cytokine production rate, revealing that Omicron has a significantly lower cell entry rate but triggers a stronger innate immune response in infected cells compared to the Delta variant [13].
Airway-on-a-Chip Model for Barrier Function Assessment
Advanced 3D respiratory models have been instrumental in quantifying variant-specific effects on tissue integrity. In one methodology, researchers utilized airway-on-a-chip devices to evaluate the capacity of different Omicron subvariants to disrupt respiratory epithelial and endothelial barriers [15]. The experimental workflow involved infecting the airway channel of the device with different variants and subsequently measuring the amount of virus that migrated to the blood vessel channel [15]. This approach allowed for quantitative assessment of barrier disruption by different variants. Results demonstrated that BA.5 caused more severe barrier damage compared to BA.1 and BA.2, though less than the ancestral B.1.1 strain [15]. Additionally, decreased expression of CLDN5, a crucial component for sustaining vascular endothelial barrier integrity, was observed in endothelial cells infected with B.1.1 and BA.5 variants [15].
Structural and Biochemical Analysis of NRP1 Interactions
The interaction between SARS-CoV-2 spike protein and NRP1 has been characterized through structural, biochemical, and molecular dynamics studies. These investigations revealed that furin-mediated cleavage at the S1/S2 junction of the spike protein exposes a C-terminal motif (RRAR) that conforms to the C-end Rule (CendR) [14] [11]. This exposed motif binds with high affinity to the b1 domain of NRP1 [14]. Crystallographic data demonstrate that the terminal arginine residue (R685) of the spike protein forms stable electrostatic and cation-π interactions with conserved aromatic residues within NRP1's b1 domain, specifically Y297, W301, and Y353 [14]. Functional validation through mutagenesis confirmed that deletion of the RRAR motif or replacement of R685 severely disrupts spike-NRP1 interaction, significantly reducing viral infectivity [14].
Molecular Mechanisms of Receptor-Mediated Entry
ACE2-Dependent Entry Pathways
The primary pathway for SARS-CoV-2 entry begins with spike protein binding to ACE2, followed by conformational changes that enable membrane fusion [10]. The spike protein is cleaved by host proteases into S1 and S2 subunits, with the S1 subunit containing the receptor-binding domain (RBD) that directly engages ACE2 [10]. Upon ACE2 binding, the spike protein undergoes additional conformational changes that expose the S2' cleavage site, which is processed by proteases such as TMPRSS2 at the cell surface or cathepsin L in endosomes [10]. This proteolytic activation releases the fusion peptide, initiating fusion pore formation and viral entry [10]. Variants differ significantly in their preferred entry route: Delta utilizes TMPRSS2-mediated plasma membrane fusion more efficiently, while Omicron favors cathepsin-dependent endosomal entry [13].
NRP1 as a Critical Co-receptor
NRP1 serves as a crucial co-receptor that enhances SARS-CoV-2 infectivity, particularly in cell types with low ACE2 expression [14] [11]. Unlike ACE2, NRP1 does not mediate initial viral attachment but rather facilitates viral internalization through endocytic pathways resembling macropinocytosis [14]. The mechanism depends on prior furin cleavage of the spike protein, which exposes the C-terminal RRAR motif [11]. This motif then binds to the b1 domain of NRP1, significantly potentiating viral infectivity [11]. Blocking this interaction with specific monoclonal antibodies reduces viral infection by approximately 40% in cell culture models [11]. The RRAR motif shows remarkable evolutionary conservation (>98%) across variants circulating in Mexico, suggesting NRP1 represents a stable therapeutic target less vulnerable to viral mutation [14].
Differential Innate Immune Activation
Beyond their roles in viral entry, ACE2 and NRP1 interactions trigger variant-specific innate immune responses. Mathematical modeling of variant infections in human epithelial cells indicates that Omicron triggers a stronger cytokine production rate in infected cells compared to Delta [13]. This enhanced innate immune activation ultimately renders uninfected cells more resistant to viral infection, potentially explaining the attenuated pathogenicity of Omicron despite its high transmissibility [13]. Transcriptomic analyses of infected lung tissues further support these findings, showing that Delta variant infection leads to more pronounced induction of immune mediators and metabolic enzymes such as Arg-1 and IDO1 compared to Omicron infection [17].
The Scientist's Toolkit: Essential Research Reagents
Table 3: Key Research Reagents for Studying SARS-CoV-2 Receptor Interactions
| Reagent / Method | Specific Application | Key Function in Research |
|---|---|---|
| Pseudovirus Systems | Viral entry assays | Enables study of viral entry mechanisms without requiring BSL-3 facilities [11] |
| VeroE6/TMPRSS2 Cells | Viral propagation and titration | Cell line optimized for efficient SARS-CoV-2 isolation and growth [15] [16] |
| Calu-3 Cell Line | In vitro infection models | Human lung epithelial cell model expressing ACE2 and TMPRSS2 [13] |
| Caco-2 Cell Line | In vitro infection models | Human intestinal epithelium model expressing ACE2 and TMPRSS2 [13] |
| Airway-on-a-Chip | Barrier function assessment | Microfluidic device modeling human respiratory epithelial-endothelial interface [15] |
| NRP1 Blocking Antibodies | Receptor function studies | Specifically inhibits spike protein binding to NRP1 b1 domain [11] |
| TCID50 Assay | Viral quantification | Measures infectious virus titers in cell culture supernatants [13] |
| siRNA against NRP1 | Gene silencing studies | Evaluates NRP1 role in viral entry through knockdown approaches [14] |
The differential binding affinities of SARS-CoV-2 variants to host receptors ACE2 and NRP1 fundamentally shape their entry pathways and pathogenic profiles. While the Delta variant exhibits efficient ACE2 binding and TMPRSS2-mediated plasma membrane fusion, the Omicron variant has evolved enhanced ACE2 binding affinity but reduced efficiency in TMPRSS2 utilization and NRP1-mediated entry. These differences in receptor preference correspond to Omicron's shift toward endosomal entry pathways and its attenuated fusogenicity, particularly in early subvariants. The conservation of the NRP1-binding RRAR motif across variants, coupled with the stable expression of NRP1 in human tissues, highlights its potential as a therapeutic target. Future research should focus on characterizing receptor interactions of emerging variants and developing intervention strategies that simultaneously target multiple entry pathways to overcome viral evolution.
The emergence of SARS-CoV-2 variants of concern, particularly Delta and Omicron, revealed significant divergences in viral pathogenesis. A critical factor underlying these differences is altered cellular tropism, driven by how each variant utilizes host cell entry mechanisms. This guide objectively compares the TMPRSS2 utilization and membrane fusion efficiency of the Delta and Omicron variants, synthesizing key experimental findings from respiratory and intestinal models. The core distinction lies in Omicron's shift away from TMPRSS2-dependent plasma membrane fusion towards endocytic pathway entry, a fundamental reprogramming with direct implications for viral pathogenicity and tissue-specific replication [18] [19].
Experimental Protocols for Key Findings
Viral Replication Kinetics Assay
Objective: To compare the replication efficiency of Delta and Omicron variants in different cell lines modeling the human respiratory and gastrointestinal tracts [18] [19].
- Cell Lines: VeroE6/TMPRSS2 (kidney epithelium, engineered), Calu-3 (lung epithelium, endogenous TMPRSS2), Caco-2 (colon epithelium, endogenous TMPRSS2), and primary human nasal epithelial cultures (hNECs) [18] [19].
- Infection: Cells are inoculated with a standardized multiplicity of infection (MOI) (e.g., 0.1 TCID50 for VeroE6/TMPRSS2 and Caco-2; 0.5 for Calu-3). After a 1-2 hour adsorption period, the inoculum is removed, cells are washed, and fresh medium is applied [19] [20].
- Data Collection: Supernatants are collected at multiple time points post-infection (e.g., 1, 12, 24, 48, 72 hours). Viral load is quantified via RT-qPCR targeting the SARS-CoV-2 E gene, and infectious virus titers are determined by 50% tissue culture infectious dose (TCID50) assay [18] [19].
- Key Outcome: Replication kinetics are plotted over time to compare peak viral titers and growth rates between variants in each cell type.
Viral Entry Pathway Inhibition Assay
Objective: To delineate the specific entry pathways (TMPRSS2-mediated vs. endosomal) used by Delta and Omicron [19].
- Inhibitors: Cells are pre-treated with specific chemical inhibitors:
- Infection and Analysis: Treated cells are infected with Delta or Omicron pseudotyped viruses or live isolates. The extent of infection is measured 24-48 hours post-infection via luciferase activity (for pseudoviruses) or viral RNA quantification. The percentage inhibition of entry by each drug is calculated relative to an untreated infected control [19].
- Key Outcome: The differential sensitivity to camostat versus bafilomycin A1/chloroquine indicates the preferred entry route for each variant.
Cell-Cell Fusion Assay
Objective: To evaluate the syncytium-forming capability of the Delta and Omicron spike proteins, a proxy for membrane fusion efficiency [18] [19].
- Method: VeroE6/TMPRSS2 cells are transfected with a plasmid encoding Green Fluorescent Protein (GFP). Subsequently, the cells are infected with live Delta or Omicron virus, or transfected with spike protein-expression plasmids.
- Visualization and Quantification: At 24, 48, and 72 hours post-infection/transfection, cells are imaged using fluorescence microscopy. Syncytia formation—multinucleated giant cells resulting from spike-mediated fusion—is assessed by counting the number of nuclei within GFP-positive fused cell areas [18] [19].
- Key Outcome: The relative extent and kinetics of syncytia formation provide a direct measure of the fusogenicity of each variant's spike protein.
Comparative Data Analysis
The experimental protocols yield consistent, quantifiable data highlighting the distinct biological behaviors of the Delta and Omicron variants.
Table 1: Comparative Replication and Entry of SARS-CoV-2 Delta and Omicron Variants
| Parameter | Delta Variant | Omicron Variant | Experimental Context |
|---|---|---|---|
| Replication in Calu-3 (Lung) | High (≥1 log10 higher RNA) [18] | Significantly lower [18] | Live virus infection [18] |
| Replication in Caco-2 (Gut) | High [18] | Lower (∼1 log10 less infectious virus) [18] | Live virus infection [18] |
| Replication in hNECs (Nose) | Similar to Omicron [18] | Similar to Delta [18] | Live virus infection [18] |
| TMPRSS2 Usage | Efficient [18] [19] | Inefficient [18] [19] | Inhibition by camostat [19] |
| Endosomal Entry | Secondary pathway [19] | Primary pathway [18] [19] | Inhibition by bafilomycin A1 [19] |
| Spike Cleavage (S1/S2) | Highly efficient [18] | Less efficient [18] | Analysis of purified virions [18] |
| Syncytium Formation | Robust [18] [19] | Substantially impaired [18] [19] | Cell-cell fusion assay [18] [19] |
Table 2: Summary of Pathogenicity-Associated Findings from Animal Models
| Observation | Delta Variant | Omicron Variant | Model System |
|---|---|---|---|
| Lung Pathology | Enhanced damage, immune cell infiltration [17] | Reduced damage [17] | Golden Syrian Hamster [17] |
| Viral Titers in Lungs | Higher [21] [17] | Lower [21] [17] | K18-hACE2 Mice / GSH [21] [17] |
| Immune/Inflammatory Gene Upregulation | Marked upregulation of cytokines, chemokines [21] | Muted immune response [21] | K18-hACE2 Mice [21] |
| Overall Pathogenicity Ranking | High [21] | Lower [21] | Comparative analysis [21] |
Mechanisms Underlying Cellular Tropism
The data presented above can be traced to fundamental differences in how the Delta and Omicron spike proteins interact with host cell factors. The following diagram synthesizes the core mechanistic pathways that dictate variant-specific cellular tropism.
The molecular basis for the pathway divergence illustrated in Figure 1 is well-established. Omicron's less efficient cleavage of its spike protein at the S1/S2 site limits its ability to be activated by TMPRSS2 at the plasma membrane [18]. This, combined with its mutations, causes a shift in tropism away from TMPRSS2-rich cells like lung alveolar type II cells and toward cells where endocytic entry is more prevalent [18]. Consequently, Omicron's impaired syncytia formation is a direct result of its reduced reliance on TMPRSS2, a protease that promotes efficient cell-surface fusion [18] [19]. This attenuated fusogenicity is a key contributor to its reduced pathogenicity observed in models [21] [17]. Mathematical models further confirm that this difference cannot be explained by entry efficiency alone; Omicron also triggers a stronger innate immune response in infected cells, further curtailing its replication in certain cell types [20].
The Scientist's Toolkit
To investigate viral tropism and entry mechanisms, researchers rely on a specific set of reagents and model systems. The following table details key solutions used in the studies cited herein.
Table 3: Essential Research Reagents and Models for Studying Viral Entry
| Reagent / Model | Function in Research | Key Application/Finding |
|---|---|---|
| Calu-3 Cell Line | Model of human lung epithelium with robust endogenous TMPRSS2 expression. | Demonstrates Delta's superior replication in TMPRSS2+ lung cells [18] [19]. |
| Caco-2 Cell Line | Model of human intestinal epithelium expressing ACE2 and TMPRSS2. | Highlights variant-specific tropism differences in the gut [18] [20]. |
| VeroE6/TMPRSS2 Cells | Engineered kidney cell line that overexpresses human TMPRSS2. | Used to enhance virus isolation and study TMPRSS2-dependent entry [19]. |
| Camostat Mesylate | Small-molecule inhibitor of TMPRSS2. | Potently inhibits Delta entry but not Omicron, defining entry pathway preference [19]. |
| Bafilomycin A1 | Inhibitor of endosomal acidification, blocking endosomal entry. | Inhibits both Delta and Omicron, confirming Omicron's endosomal dependence [19]. |
| Primary hNEC Cultures | Physiologically relevant 3D model of the human upper airway. | Shows both variants replicate equally well in the nose, explaining high transmissibility [18]. |
The differential pathogenicity and transmission efficiency of SARS-CoV-2 variants of concern, particularly Delta and Omicron, have been defining characteristics of the COVID-19 pandemic. A key to understanding these differences lies in elucidating the early infection kinetics—the initial viral entry and replication dynamics within the respiratory epithelium. This comparative guide objectively analyzes the performance of these variants using advanced 3D respiratory models that closely mimic human physiology. These experimental systems, including air-liquid interface (ALI) cultures, organoids, and lung-on-a-chip technologies, provide unprecedented insight into viral tropism, replication efficiency, and host response patterns. By synthesizing data from controlled infection studies, this review establishes a foundational framework for understanding variant-specific pathogenesis and identifies critical experimental parameters for drug development professionals evaluating antiviral efficacy.
Comparative Viral Kinetics of Delta and Omicron Variants
Viral Entry Mechanisms and Cellular Tropism
The fundamental divergence between Delta and Omicron variants begins at the point of cellular entry, where distinct pathway preferences significantly influence tissue tropism and disease presentation.
Delta Variant Entry: Delta predominantly utilizes the TMPRSS2-dependent pathway, which facilitates direct fusion at the plasma membrane. This entry mechanism favors infection of cells with high TMPRSS2 expression, particularly in the lower respiratory tract where this protease is abundantly expressed. The reliance on TMPRSS2 makes Delta highly effective at infecting lung tissues but limits its entry options in cell types with low TMPRSS2 expression [22] [16].
Omicron Variant Entry: Omicron employs a dual-entry strategy with enhanced efficiency in TMPRSS2-independent pathways, primarily through endosomal uptake. This allows Omicron to infect a broader range of cell types, including those with limited TMPRSS2 expression. The variant's spike protein mutations optimize it for ACE2 binding affinity while reducing TMPRSS2 dependence, explaining its preferential replication in upper airway epithelia compared to lung tissue [12] [22].
Cellular Tropism Differences: Single-cell RNA sequencing analyses reveal that SARS-CoV-2 preferentially enters via ciliated cell precursors, with infected mature ciliated cells then signaling to basal cells to induce rapid differentiation. This creates a feedforward loop of infection that is mitigated by cell-cell communication before interferon signaling begins approximately three days post-infection [23]. Age significantly influences cellular tropism, with paediatric nasal epithelial cultures showing higher infection of goblet cell types, while adult and older adult cultures demonstrate increased susceptibility in secretory cell types [24].
Replication Dynamics in Respiratory Compartments
The replication efficiency of Delta and Omicron variants differs dramatically between upper and lower respiratory compartments, explaining their distinct clinical manifestations.
Nasal Epithelium Replication: Omicron demonstrates a significant replication advantage in nasal epithelial cells compared to Delta. Mathematical modeling of viral kinetics indicates Omicron has approximately 200-fold higher infectivity in nasal cells, though its virus production rate is approximately 100-fold lower than Delta. This results in a higher basic reproduction number (R₀) and faster growth rate for Omicron in upper airways, explaining its substantial transmission advantage [22] [24].
Lung Tissue Replication: In stark contrast to its nasal replication profile, Omicron shows impaired replication capacity in lung cells compared to Delta. Viral kinetic models demonstrate Delta has a significantly higher virus production rate in lung tissues, leading to more severe parenchymal infection and lung pathology. This replication deficiency in lower airways provides a mechanistic explanation for Omicron's reduced disease severity despite its heightened transmissibility [22] [17].
Age-Dependent Replication Patterns: Infected older adult nasal epithelial cultures produce >800-fold higher titers of infectious particles compared to paediatric cultures at 72 hours post-infection. This age-associated replication efficiency correlates with broader cellular tropism in older adults, where 11 different cell types show infection compared to only 3 cell types in paediatric cultures [24].
Table 1: Comparative Viral Kinetic Parameters of Delta and Omicron Variants
| Parameter | Delta Variant | Omicron Variant | Experimental System |
|---|---|---|---|
| Infectivity in Nasal Cells | Baseline | ~200-fold increase | Primary human nasal epithelial cells (hNECs) [22] |
| Virus Production Rate in Nasal Cells | Baseline | ~100-fold decrease | Primary human nasal epithelial cells (hNECs) [22] |
| Basic Reproduction Number (R₀) in Nasal Cells | Lower | Significantly higher | Viral kinetics modeling [22] |
| Replication in Lung Cells | Highly efficient | Less efficient | Calu-3 lung cells [22] |
| Primary Entry Pathway | TMPRSS2-dependent | TMPRSS2-independent endosomal entry | Viral entry inhibition assays [22] |
| Preferred Infection Site | Lower respiratory tract | Upper respiratory tract | Multi-model analysis [22] [24] |
Experimental Models for Viral Kinetics Assessment
Advanced 3D Respiratory Model Systems
The physiological relevance of experimental models critically influences the accuracy of viral kinetics assessment. Conventional 2D cell cultures and animal models have significant limitations in recapitulating human-specific responses to infection.
Air-Liquid Interface (ALI) Cultures: These systems cultivate human bronchial epithelial cells on transwell membranes where they differentiate into a pseudostratified mucociliary epithelium that closely mimics native airway tissue. ALI cultures contain all major airway cell types, including basal, goblet, club, and ciliated cells, as well as ionocytes. This model has proven exceptionally valuable for studying early SARS-CoV-2 infection events, demonstrating that the virus triggers rapid differentiation of basal cells and creates a feedforward loop of infection [23] [25]. ALI cultures from different age donors have revealed age-specific responses, with older adult cultures showing increased viral spread and production compared to paediatric cultures [24].
Lung Organoids: These self-organizing 3D structures derived from pluripotent or adult stem cells recapitulate key aspects of lung development and organization. Organoids model both proximal and distal lung regions and can include multiple cell types present in native tissue. They have been successfully employed for SARS-CoV-2 pathogenesis studies and antiviral drug testing, leading to the identification of several inhibitors including imatinib, mycophenolic acid, and quinacrine dihydrochloride [25]. A limitation of conventional organoid systems is the general absence of vascularization and immune components, which restricts study of immune cell recruitment and systemic drug delivery [25].
Lung-on-a-Chip Systems: These microfluidic devices incorporate human lung epithelial cells and microvascular endothelial cells in parallel channels separated by a porous membrane. The platform allows application of mechanical forces mimicking breathing motions and perfusion of immune cells through the vascular channel. This sophisticated system has demonstrated high fidelity in modeling human disease responses and strong predictive value for drug efficacy [25] [26]. Lung-on-a-chip technology has revealed complex interactions between SARS-CoV-2 infection and endothelial dysfunction, providing insights into the vascular complications of COVID-19 [25].
3D-Bioprinted Airway Models: Emerging bioprinting technologies now enable creation of multilayered airway constructs with endothelial cells, extracellular matrix, and lung epithelial cells in precise anatomical arrangements. These models support long-term culture and allow study of viral infection at the air-exposed epithelium alongside drug delivery through the vascular compartment. 3D-bioprinted models maintain tissue integrity for extended periods, facilitating time-course studies of viral pathogenesis and therapeutic interventions [26].
Table 2: Comparison of Experimental Respiratory Model Systems
| Model System | Key Advantages | Limitations | Applications in Viral Kinetics |
|---|---|---|---|
| ALI Cultures | High differentiation state; mucociliary functions; appropriate cell composition | Lack vascular and immune components; donor-dependent variability | Early infection dynamics; cellular tropism; age-specific responses [23] [24] |
| Lung Organoids | 3D architecture; stem cell functionality; disease modeling | Limited standardization; closed architecture prevents apical infection | Viral pathogenesis; antiviral screening; host-pathogen interactions [25] |
| Lung-on-a-Chip | Vascular perfusion; mechanical forces; immune cell recruitment | Complex manufacturing; low throughput; cost | Complex host responses; drug delivery; immune cell recruitment [25] [26] |
| 3D-Bioprinted Models | Precise architectural control; natural ECM; long-term culture | Specialized equipment required; optimization challenges | Antiviral efficacy testing; barrier function studies; chronic infection [26] |
Standardized Infection Methodologies
Experimental consistency across studies requires careful standardization of infection protocols, which significantly influence observed viral kinetics and host responses.
Viral Inoculation Parameters: Most ALI studies employ inoculation doses ranging from 0.01 to 0.05 MOI (multiplicity of infection) with incubation periods of approximately 1 hour at 37°C. Following inoculation, the viral solution is removed and replaced with culture medium, with samples typically collected at 24-hour intervals for up to 72-96 hours post-infection. These parameters ensure reproducible infection while maintaining tissue viability [23] [24].
Viral Load Quantification: Standard assessment includes infectious titer measurement via plaque assays and viral genome quantification through RT-qPCR targeting genes such as the E gene. Advanced studies incorporate single-cell RNA sequencing to map viral transcripts to specific cell types, and immunofluorescence staining for viral proteins (dsRNA, spike protein) to visualize spatial distribution of infection [22] [24].
Pathway Inhibition Studies: Specific entry pathways are delineated using pharmacological inhibitors including Camostat mesylate (TMPRSS2 inhibitor) and Amphotericin B (inhibitor of endosomal restriction factors). Pre-treatment with these compounds for 2 hours prior to infection, with maintained presence throughout experiments, enables dissection of variant-specific entry mechanisms [22].
Research Reagent Solutions
Table 3: Essential Research Reagents for Respiratory Viral Kinetics Studies
| Reagent/Cell Type | Specification | Research Application |
|---|---|---|
| Primary Human Bronchial Epithelial Cells (HBECs) | Commercially available (e.g., Lonza); donor-matched options | Differentiation in ALI culture to form pseudostratified epithelium for infection studies [23] |
| Calu-3 Cells | Human lung adenocarcinoma cell line | Model for lung epithelial infection; expresses ACE2 and TMPRSS2 [22] [27] |
| Vero-E6/TMPRSS2 Cells | Engineered Vero-E6 cells overexpressing TMPRSS2 | Viral stock production and titration; enhances isolation of certain variants [16] |
| Camostat Mesylate | Serine protease inhibitor (50µM working concentration) | Inhibition of TMPRSS2-dependent viral entry; mechanistic studies [22] |
| Amphotericin B | Antifungal agent (1µM working concentration) | Inhibition of endosomal restriction factors; enhances TMPRSS2-independent entry [22] |
| Anti-dsRNA Antibody | monoclonal antibody (e.g., J2 clone) | Immunofluorescence detection of viral replication complexes [24] |
Signaling Pathways and Experimental Workflows
SARS-CoV-2 Viral Entry Pathways
The following diagram illustrates the divergent entry mechanisms employed by Delta and Omicron variants, which underlie their distinct tissue tropism and replication dynamics:
Standardized Workflow for Viral Kinetics Studies
The following diagram outlines a representative experimental workflow for assessing viral kinetics in advanced 3D respiratory models:
The comparative analysis of SARS-CoV-2 variant infection kinetics reveals that fundamental differences in viral entry mechanisms translate to distinct replication patterns across respiratory compartments. Delta's TMPRSS2-dependent entry and enhanced lung replication capacity explain its association with more severe pulmonary disease, while Omicron's endosomal entry preference and superior nasal epithelial replication underpin its heightened transmissibility but reduced severity. Advanced 3D respiratory models provide indispensable platforms for elucidating these dynamics, with each system offering unique advantages for specific research applications. The continued refinement of these models, particularly through incorporation of immune components and age-diverse epithelia, will further enhance their predictive value for both variant characterization and therapeutic development. As SARS-CoV-2 continues to evolve, these experimental approaches will remain essential tools for rapidly assessing the pathogenic potential of emerging variants and guiding public health responses.
The formation of syncytia, or multinucleated giant cells, represents a significant pathological feature of SARS-CoV-2 infection, with considerable variation among viral variants. This phenomenon occurs when the viral spike (S) protein on infected cells interacts with receptors on neighboring cells, triggering membrane fusion and the creation of large, combined cellular structures. Emerging research indicates that syncytia formation contributes substantially to viral pathogenicity by facilitating viral spread, enabling immune evasion, and causing direct cellular damage [28] [29]. Among SARS-CoV-2 variants, the Delta variant demonstrates markedly enhanced syncytia-forming capability compared to Omicron subvariants, providing a potential explanatory factor for their differing clinical impacts. This comparative analysis examines the experimental evidence establishing syncytia formation as a key pathogenicity marker, with particular focus on Delta's superior fusion capacity across various model systems.
Quantitative Comparison of Syncytia Formation Across Variants
Variant-Specific Syncytia Formation Efficiency
Table 1: Comparative syncytia formation capabilities of SARS-CoV-2 variants
| Variant | Syncytia Formation Efficiency | Key Supporting Evidence | Experimental Models |
|---|---|---|---|
| Delta | High | Enhanced fusogenicity; faster fusion kinetics; larger and more numerous syncytia [30] [31] | VeroE6/TMPRSS2 cells [31]; Primary airway cells [30]; First-trimester trophoblast cells [16] |
| Omicron (BA.1) | Reduced | Decreased cell-cell fusion despite efficient replication [16] [32] | hACE2 transgenic mice [32]; Primary trophoblast cells [16] |
| Omicron (BA.2, BA.5) | Intermediate | Moderate fusogenicity compared to Delta and BA.1 [16] | Primary trophoblast cells [16]; Cat lung explant cultures [33] |
| Ancestral (D614G) | Baseline | Standard fusion capability; surpassed by all Variants of Concern [30] | Multiple cell lines (Caco-2, Calu-3, Vero) [30] |
Table 2: Quantitative differences in syncytia formation and associated pathogenicity
| Variant | Relative Syncytia Size | Relative Syncytia Number | Associated Pathogenicity | Nuclear Localization |
|---|---|---|---|---|
| Delta | Large [30] | Numerous [30] | High; severe lung inflammation [32] | Yes (N-protein and virions) [31] |
| Omicron BA.1 | Small [16] | Reduced [16] | Low; minimal weight loss in models [32] | Not observed [31] |
| Omicron BA.5 | Intermediate [16] | Intermediate [16] | Low to moderate [32] | Not observed [31] |
| Ancestral D614G | Baseline | Baseline | Baseline for comparison | Not specified |
Biological Consequences of Enhanced Syncytia Formation
The enhanced syncytia formation capability of the Delta variant correlates with several critical pathological outcomes:
- Prolonged viral persistence: Syncytia may serve as "viral escape rooms" that protect viral components from immune detection and clearance, potentially contributing to long COVID pathogenesis [28].
- Tissue damage and inflammation: Delta infection causes significant nuclear membrane damage and cellular destruction, features not observed with Omicron variants [31].
- Placental dysfunction: In trophoblast models, Delta infection alters syncytiotrophoblast dynamics and increases syncytial knot formation, potentially explaining adverse pregnancy outcomes associated with COVID-19 [16].
- Endothelial barrier compromise: Spike protein expression in endothelial cells induces syncytia formation with disrupted cell-cell adhesions, potentially contributing to vascular dysfunction in severe COVID-19 [34].
Experimental Models and Methodologies for Syncytia Quantification
Primary Trophoblast Cell Fusion Assay
Cell Isolation and Culture: First-trimester cytotrophoblast cells (CTBs) were isolated from human placentas (9-11 weeks gestation) following enzymatic digestion with Trypsin and separation via Percoll gradient centrifugation. CD45-negative cells were immunopurified to obtain CTBs, which were resuspended in DMEM supplemented with 10% FBS and gentamycin [16].
Infection and Differentiation: Cells were seeded in 96-well (1×10⁵ cells/well) or 24-well (1.5×10⁶ cells/well) plates. For syncytiotrophoblast (STB) infection assays, cells were incubated for 72 hours to allow spontaneous cell fusion before virus infection. Cells were infected with SARS-CoV-2 variants (Delta, Omicron BA.1, BA.2, BA.5) at specified multiplicities of infection [16].
Fusion Quantification: Trophoblast fusion was evaluated by immunostaining and calculating the fusion index, representing the percentage of nuclei within syncytia relative to total nuclei. Parallel analysis of placental tissues from SARS-CoV-2-infected pregnancies quantified syncytial knot formation via immunohistochemistry [16].
Figure 1: Experimental workflow for primary trophoblast fusion assays
Ex Vivo Lung Explant Culture Model
Tissue Preparation: Lung tissues were obtained from domestic cats deceased from non-lung-related causes. Tissues were washed with RPMI media supplemented with 2X antibiotics (Gentamicin and antimycotic) and chopped into 1 mm³ fragments using sterile curved surgical scissors on ice [33].
Infection Protocol: Explant suspensions were inoculated with SARS-CoV-2 Delta and Omicron variants at an MOI of 1 using viral stocks propagated in Vero E6 cells. Cultures were incubated at 37°C with 5% CO₂, with infected explants collected at 0, 12, and 24 hours post-infection for transcriptomic analysis [33].
Transcriptomic Profiling: Comprehensive RNA sequencing was performed to identify differentially expressed genes associated with tissue damage, extracellular matrix organization, and immune responses. Hub gene networks were constructed to identify central regulators of syncytia-associated pathogenicity [33].
Endothelial Cell Syncytia Formation Assay
Adenoviral Spike Expression: Human umbilical vein endothelial cells (HUVEC) were infected with adenovirus expressing SARS-CoV-2 D614G Spike protein variant. Control cells expressed eGFP alone [34].
Syncytia Quantification: Cells expressing 3 or more nuclei were identified as syncytia. The frequency of syncytia (percentage of syncytia per total number of cells) and size (nuclei per syncytia) were quantified at 48-72 hours post-infection [34].
Mechanical Regulation Assessment: The role of biomechanical factors was tested using:
- Pharmacological inhibitors: ML-7 (myosin light chain kinase inhibitor) and Y-27632 (ROCK inhibitor)
- Substrate stiffness variation: 2 kPa vs. 64 kPa PDMS substrates
- Fluid shear stress application: 2, 6, and 12 dynes/cm² [34]
Molecular Mechanisms Underlying Delta's Enhanced Fusogenicity
Spike Protein Mutations and Fusion Regulation
The enhanced fusogenicity of the Delta variant stems from specific mutations in the spike protein that optimize receptor binding and membrane fusion:
- Enhanced ACE2 affinity: Delta spike protein displays higher binding affinity to ACE2 receptors compared to ancestral D614G, facilitating more efficient initiation of the fusion process [30].
- Optimized proteolytic processing: Delta's spike protein exhibits improved cleavage at the S1/S2 boundary and S2' site, enhancing fusogenic activation [30] [29].
- Nuclear localization: Unique among variants, Delta infection results in detection of N-protein and virions in the nucleus, associated with a G215C mutation in the nucleocapsid protein that may contribute to enhanced cellular damage [31].
Host Factor Interactions and Signaling Pathways
Table 3: Key host factors regulating SARS-CoV-2 syncytia formation
| Host Factor | Function in Syncytia Formation | Impact on Variants |
|---|---|---|
| ACE2 | Primary receptor for spike protein binding | Higher affinity for Delta spike enhances fusion initiation [30] |
| TMPRSS2 | Plasma membrane protease that primes spike protein | Augments cell-cell fusion, particularly for TMPRSS2-utilizing variants [30] [28] |
| IFITM proteins | Restrict fusion by increasing membrane rigidity | Similarly inhibitory across variants, but overcome by enhanced fusogenicity [30] [29] |
| Myosin Light Chain Kinase (MLCK) | Regulates actomyosin contractility during fusion | Critical for endothelial syncytia formation; inhibited by ML-7 [34] |
| TP53 | Modulates chromatin accessibility and cellular senescence | Differential activation by variants modifies senescence responses [35] |
Figure 2: Molecular mechanisms of enhanced syncytia formation by Delta variant
The Scientist's Toolkit: Essential Research Reagents
Table 4: Key research reagents for studying SARS-CoV-2 syncytia formation
| Reagent/Cell Line | Application | Key Features |
|---|---|---|
| VeroE6/TMPRSS2 cells | Viral propagation and initial fusion assays | Overexpress TMPRSS2 protease, enhancing spike protein processing and cell-cell fusion [30] [31] |
| Primary first-trimester trophoblasts | Physiological placental fusion models | Spontaneously fuse with 90% efficiency within 72h; relevant for maternal-fetal transmission studies [16] |
| Human Umbilical Vein Endothelial Cells (HUVEC) | Vascular syncytia formation studies | Express ACE2 and TMPRSS2; model cardiovascular complications of COVID-19 [34] |
| Ex vivo lung explant cultures | Physiologically relevant respiratory models | Maintain tissue architecture and cellular heterogeneity; bridge in vitro and in vivo findings [33] |
| ML-7 (MLCK inhibitor) | Mechanistic studies of fusion regulation | Specifically inhibits myosin light chain kinase, reducing syncytia formation in endothelial cells [34] |
| Anti-S protein mAbs | Fusion inhibition and neutralization assays | Monitor viral infection and cell-surface spike expression; quantify infected cells [30] |
The comparative analysis of syncytia formation across SARS-CoV-2 variants reveals a consistent pattern: the Delta variant possesses superior cell-cell fusion capability compared to Omicron subvariants, correlating with its enhanced pathogenicity observed in clinical settings. This enhanced fusogenicity stems from specific spike protein mutations that optimize ACE2 receptor binding and membrane fusion efficiency. The methodological approaches outlined—including primary trophoblast models, ex vivo lung explants, and endothelial cell systems—provide robust platforms for quantifying variant-specific syncytia formation and associated pathological consequences. These experimental models demonstrate that Delta's enhanced fusion activity translates to increased tissue damage, inflammatory responses, and potential for persistent infection through syncytia-mediated viral sanctuary sites. As SARS-CoV-2 continues to evolve, monitoring the syncytia-forming potential of emerging variants will remain crucial for assessing their pathogenic potential and guiding appropriate public health responses.
Advanced 3D Respiratory Models as Powerful Tools for Viral Pathogenesis Research
Human Airway Epithelial (HAE) cultures, specifically those differentiated at the air-liquid interface (ALI), have emerged as a physiologically relevant in vitro system for investigating respiratory virus pathogenesis. These cultures recapitulate the pseudostratified epithelium of the human respiratory tract, comprising ciliated cells, goblet cells, club cells, and basal cells [36] [37]. This complex cellular architecture, along with the presence of mucus and functional cilia, makes HAE cultures a superior model for studying viral tropism, replication kinetics, and host-cell interactions compared to conventional, undifferentiated cell lines [38]. During the COVID-19 pandemic, HAE cultures proved indispensable for delineating the functional differences between SARS-CoV-2 variants, particularly the highly pathogenic Delta (B.1.617.2) and the highly transmissible Omicron (B.1.1.529). This guide provides a comparative analysis of these variants using HAE models, summarizing key experimental data and methodologies to inform preclinical research and therapeutic development.
Experimental Replication and Cytopathic Effect (CPE) Profiles
A critical differentiator between SARS-CoV-2 variants is their efficiency of replication and the subsequent damage they inflict on the respiratory epithelium.
Replication Kinetics
Infection of primary nasal HAE cultures reveals distinct replication dynamics. One study found that all variants of concern (VOCs) replicated to higher titers than the ancestral strain, suggesting a selection for replication efficiency. In these upper respiratory models, Omicron reached the highest titers at early time points (24-72 hours post-infection), followed by Delta [38]. This aligns with Omicron's high transmissibility. In contrast, infections in the Calu-3 lung epithelial cell line showed that Alpha and Beta VOCs reached higher titers than Omicron, indicating that Omicron is particularly optimized for replication in the upper airway [38]. A mathematical modeling study further supported that Omicron has a significantly lower cell entry rate than Delta, which may contribute to its attenuated replication in some lower respiratory models [20].
Cytopathic Effects (CPE) and Epithelial Damage
Despite its high replicative ability in the nose, Omicron causes less severe damage to the airway epithelium. Infections with the Delta variant result in the most pronounced cytopathic effects in both primary nasal cultures and lung cell lines [38]. These effects include:
- Syncytia formation: Large, multinucleated cells formed by virus-induced cell fusion, arranged in a net-like structure [37].
- Loss of barrier integrity: A significant reduction in transepithelial electrical resistance (TEER), a key indicator of epithelial barrier function [38] [37].
- Ciliary dysfunction: Marked by cilium shrinking, beaded changes, and disordered cilia, which compromises mucociliary clearance [37].
- Apoptosis: SARS-CoV-2 infection in HAE cultures primarily induces apoptotic cell death rather than necrosis [37].
Table 1: Comparative Replication and Cytopathic Effects of SARS-CoV-2 Variants in Airway Models
| Parameter | Delta Variant | Omicron Variant | Experimental Model | Citation |
|---|---|---|---|---|
| Peak Titer (Upper Airway) | High | Highest (early time points) | Primary Nasal HAE Cultures | [38] |
| Peak Titer (Lower Airway) | High | Lower than Alpha/Beta | Calu-3 Lung Cell Line | [38] |
| Cell Entry Rate | High | Significantly Lower | Caco-2 & Calu-3 Mathematical Modeling | [20] |
| Syncytia Formation | Pronounced | Less Pronounced | Primary HAE Cultures | [38] [37] |
| Barrier Integrity Loss | Severe | Milder | Primary HAE Cultures / TEER | [38] [37] |
| Ciliary Damage | Severe (loss of beating) | Milder | Primary Nasal HAE Cultures | [38] |
| Primary Cell Death Mode | Apoptosis | Apoptosis | Primary HAE Cultures / TUNEL Assay | [37] |
Host Response and Immune Activation
The host transcriptional and immune response to infection varies significantly between variants, influencing pathogenicity.
Innate Immune and Inflammatory Signaling
A key finding is that Omicron infection induces a stronger interferon (IFN) and interferon-stimulated gene (ISG) response compared to Delta in HAE cultures [38]. This robust innate immune activation may contribute to its attenuated phenotype. In contrast, the wild-type and Delta variants trigger a more potent upregulation of pro-inflammatory cytokines and chemokines. A study in K18-hACE2 mice showed the wild-type variant induced the highest expression of cytokines like IL-1α, IL-1β, IL-17α, and IFN, as well as chemokines such as CCL4, CCL11, CXCL9, and CXCL10, particularly in the brain [21]. The Delta variant induced a similar but less intense profile, whereas the Omicron variant elicited a markedly weaker inflammatory response [21].
Immediate Early Gene Response
Unique to SARS-CoV-2 is its suppression of the host's immediate early gene (IEG) response. Transcriptomic analysis of infected HAE cultures revealed that SARS-CoV, MERS-CoV, and HCoV-229E infection all increase the expression of IEGs like FOS, FOSB, and NR4A1 [36]. SARS-CoV-2 uniquely lacks this induction, a signature confirmed in both experimental and clinical datasets [36]. Furthermore, interfering with NR4A1 signaling reduced replication of both SARS-CoV-2 and MERS-CoV, suggesting IEGs play a role in coronavirus replication [36].
Apoptotic Signaling
Apoptotic pathways are also differentially activated. In mouse models, most apoptotic factors (e.g., caspase 8, caspase 9, p53, Bax) were mainly upregulated in the brain tissues of Omicron-infected mice, with minimal upregulation (less than 3-fold) in the lungs or kidneys [21]. This suggests variant- and tissue-specific regulation of cell death pathways.
The diagram below summarizes the core host signaling pathways differentially activated by SARS-CoV-2 infection in airway epithelial cells and their logical relationships.
Diagram Title: Host Signaling Pathways in SARS-CoV-2 Infected Airway Epithelium
Viral Entry and Morphogenesis
The mechanism of viral entry and the subsequent assembly and release of virions are fundamental to understanding variant-specific pathogenesis.
Viral Entry Pathways
All SARS-CoV-2 VOCs, including Omicron, primarily enter the cell via a TMPRSS2-dependent pathway [38]. This cell-surface protease cleaves the viral spike protein, facilitating direct membrane fusion. However, Omicron is more likely than other variants to use an additional endosomal route of entry [38]. This alternative pathway, which is TMPRSS2-independent and may rely on cathepsins, could partly explain Omicron's reduced efficiency in infecting TMPRSS2-high lung cells compared to Delta [38] [20].
Morphogenesis and Cell Tropism
The morphogenesis of SARS-CoV-2 in HAE cultures shares features with other coronaviruses, including the formation of double-membrane vesicles (DMVs) in the cytoplasm, which serve as sites for viral RNA synthesis [37]. Virus particles are assembled and transported in vesicles to the cell surface for release via exocytosis. A key finding is that SARS-CoV-2 infects both ciliated and secretory cells (including goblet and club cells) [37]. This broad tropism, distinct from many other human coronaviruses that preferentially infect either ciliated or secretory cells, may contribute to SARS-CoV-2's high transmissibility and pathogenicity.
Table 2: Comparative Viral Entry and Cellular Tropism of SARS-CoV-2 Variants
| Parameter | Delta Variant | Omicron Variant | Experimental Model | Citation |
|---|---|---|---|---|
| Primary Entry Route | TMPRSS2-dependent | TMPRSS2-dependent | Primary Nasal & Lung Models | [38] |
| Alternative Entry | Less Common | More Common (Endosomal) | Primary Nasal & Lung Models | [38] |
| TMPRSS2 Usage | High | Reduced | Caco-2 & Calu-3 Modeling | [20] |
| Infected Cell Types | Ciliated & Secretory | Ciliated & Secretory | Primary HAE Cultures / IF & TEM | [37] |
| Intracellular Features | Double-Membrane Vesicles (DMVs) | Double-Membrane Vesicles (DMVs) | Primary HAE Cultures / TEM | [37] |
The Scientist's Toolkit: Essential Research Reagents and Materials
To faithfully recapitulate the experiments cited in this guide, researchers require specific biological tools and reagents. The following table details key solutions for establishing and infecting HAE cultures.
Table 3: Key Research Reagent Solutions for HAE Culture Studies
| Reagent / Material | Function / Application | Example from Search Results |
|---|---|---|
| Primary Human Bronchial Epithelial Cells (PBEC) | Foundation for creating physiologically relevant, well-differentiated HAE cultures at ALI. | Cells from 4 donors used for coronavirus transcriptome analysis [36]. |
| Air-Liquid Interface (ALI) Culture System | Platform for differentiating PBECs into a pseudostratified, mucociliary epithelium that mimics the human airway. | 6-week-differentiated ALI-PBEC cultures [36]. |
| Primary Nasal Epithelial Cultures | Model specifically for upper respiratory infection, derived from patient nasal cavities. | Patient-derived primary nasal cultures grown at ALI [38]. |
| Calu-3 Cell Line | Immortalized human lung epithelial cell line used as a model for lower respiratory infection. | Used to compare variant replication in lung epithelium [38] [20]. |
| Vero E6 Cells | African green monkey kidney cell line commonly used for SARS-CoV-2 propagation and plaque assays. | Used for virus stock propagation and TCID₅₀ assays [38] [33]. |
| RT-qPCR Assays | Quantification of intracellular viral RNA copies and host gene expression. | Used to measure viral RNA and immune gene expression (e.g., TLRs, cytokines) [21] [36]. |
| SARS-CoV-2 Specific Antibodies | Detection of viral proteins (e.g., Nucleocapsid) for immunofluorescence and culture confirmation. | Antibody against SARS-CoV-2 N protein for IF microscopy [37] [39]. |
Detailed Experimental Protocols
To ensure reproducibility, below are outlines of the core methodologies derived from the cited studies.
Protocol 1: HAE Culture Infection and Viral Titration
This protocol is adapted from studies using primary HAE cultures to model SARS-CoV-2 infection [36] [38] [37].
- Culture Establishment: Plate primary human bronchial or nasal epithelial cells on transwell filters and allow them to differentiate at an air-liquid interface for 4-6 weeks to form a mature, mucociliary epithelium.
- Viral Inoculation: Apply a defined inoculum (e.g., ~30,000 PFU or MOI of 0.1) of the SARS-CoV-2 variant of interest in a small volume to the apical surface of the HAE cultures. Incubate for 1-2 hours to allow for viral adsorption.
- Sample Collection: Following incubation, wash the apical surface to remove unbound virus. At designated time points post-infection (e.g., 6, 12, 24, 48, 72 hours), collect apical wash samples by adding and retrieving a buffer solution.
- Virus Quantification:
- Infectious Titer: Determine the titer of infectious virus in apical washes using a plaque assay or the median tissue culture infectious dose (TCID₅₀) assay on permissive cells like Vero E6. Titers are expressed as Log₁₀ PFU/mL or Log₁₀ TCID₅₀/0.1 g [21] [38].
- Viral RNA: Extract RNA from apical washes or infected cells and quantify viral RNA copies via RT-qPCR targeting genes like the SARS-CoV-2 N1 gene [36] [39].
Protocol 2: Host Transcriptomic Analysis via Bulk RNA-seq
This protocol details the process for analyzing the host transcriptional response to infection, as performed in [36] and [33].
- Infection and RNA Extraction: Infect HAE cultures as described in Protocol 1. At specific time points post-infection, lyse cells directly on the transwell insert and extract total RNA.
- Library Preparation and Sequencing: Prepare sequencing libraries from the extracted RNA. Perform bulk RNA-sequencing on an appropriate platform (e.g., Illumina) to generate transcriptome-wide data.
- Bioinformatic Analysis:
- Differential Expression: Map sequences to the human reference genome and compare gene expression profiles between infected and mock-infected control cultures. Identify differentially expressed genes (DEGs) based on a false discovery rate (FDR) and fold-change threshold (e.g., FDR < 0.05, FC > 1.5) [36].
- Pathway Analysis: Subject the list of DEGs to functional enrichment analysis using databases like Gene Ontology (GO) and Kyoto Encyclopedia of Genes and Genomes (KEGG) to identify activated or suppressed signaling pathways (e.g., interferon signaling, cytokine-cytokine receptor interaction) [33].
Human Airway Epithelial cultures stand as an indispensable tool for respiratory virus research, offering a physiological benchmark that simple cell lines cannot match. The experimental data generated in HAE models have been crucial for objectively comparing SARS-CoV-2 variants, revealing that the Delta variant's high pathogenicity is linked to efficient TMPRSS2-mediated entry, robust replication, and induction of severe cytopathic effects and inflammation. In contrast, the Omicron variant's phenotype is characterized by altered entry pathways, optimized upper respiratory replication, and a attenuated lower respiratory pathology, despite eliciting a stronger innate interferon response. These insights, derived from a model that faithfully recapitulates human respiratory architecture, are vital for guiding the development of future antiviral strategies and preparing for the emergence of new pathogenic respiratory viruses.
This guide objectively compares infection protocol parameters—specifically Multiplicity of Infection (MOI) optimization and sample collection timepoints—for SARS-CoV-2 Delta and Omicron variants in 3D respiratory models. The data presented supports the broader research thesis comparing the pathogenicity of these variants by detailing the experimental methodologies and reagents essential for generating comparable, reproducible results.
The emergence of SARS-CoV-2 variants of concern (VOCs) necessitates standardized in vitro infection protocols to accurately compare viral pathogenicity and drug efficacy. Research using ex vivo human bronchus and lung cultures and human 3D airway epithelial models has revealed significant differences in how Delta and Omicron variants infect and damage respiratory tissue [40] [6]. This guide provides a direct comparison of core experimental parameters, namely MOI and sample collection timepoints, to ensure consistent and validated approaches across studies.
Quantitative Data Comparison of Variant Replication
The table below summarizes key quantitative findings from foundational studies, highlighting differences in viral replication kinetics and cytopathic effects between Delta and Omicron variants. These results directly inform protocol optimization.
Table 1: Comparative Replication and Pathogenicity of SARS-CoV-2 Variants in Respiratory Models
| Variant | Experimental Model | Key Replication Finding | Key Pathogenicity Finding | Source |
|---|---|---|---|---|
| Omicron | Human bronchus ex vivo | Faster replication in bronchi at 24h/48h vs. WT & Delta (>70-fold) [6] | Reduced tissue penetration and cell damage in human airway epithelia [40] | Nature (2022) |
| Omicron | Human lung ex vivo | Significantly reduced replication vs. WT strain at 24h, 48h, and 72h [6] | Markedly smaller areas of complement activation and lower IL-6 secretion [40] | Nature (2022) |
| Delta | Human bronchus ex vivo | Significantly higher replication than WT at 72h; lower than Omicron at 24h/48h [6] | Major tissue destruction, high LDH activity, and pronounced innate immune activation [40] | Nature (2022) |
| Delta | Human lung ex vivo | No significant difference in replication vs. WT strain [6] | Readily penetrated deep into respiratory epithelium, causing major damage [40] | Nature (2022) |
| Wild-type | K18-hACE2 Mice (Lungs) | N/A | Highest expression of cytokines (IL-1α, IL-1β, IL-17α, IFN, TNF) and chemokines (CCL4, CCL11, CXCL9, CXCL10) [21] | Front Biosci (2022) |
Detailed Experimental Protocols
Protocol for Ex Vivo Human Respiratory Tissue Infection
This methodology, adapted from the Nature (2022) study, is used to compare viral replication kinetics and cellular tropism of different VOCs [6].
- Tissue Preparation: Obtain human bronchus and lung parenchyma tissues from surgical resections. Wash tissues extensively in Dulbecco's Modified Eagle Medium (DMEM) containing antibiotics.
- Infection Process:
- Prepare virus inoculums of target VOCs (e.g., Wild-type, Delta, Omicron) in serum-free medium.
- MOI Recommendation: The study quantified input virus but often normalized by tissue weight; a common approach is to use a standardized TCID₅₀ per tissue sample (e.g., 10⁵ TCID₅₀). For cell-based assays, an MOI of 0.1-1.0 is typical for infection kinetics.
- Infect tissue explants by inoculating the apical surface for a defined period (e.g., 1 hour) at 37°C.
- Sample Collection & Viral Titration:
- Critical Timepoints: Collect tissue culture supernatants and/or tissue homogenates at 24, 48, and 72 hours post-infection (hpi).
- Titrate infectious virus using the 50% Tissue Culture Infectious Dose (TCID₅₀) assay on permissive cells like VeroE6 or Vero/TMPRSS2.
- Support with viral RNA quantification by quantitative RT-PCR (qRT-PCR).
Protocol for 3D Human Airway Epithelia Model Infection
This protocol, based on Frontiers in Immunology (2023), assesses tissue penetration, damage, and inflammatory responses [40].
- Model Preparation: Use commercially available, well-differentiated human 3D airway epithelial cultures. Maintain at an air-liquid interface (ALI) according to supplier instructions.
- Infection Process:
- Apply the virus inoculum to the apical surface.
- MOI Optimization: The study suggests that even with high inoculums, Omicron shows reduced penetration. A range of MOIs (e.g., 0.5 - 5) should be tested to ensure the model is not overwhelmed, reflecting physiological relevance.
- Sample Collection & Analysis:
- Key Timepoints: Analyze outcomes at 24-72 hpi.
- Transepithelial Electrical Resistance (TEER): Measure at multiple timepoints to monitor real-time epithelial integrity.
- Lactate Dehydrogenase (LDH) Assay: Collect basolateral medium at 48-72 hpi to quantify cell damage.
- Cytokine/Chemokine Analysis: Use basolateral medium collected at 48-72 hpi for assays like ELISA to measure IL-6 and other inflammatory markers.
- Immunofluorescence/Confocal Imaging: Fix tissues at 72 hpi to visualize viral antigen distribution, tissue architecture, and areas of immune activation (e.g., complement C3).
Viral Entry Pathway and Experimental Workflow
The differential replication of SARS-CoV-2 variants is influenced by their preferred entry pathway into host cells. The diagram below illustrates these distinct mechanisms.
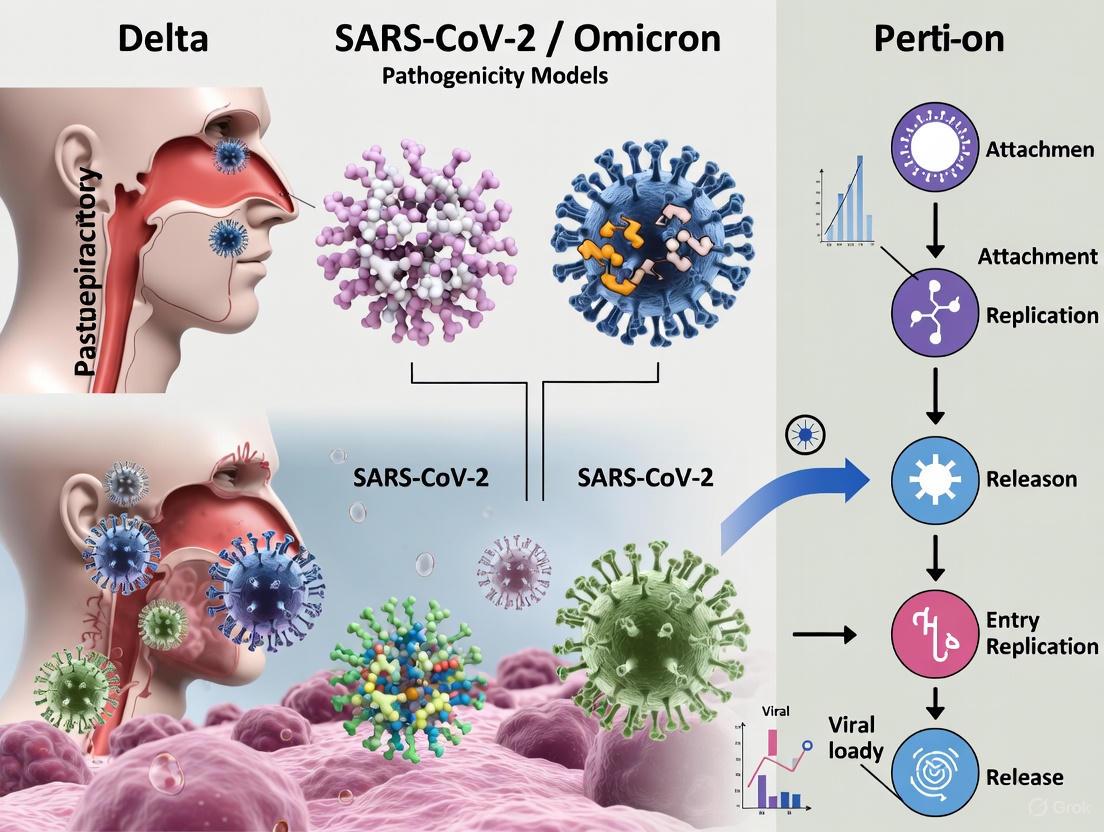
Diagram 1: SARS-CoV-2 Viral Entry Pathways. Research indicates the Omicron variant shows a greater preference for the endosomal uptake pathway and increased dependence on cathepsins for entry, unlike the Delta variant, which more readily uses TMPRSS2-mediated fusion at the cell surface [6].
The following diagram outlines the core workflow for standardizing and executing infection protocols in 3D respiratory models.
Diagram 2: Experimental Workflow for 3D Model Infection. This standardized process ensures consistent evaluation of viral replication kinetics and host responses across different SARS-CoV-2 variants.
The Scientist's Toolkit: Research Reagent Solutions
The table below lists essential materials and their functions for conducting these infection studies, as cited in the referenced research.
Table 2: Essential Research Reagents and Materials
| Reagent/Material | Function in Protocol | Examples from Literature |
|---|---|---|
| VeroE6 / Vero-TMPRSS2 Cells | Permissive cell line for viral propagation and titration via TCID₅₀ assay [41] [6]. | Used for virus isolation and stock generation [42]. |
| 3D Human Airway Epithelial Models | Physiologically relevant ex vivo system for infection, assessing penetration, damage, and immunity [40]. | Model for Omicron vs. Delta tissue penetration [40]. |
| TEER Measurement System | Quantifies epithelial integrity in real-time; drop indicates barrier damage [40]. | Used to monitor epithelial health post-infection [40]. |
| LDH Cytotoxicity Assay Kit | Measures lactate dehydrogenase release from damaged cells, quantifying cytopathic effect [40]. | Assessed cell damage in airway epithelia [40]. |
| Cytokine Detection Assays (ELISA) | Quantifies secreted immune markers (e.g., IL-6, IL-1β) from basolateral medium [21] [40]. | Measured IL-6, IL-1β, and other cytokines in infected models [21] [40]. |
| qRT-PCR Reagents & Primers | Quantifies viral RNA copy number (e.g., targeting ORF1b, N gene) in swabs, tissue, or medium [42] [6]. | Used for viral genome quantification in swabs and tissues [42] [6]. |
| TCID₅₀ Assay Components | (Overlay medium, cell culture plates) Determines infectious viral titer in collected samples [41] [6]. | Standard method for viral titration in research [21] [6]. |
This comparison guide provides an objective analysis of experimental data and methodologies used to assess the pathogenicity of SARS-CoV-2 Delta and Omicron variants in advanced 3D respiratory models. The Omicron lineage, including subvariants like XBB.1.5, XBB.1.16, EG.5.1, and JN.1, demonstrates distinct pathogenic characteristics compared to earlier variants, with reduced lower respiratory tract pathology despite maintained or enhanced upper respiratory tract replication [43]. We synthesize findings from in vivo hamster models, ex vivo human nasal and lung epithelium, and mathematical modeling to compare viral fitness, host immune responses, and cellular damage markers. The data presented herein support the broader thesis that intra-Omicron evolution has favored upper respiratory tract fitness while attenuating severe lung disease, guiding researchers in selecting appropriate parameters and models for antiviral therapeutic development.
The emergence of the SARS-CoV-2 Omicron lineage marked a significant shift in the virus's pathogenicity. Compared to the previously dominant Delta variant, Omicron and its sub-lineages are characterized by enhanced immune evasion but attenuated severity of lower respiratory disease [43]. This change in pathogenesis necessitates a multiparametric assessment framework to quantitatively compare viral behavior. Advanced 3D respiratory models, including primary human nasal epithelial cultures at air-liquid interface (ALI) and human lung organoids, provide physiologically relevant systems for this evaluation, effectively mirroring the human respiratory tract's cellular environment and innate immune responses [43]. These models allow researchers to deconvolute the complex interplay between viral replication efficiency, cytopathic effect, and host-derived inflammatory signals, providing crucial insights for public health risk assessment and therapeutic design.
Comparative Experimental Data: Delta vs. Omicron
Viral Replication Kinetics
Table 1: Viral Replication in Respiratory Models
| Model System | Variant | Replication in Upper Respiratory Tract | Replication in Lower Respiratory Tract | Key Measurement |
|---|---|---|---|---|
| Syrian Hamster (in vivo) | Delta | High | High and pathogenic | Infectious virus titer in lungs [43] |
| Omicron (XBB.1.5) | High | Limited/None | Infectious virus titer in lungs [43] | |
| Omicron (JN.1) | Moderate (shorter duration) | None detected | Infectious virus titer & shedding [43] | |
| Human Nasal Epithelium (ALI) | Delta | Moderate | N/A | Genome copies at 24 hpi [43] |
| Omicron (contemporary) | Significantly Higher vs. Delta | N/A | Genome copies at 24 hpi [43] | |
| Human Lung Organoids | Delta | N/A | Efficient replication | Viral RNA and infectious titer [43] |
| Omicron (contemporary) | N/A | Attenuated or no replication | Viral RNA and infectious titer [43] | |
| Calu-3 (Lung epithelium model) | Delta | N/A | High | Infectious titer (TCID50) [20] [13] |
| Omicron | N/A | Lower | Infectious titer (TCID50) [20] [13] |
Host Response and Cytokine Profiling
Table 2: Innate Immune and Cytokine Responses
| Parameter | Variant | Model System | Observation | Implication |
|---|---|---|---|---|
| Innate Immune Activation (Cytokine Production Rate) | Omicron | Caco-2 & Calu-3 cells | Stronger | Renders uninfected cells resistant [20] [13] |
| Delta | Caco-2 & Calu-3 cells | Weaker | Less resistance in bystander cells [20] [13] | |
| Cytokine/Chemokine Expression | Wild-type | Mouse lung & brain | Upregulation of CCL4, CCL11, CXCL9, CXCL10 | High pro-inflammatory response [21] |
| Delta | Mouse lung & brain | Moderate upregulation | Moderate pro-inflammatory response [21] | |
| Omicron | Mouse lung & brain | Lower upregulation | Attenuated pro-inflammatory response [21] | |
| T-cell Cytokine Polarization | MIS-C (post SARS-CoV-2) | Human PBMCs | Polarization towards IL-17 and IFNγ | Aberrant immunopathology [44] |
Cellular Damage and Integrity Markers
While Transepithelial Electrical Resistance (TEER) is a standard functional measure of epithelial barrier integrity in respiratory models, specific TEER data for Delta and Omicron comparisons in the provided literature is limited. Lactate Dehydrogenase (LDH), a robust biomarker for general cellular damage and cytotoxicity, is well-established in viral pathogenicity studies.
Table 3: Biomarkers of Cellular Damage and Disease Severity
| Biomarker | Biological Significance | Variant Association | Experimental Context |
|---|---|---|---|
| LDH (Lactate Dehydrogenase) | Correlates with overall cellular damage and disease severity; released upon cell lysis. | High levels correlate with severe disease. In other diseases (e.g., Atopic Dermatitis), LDHhigh patients show distinct immune profiles (e.g., higher IL-13, IL-5, IL-9) and more severe clinical presentations [45]. | A general biomarker for cytotoxicity; its measurement is recommended in pathogenicity studies to quantify virus-induced cell damage. |
| Histopathological Scores | Direct observation of tissue damage, immune infiltrate, and architectural disruption. | Delta and earlier variants cause significant pathology; Omicron variants show strongly reduced scores [43]. | Lung tissue analysis in hamster models [43]. |
| Lung/Body Weight Ratio | Indicator of pulmonary edema and immune infiltrate (indirect pathology measure). | Increased in Delta-infected animals; not increased in Omicron-infected animals [43]. | Measured during in vivo hamster studies [43]. |
Experimental Protocols for Key Methodologies
Viral Replication Kinetics in Primary Human Nasal Epithelium (ALI Cultures)
Purpose: To assess the replication fitness of SARS-CoV-2 variants in a physiologically relevant model of the human upper respiratory tract [43].
- Culture Setup: Differentiate primary human nasal epithelial cells on Transwell inserts at an air-liquid interface (ALI) for 4-6 weeks to form a polarized, pseudostratified, mucociliary epithelium.
- Virus Inoculation: Apically inoculate the cultures with equivalent infectious units (e.g., TCID50 or PFU) of Delta and Omicron variants. Include a negative control (e.g., culture medium only).
- Sample Collection: At predetermined time points (e.g., 2, 24, 48, 72, 96 hours post-inoculation), collect apical washes by pipetting medium onto the apical surface and immediately collecting it. Collect basolateral samples from the medium in the basal chamber.
- Viral Quantification:
- Viral RNA: Extract RNA from apical wash and basolateral samples. Quantify SARS-CoV-2 genomic RNA copies using RT-qPCR targeting conserved regions (e.g., N or E gene).
- Infectious Virus Titers: Determine the infectious virus titer in collected samples using a TCID50 assay on permissive cell lines (e.g., Vero E6 or Vero-TMPRSS2 cells).
- Cell-associated RNA: At endpoint, lyse cells directly on the insert to quantify intracellular viral RNA and subgenomic RNA (sgRNA), which is indicative of active viral replication.
Cytokine Profiling via Intracellular Staining and Flow Cytometry
Purpose: To characterize the functional T-cell cytokine response following SARS-CoV-2 infection or antigen exposure [44].
- Cell Isolation and Stimulation: Isolate Peripheral Blood Mononuclear Cells (PBMCs) from whole blood via Ficoll gradient centrifugation.
- Stimulation: Resuspend PBMCs in complete culture media and stimulate with a SARS-CoV-2 Spike protein antigenic mix in the presence of a protein transport inhibitor (e.g., Brefeldin A) for several hours (e.g., 6-12 hours). Include an unstimulated control and a positive control (e.g., PMA/ionomycin).
- Surface Staining: Stain cells with fluorochrome-conjugated antibodies against surface markers (e.g., CD3, CD4, CD8, CLA).
- Intracellular Staining: Fix and permeabilize cells using a commercial fixation/permeabilization kit. Subsequently, stain with fluorochrome-conjugated antibodies against cytokines (e.g., IL-2, IL-4, IL-17, IFN-γ, TNF-α, Granzyme B).
- Data Acquisition and Analysis: Acquire data on a 13-color (or higher) flow cytometer. Analyze the data to identify T-cell subsets (e.g., CD4+, CD8+) and their intracellular cytokine profiles. Report frequencies as positive cells per million CD3+ lymphocytes [44].
Mathematical Modeling of Viral Dynamics
Purpose: To quantify variant-specific virological parameters (e.g., cell entry rate, innate immune response strength) from in vitro infection data [20] [13].
- Experimental Data Input: Utilize experimental data from cell line infections (e.g., Caco-2, Calu-3). Essential data points include:
- Initial conditions (cell count, MOI).
- Time-course measurements of infectious virus titers (TCID50).
- Time-course measurements of intracellular viral RNA (e.g., sgRNA).
- Model Fitting: Employ a refined mathematical model, often based on a system of integro-differential equations. The model should account for:
- Target cell limitation.
- Viral entry into cells.
- Intracellular replication and viral production.
- An innate immune component (e.g., virus-induced cytokine production making uninfected cells resistant).
- Parameter Estimation: Fit the model to the experimental data for each variant separately. Key parameters to estimate are the cell entry rate and the cytokine production rate.
- Validation: The model's reliability is confirmed when it accurately explains the data for both variants using these specific parameters, and when altering only a single parameter is insufficient to achieve a good fit [20] [13].
Signaling Pathways and Workflow Visualizations
The Scientist's Toolkit: Key Research Reagents and Models
Table 4: Essential Research Reagents and Model Systems
| Reagent / Model System | Function in Pathogenicity Assessment | Specific Application in SARS-CoV-2 Research |
|---|---|---|
| Primary Human Nasal Epithelial Cells | Provides a differentiated, physiologically relevant model of the human upper airway for viral replication and host-response studies. | Demonstrates enhanced fitness of contemporary Omicron variants in the URT compared to Delta [43]. |
| Human Lung Organoids | 3D model that recapitulates key aspects of the human lower lung environment, including alveolar cell types. | Used to show attenuated replication of Omicron variants in the LRT [43]. |
| Caco-2 Cell Line | A human intestinal epithelial cell line expressing ACE2 and TMPRSS2, used as a model for enteric infection. | Mathematical modeling of infection data from this line revealed Omicron's lower cell entry rate and stronger innate immune induction [20] [13]. |
| Calu-3 Cell Line | A human lung epithelial cell line, a standard model for studying respiratory viral pathogenesis in vitro. | Comparative infection with Delta and Omicron variants reveals differences in replication kinetics and immune activation [20] [13]. |
| Syrian Golden Hamster Model | In vivo model for studying viral transmission, replication in URT/LRT, and pathogenicity (lung pathology). | Confirms the attenuated lung pathology of Omicron variants (e.g., JN.1) despite good URT replication [43]. |
| TCID50 Assay | The gold standard method for quantifying infectious virus titers in collected samples (e.g., swabs, tissue homogenates). | Critical for comparing replication kinetics of different variants in various models [43] [20]. |
| LDH Cytotoxicity Assay | Colorimetric assay to quantify lactate dehydrogenase release, a biomarker for cellular cytopathy and damage. | A standard parameter for assessing virus-induced cytotoxicity in vitro and ex vivo. |
| ELISpot / Flow Cytometry Kits | For detecting and quantifying antigen-specific T cells and their cytokine production profiles (e.g., IFN-γ, IL-17). | Used to identify Th17 polarization in MIS-C and other immune profiles post-infection [44]. |
The emergence of SARS-CoV-2 variants of concern (VoCs) with distinct pathogenic properties has necessitated advanced methodologies to quantitatively assess differences in viral behavior at the cellular level. High-content imaging and confocal analysis have emerged as critical tools for visualizing and quantifying how different viral variants penetrate respiratory tissues and initiate damage. These techniques provide spatially resolved, multidimensional data that reveal fundamental differences in viral pathogenesis between variants.
This guide objectively compares the application of these imaging technologies in characterizing the tissue interaction patterns of Delta (B.1.617.2) and Omicron (B.1.1.529 and subvariants) SARS-CoV-2 variants, with a specific focus on findings from advanced 3D respiratory models that closely mimic human airway physiology.
Comparative Pathogenesis: Delta versus Omicron Variants
Comprehensive studies using human airway epithelial (HAE) models have revealed fundamental differences in how Delta and Omicron variants interact with respiratory tissues. These differences in tissue penetration and cellular tropism directly influence pathogenicity and clinical outcomes.
Table 1: Key Differences in Tissue Penetration and Cellular Damage Between Variants
| Parameter | Delta Variant | Omicron Variant (BA.5, BQ.1.1, BF.7) |
|---|---|---|
| Tissue Penetration Depth | Deep penetration throughout epithelium, reaching basement membrane [40] [46] [47] | Superficial, restricted to apical mucosal layers [40] [46] [47] |
| Epithelial Integrity | Major tissue destruction, loss of epithelial barrier function [40] [46] [47] | Maintained epithelial integrity, outward-directed damage only [40] [46] [47] |
| Viral Load | High viral titers in respiratory tissues [21] [40] | Significantly reduced viral loads compared to Delta [21] [40] |
| Cell Damage Marker (LDH) | High LDH activity indicating substantial cytotoxicity [40] [46] [47] | Minimal LDH release, limited cellular stress [40] [46] [47] |
| Innate Immune Activation | Pronounced complement C3 activation and IL-6 secretion [40] [46] [47] | Significantly reduced complement activation and IL-6 release [40] [46] [47] |
| Inflammatory Cytokines | Upregulation of IL-1α, IL-1β, IL-17α, interferon, TNF [21] | Attenuated cytokine response [21] |
| Basolateral Virus Release | Efficient basolateral viral dissemination [40] [46] [47] | Limited basolateral release, predominantly apical shedding [40] [46] [47] |
The differential pathogenesis patterns extend beyond respiratory tissues. Studies in K18-hACE2 transgenic mice demonstrate that the wild-type SARS-CoV-2 variant exhibited the highest pathogenicity, followed by the Delta variant, then the Omicron variant [21]. This pathogenicity gradient was evidenced by upregulated expression of toll-like receptors (TLRs) in lung and brain tissues of wild-type- and Delta-infected groups but not in Omicron-infected animals [21].
Experimental Protocols for High-Content Imaging
3D Human Airway Epithelial Model System
The foundation of reliable high-content imaging begins with physiologically relevant model systems. Primary normal human bronchial epithelial (NHBE) cells are cultured at air-liquid interface (ALI) for 4-5 weeks to achieve full differentiation into a pseudostratified, mucociliary epithelium [40] [46] [47]. This model recapitulates the cellular complexity of human respiratory epithelium, including basal cells, ciliated cells, and goblet cells, providing an authentic platform for viral pathogenesis studies.
Key Culture Parameters:
- Seeding Density: 1 × 10^5 cells per 0.33 cm^2 Transwell insert [40] [46] [47]
- Differentiation Time: 28-38 days at ALI [40] [46] [47]
- Culture Media: Specialized airway differentiation media (e.g., Stemcell) [40] [46] [47]
- Quality Assessment: Transepithelial electrical resistance (TEER) measurements to confirm barrier integrity [40] [46] [47]
Infection Protocol and Sample Processing
For infection studies, fully differentiated HAE cultures are inoculated apically with SARS-CoV-2 variants at a low multiplicity of infection (MOI of 0.0025-0.1) to mimic natural infection conditions [40] [46] [47]. After 2 hours of incubation, non-internalized virus is removed by washing, and fresh medium is applied. Tissues are harvested at designated time points (typically 2-6 days post-infection) for analysis [21] [40].
Immunofluorescence Staining and Imaging
The core imaging protocol involves several critical steps that ensure preservation of tissue architecture and accurate antigen detection:
- Fixation: 4% paraformaldehyde for 15-60 minutes at room temperature [40] [46] [47]
- Permeabilization: 1x Intracellular Staining Permeabilization Wash Buffer (10x; BioLegend) [40] [46] [47]
- Staining Cocktail:
- Actin Cytoskeleton: Phalloidin-Alexa647 (ThermoFisher Scientific) [40] [46] [47]
- Nuclei: Hoechst (Cell Signaling Technologies) [40] [46] [47]
- SARS-CoV-2 Nucleocapsid: Alexa594-labeled anti-N antibody (Sino Biological) [40] [46] [47]
- Complement C3: C3-FITC antibody (Agilent Technologies) [40] [46] [47]
- Mounting: Mowiol mounting medium [40] [46] [47]
High-Content Image Acquisition and Analysis
Image acquisition is performed using systems such as the Operetta CLS (PerkinElmer) or comparable confocal microscopes capable of capturing z-stacks through the entire epithelial thickness [40] [46] [47]. For robust quantification, analyze at least 400 cells per condition across multiple biological replicates [40] [46] [47].
Harmony or similar high-content analysis software is used for:
- 3D reconstruction of infected tissues
- Quantification of infection foci
- Measurement of viral penetration depth
- Co-localization analysis of viral antigen with cellular markers
- Morphometric analysis of tissue integrity [40] [46] [47]
Signaling Pathways in Variant-Specific Pathogenesis
High-content imaging has revealed how Delta and Omicron variants trigger distinct host response pathways that contribute to their differential pathogenicity. The diagram below illustrates key signaling pathways activated during infection with each variant.
This diagram illustrates the mechanistic basis for observed differences in pathogenicity. The Delta variant triggers robust pro-inflammatory signaling through TLR upregulation and complement activation, leading to substantial tissue damage [21] [40] [46]. In contrast, Omicron exhibits reduced cell entry efficiency but stimulates stronger innate immune activation in actually infected cells, ultimately protecting uninfected neighboring cells and limiting overall tissue damage [13] [20].
Quantitative Analysis of Viral Distribution
High-content imaging enables precise quantification of viral distribution patterns throughout the respiratory epithelium. The table below summarizes key quantitative metrics that differentiate variant behavior.
Table 2: Quantitative Metrics from High-Content Imaging Analysis
| Imaging Metric | Delta Variant | Omicron BA.5 | Omicron BQ.1.1/BF.7 |
|---|---|---|---|
| Penetration Depth (μm) | Full thickness (~40-50μm) [40] [46] [47] | Superficial (<15μm) [40] [46] [47] | Superficial (<15μm) [40] [46] [47] |
| Infection Foci Size | Large, confluent areas [40] [46] [47] | Small, discrete foci [40] [46] [47] | Smaller than BA.5 [40] [46] [47] |
| Cellular Co-localization | With basal cells and cells near basement membrane [40] [46] [47] | Primarily with apical ciliated cells [40] [46] [47] | Primarily with apical ciliated cells [40] [46] [47] |
| Complement C3 Activation Area | Extensive (>40% of infection foci) [40] [46] [47] | Limited (<15% of infection foci) [40] [46] [47] | More limited than BA.5 [40] [46] [47] |
| Epithelial Integrity (TEER) | Severe reduction (>80% decrease) [40] [46] [47] | Moderate reduction (<30% decrease) [40] [46] [47] | Minimal reduction [40] [46] [47] |
Mathematical modeling based on these imaging data confirms that differences in both cell entry rate and innate immune induction contribute to the observed attenuation of Omicron variants. The cell entry rate is significantly lower for Omicron, and Omicron triggers a stronger cytokine production rate in infected cells, ultimately making uninfected cells resistant to the virus [13] [20]. Notably, differences in only a single parameter are insufficient to explain the experimental data [13] [20].
The Scientist's Toolkit: Essential Research Reagents
Table 3: Key Research Reagents for High-Content Imaging of SARS-CoV-2 Variants
| Reagent/Cell System | Specification | Application & Function |
|---|---|---|
| Primary NHBE Cells | Normal Human Bronchial Epithelial cells (Lonza, cat# CC-2540 S) [40] [46] [47] | Generate physiologically relevant 3D respiratory epithelia for infection studies |
| ALI Culture Inserts | 0.33 cm² porous (0.4 μm) polyester membrane (Costar, Corning) [40] [46] [47] | Support polarized epithelial differentiation at air-liquid interface |
| SARS-CoV-2 Antibodies | Alexa594-labeled anti-Nucleocapsid (Sino Biological) [40] [46] [47] | Immunofluorescence detection of infected cells |
| Cellular Staining Markers | Phalloidin-Alexa647, Hoechst, C3-FITC antibody [40] [46] [47] | Visualize actin cytoskeleton, nuclei, and complement activation |
| Imaging System | Operetta CLS (PerkinElmer) or equivalent confocal system [40] [46] [47] | High-content automated imaging and 3D reconstruction |
| Analysis Software | Harmony (PerkinElmer) or equivalent [40] [46] [47] | Quantitative analysis of infection parameters and tissue morphology |
| VeroE6/TMPRSS2/ACE2 | Engineered VeroE6 cell line [40] [46] [47] | Virus propagation and plaque assays for infectivity quantification |
High-content imaging and confocal analysis provide powerful methodological frameworks for quantitatively comparing the tissue penetration and cellular damage patterns of emerging SARS-CoV-2 variants. The integrated data from these approaches reveal that Delta and Omicron variants employ fundamentally different infection strategies in human respiratory tissues – with Delta utilizing deep tissue penetration and robust inflammatory activation to drive pathogenicity, while Omicron variants remain largely restricted to superficial layers with attenuated damage responses.
These methodological approaches and findings provide critical insights for drug development professionals screening antiviral compounds and researchers modeling viral pathogenesis. The continued application of these high-content imaging platforms to newly emerging variants will be essential for rapidly characterizing their pathogenic potential and informing appropriate public health responses.
Integration of Computational Predictions with Experimental Validation in 3D Models
The emergence of SARS-CoV-2 variants of concern, particularly Delta (B.1.617.2) and Omicron (B.1.1.529), has presented a critical challenge in understanding viral pathogenicity and developing effective countermeasures. Research combining computational predictions with experimental validation in advanced three-dimensional respiratory models provides crucial insights into their distinct clinical behaviors. The Delta variant is associated with more severe pulmonary disease, while Omicron demonstrates increased transmissibility yet milder outcomes, attributed to differential cellular tropism and immune activation [21] [17]. This guide objectively compares experimental data on these variants' performance across multiple research modalities, detailing methodologies, key findings, and essential reagents for scientists investigating viral pathogenesis and therapeutic development.
Table 1: Comparative Pathogenicity of Delta and Omicron Variants in Experimental Models
| Parameter | Delta Variant | Omicron Variant | Experimental Model | Citation |
|---|---|---|---|---|
| Lung Viral Titer | Significantly higher | Lower/reduced | K18-hACE2 mice | [21] |
| Immune Gene Expression | Upregulated TLRs, cytokines, chemokines | Limited immune activation | K18-hACE2 mice | [21] |
| Primary Replication Site | Lower respiratory tract | Upper respiratory tract | Human nasal epithelium & lung organoids | [43] |
| Lung Pathology | Extensive damage, immune infiltration | Limited pathology | Golden Syrian hamsters | [17] |
| ACE2 Binding Affinity | Enhanced | Comparable/Reduced | Computational docking & MD simulation | [3] [4] |
| TMPRSS2 Dependency | High | Reduced | Pseudovirus entry assay | [43] |
| Metabolic Impact | Significant perturbations | Milder alterations | Human plasma metabolomics | [48] |
Table 2: Computational Prediction and Experimental Validation Concordance
| Analysis Type | Delta Variant Findings | Omicron Variant Findings | Validation Method | Citation |
|---|---|---|---|---|
| RBD-ACE2 Binding Energy | High binding affinity | Variable binding affinity | Molecular dynamics simulation | [3] |
| Spike Protein Dynamics | Favors open state | Increased rigidification of open state | Vibrational entropy calculation | [4] |
| Immune Escape Potential | Moderate escape from antibodies | Significant antibody evasion | Cryo-EM with antibody complexes | [49] |
| Receptor Binding Domain Mutations | L452R, T478K | Multiple mutations including N440K, G446S | Structural analysis & microscale thermophoresis | [49] |
Experimental Protocols for Key Methodologies
Gene Expression Analysis in Transgenic Mouse Models
K18-hACE2 transgenic mice were intranasally infected with wild-type, Delta, or Omicron variants. On day 6 post-infection, lung, brain, and kidney tissues were collected from each group. RNA was extracted and reverse-transcribed to cDNA. The mRNA expression levels of 39 immune response genes were compared by RT-qPCR using specific primers. Viral titers were measured using the median tissue culture infectious dose (TCID50) assay and expressed as Log10 TCID50/0.1 g. Statistical significance was determined by one-way analysis of variance (ANOVA) with alpha = 0.05 [21].
Molecular Dynamics Simulation of RBD-ACE2 Interactions
The crystal structure of SARS-CoV-2 spike glycoprotein in complex with hACE-2 (PDB ID: 7DF4) was obtained from RSCB Protein Data Bank. Mutations for each variant were inserted into the spike protein using rotamer library plugin on UCSF Chimera software. Molecular docking of Spike RBD for each variant with hACE-2 was performed using HADDOCK servers with default parameters. MD simulations were performed using AMBER 18 with the FF18SB force field. Systems were neutralized with counterions and suspended in an orthorhombic box of TIP3P water molecules. After initial minimization and gradual heating, production simulations were run for 50 ns under NPT ensemble with a 2 fs time step [3].
Cryo-EM Structural Analysis of Spike-Antibody Complexes
The full-length trimeric Delta S-protein with stabilizing mutations (K986P and V987P) and modified furin cleavage site was complexed with REGN10987-Fab. Samples were applied to cryo-EM grids, vitrified, and imaged at 300 kV. Data collection was performed at 130,000 magnification with a pixel size of 0.929 Å. Defocus range was set at -0.8 to -1.6 μm. From initial particle images, 44,323 final particles were used for reconstruction. The structure was refined to an overall resolution of 2.53 Å using non-uniform refinement procedures. Model building was performed using Coot and refined in Phenix [49].
Air-Liquid Interface Culture Infection Model
Primary human nasal epithelial cells were cultured at air-liquid interface (ALI) for 4-6 weeks to form differentiated pseudostratified mucociliary epithelium. Cultures were inoculated apically with Delta or Omicron variants. Apical and basolateral samples were collected at 24, 48, 72, and 96 hours post-inoculation. Viral replication was quantified by RT-qPCR for genomic RNA and subgenomic RNA. Infectious virus titers were determined by TCID50 assay. Cell death was assessed by lactate dehydrogenase (LDH) release, and innate immune responses were measured by cytokine/chemokine profiling [43].
Molecular Mechanisms of Pathogenicity Differences
Diagram 1: Molecular pathogenesis pathways of Delta and Omicron variants
Experimental Workflow: From Computational Prediction to Validation
Diagram 2: Integrated computational and experimental validation workflow
The Scientist's Toolkit: Essential Research Reagents
Table 3: Key Research Reagents for SARS-CoV-2 Variant Studies
| Reagent / Solution | Function / Application | Example Usage | Citation |
|---|---|---|---|
| K18-hACE2 transgenic mice | In vivo model for SARS-CoV-2 infection and pathogenesis | Comparative analysis of immune response gene expression | [21] |
| Human nasal epithelial ALI cultures | Differentiated respiratory epithelium for viral tropism studies | Evaluation of variant-specific replication in URT | [43] |
| REGN10987 Fab fragment | Neutralizing antibody for structural studies | Cryo-EM analysis of Spike-antibody complexes | [49] |
| HADDOCK docking server | Protein-protein molecular docking | Prediction of RBD-ACE2 binding interactions | [3] |
| AMBER molecular dynamics package | Simulation of biomolecular interactions | Calculation of binding free energies and conformational dynamics | [3] |
| Cryo-EM grid preparation materials | Sample preparation for structural biology | High-resolution structure determination of Spike variants | [49] |
| Targeted metabolomics kits | Quantitative analysis of metabolic changes | Assessment of variant-specific metabolic perturbations | [48] |
| SARS-CoV-2 pseudotyping systems | Safe evaluation of viral entry mechanisms | Analysis of TMPRSS2 usage and ACE2 affinity | [43] |
Discussion: Integration of Multidisciplinary Approaches
The integration of computational predictions with experimental validation provides a powerful framework for understanding the distinct pathogenicity profiles of SARS-CoV-2 variants. Computational approaches including molecular dynamics simulations and docking studies predicted the differential ACE2 binding affinities and spike protein dynamics between Delta and Omicron variants [3] [4]. These predictions were experimentally validated through cryo-EM structural analysis, which revealed how Omicron mutations mediate antibody evasion at the expense of reduced receptor binding affinity [49]. The convergence of computational and experimental data explains the clinical observation that Omicron causes less severe disease despite enhanced transmissibility.
Advanced 3D respiratory models, particularly human nasal epithelium ALI cultures, have been instrumental in demonstrating the variant-specific tropism that underlies their pathological differences. Contemporary Omicron variants exhibit enhanced fitness in the upper respiratory tract but limited replication in lung models, correlating with their reduced severity compared to Delta [43]. This tissue tropism is mechanistically linked to reduced TMPRSS2 usage by Omicron, limiting its ability to infect lung cells that express this protease abundantly [43]. The metabolic perturbations observed in Delta infection further reflect its more systemic impact compared to Omicron [48] [17].
The comprehensive dataset generated through these integrated approaches provides not only insights into viral pathogenesis but also critical guidance for therapeutic development. The structural characterization of antibody evasion mechanisms informs the design of next-generation monoclonal antibodies and vaccines effective across variants [49] [50]. As SARS-CoV-2 continues to evolve, this multidisciplinary framework will remain essential for rapidly characterizing emerging variants and developing appropriate countermeasures.
Addressing Technical Challenges in 3D Model Research and Data Interpretation
The successive emergence of the SARS-CoV-2 Delta and Omicron variants represented a pivotal shift in the COVID-19 pandemic, characterized by altered transmission dynamics and disease severity. A critical factor underlying these clinical differences is fundamental change in how these variants replicate within host tissues. This guide provides a detailed, data-driven comparison of Delta and Omicron replication kinetics across experimental models, offering researchers essential methodologies and analytical frameworks for optimizing assay designs in variant-specific research. Evidence from 3D respiratory models, primary human airway cultures, and mathematical modeling consistently demonstrates that Omicron variants exhibit enhanced upper respiratory tract replication but attenuated lung pathology compared to the more cytotoxic Delta variant [43] [46]. Understanding these distinct spatiotemporal replication patterns is essential for selecting appropriate experimental systems, optimizing detection timepoints, and accurately interpreting variant-specific pathogenicity data.
Comparative Replication Kinetics: Quantitative Analysis
The replication profiles of Delta and Omicron variants differ substantially across experimental models, with timing and location of peak replication being key determinants for assay sensitivity.
Table 1: Viral Replication Kinetics of SARS-CoV-2 Variants in Respiratory Models
| Experimental Model | Variant | Peak Viral Titer/Load | Time to Peak | Key Observations | Source |
|---|---|---|---|---|---|
| Human Nasal Epithelium (ALI) | Delta | Moderate | 72 hpi | ~1.5-log lower genome copies at 24 hpi vs. contemporary Omicron | [43] |
| Omicron (BA.1) | High | 72 hpi | Faster initial replication than Delta | [43] | |
| Omicron (XBB.1.5, EG.5.1, JN.1) | High | 24-72 hpi | Significantly faster early replication (1.5-log increase at 24 hpi) vs. Delta/BA.1 | [43] | |
| Human Lung Cells (Calu-3) | Delta | High | 48-72 hpi | Robust replication in TMPRSS2-expressing cells | [19] [20] |
| Omicron (BA.1) | Low | 48-72 hpi | Poor replication; significantly lower viral loads than Delta | [19] | |
| 3D Respiratory Model (Primary HAE) | Delta | High | 48 hpi | Deep epithelial penetration; major tissue destruction; high LDH activity | [46] |
| Omicron (BA.5, BQ.1.1, BF.7) | Low-Moderate | 48 hpi | Superficial mucosal layer retention; minimal LDH activity; lower viral loads | [46] | |
| Syrian Hamster (Lungs) | Delta | High | 5 dpi | Consistent detection of infectious virus | [43] [17] |
| Omicron (JN.1) | Not detected | 5 dpi | Failure to replicate in lungs after intranasal inoculation | [43] |
Table 2: Viral Replication Kinetics in Standard Cell Lines
| Cell Line | Variant | Peak Viral Titer | Time to Peak | Plaque Phenotype | Source |
|---|---|---|---|---|---|
| Vero E6/TMPRSS2 | Delta | 2.2x10^7 copies/mL (24 hpi) | 24 hpi | Not specified | [19] |
| Omicron (BA.1) | 2.4x10^6 copies/mL (24 hpi) | 24 hpi | Not specified | [19] | |
| Vero E6 | Beta | Highest titer at 24 hpi | 48 hpi | Largest plaques | [51] |
| Delta | Moderate | 48 hpi | Medium plaques | [51] | |
| Omicron (BA.1) | Lowest titer at 24 hpi | 48 hpi | Smallest plaques; delayed plaque formation (96 hpi) | [51] | |
| Caco-2 | Delta | High | 48 hpi | Not specified | [20] |
| Omicron | Lower than Delta | 48 hpi | Not specified | [20] |
Key Experimental Protocols for Kinetic Analysis
Viral Replication Kinetics in Air-Liquid Interface (ALI) Cultures of Human Respiratory Epithelium
Primary Cells: Normal human bronchial epithelial (NHBE) cells or human nasal epithelial cells (hNECs) cultured at air-liquid interface for 4-5 weeks to achieve full mucociliary differentiation [43] [46].
Infection Protocol: Differentiate primary cells on porous membrane inserts using specific epithelial cell growth medium. Apical inoculation with SARS-CoV-2 variants at low multiplicity of infection (MOI 0.0025-0.05) to mimic natural infection [43] [46]. Maintain virus in contact with apical surface for 1-2 hours before removal.
Sample Collection: Collect apical wash samples and basolateral supernatants at multiple time points (e.g., 1, 24, 48, 72, 96 hours post-inoculation). Preserve samples for viral titer quantification (plaque assay) and RNA extraction (RT-qPCR) [43].
Downstream Analysis:
- Quantify viral genomic RNA and subgenomic RNA using RT-qPCR with specific primers (e.g., SARS-CoV-2 N1, N2) [46].
- Determine infectious virus titers by plaque assay using VeroE6/TMPRSS2/ACE2 cells [46].
- Assess tissue integrity through transepithelial electrical resistance (TEER) measurements [46].
- Evaluate cytopathology via lactate dehydrogenase (LDH) release assays and immunohistochemical staining for viral antigen and immune markers [46].
Mathematical Modeling of Viral Dynamics
Experimental Data Collection: Infect Caco-2 (intestinal model) and Calu-3 (lung model) cells with Delta and Omicron variants at standardized MOI (0.1 for Caco-2, 0.5 for Calu-3). Collect time-course measurements including infectious virus titers (TCID₅₀ assay) and intracellular viral RNA at multiple post-infection time points [20].
Model Formulation: Develop integro-differential equation systems incorporating target cell populations, infected cell compartments, and viral replication dynamics. Include variant-specific parameters for cell entry rate and immune induction [20].
Parameter Estimation: Fit model to experimental data using optimization algorithms to quantify key variant-specific differences: cell entry rate (β), viral production rate (ω), and cytokine-mediated protection rate [20].
Model Application: Use fitted parameters to calculate variant-specific basic reproduction numbers (R₀) and growth rates (r) in different cell types. Compare R₀ values between variants to predict competitive outcomes [22] [20].
Research Reagent Solutions
Table 3: Essential Research Reagents for SARS-CoV-2 Variant Studies
| Reagent/Cell Line | Key Application | Experimental Consideration |
|---|---|---|
| Vero E6/TMPRSS2 | Viral isolation, propagation, and plaque assays | Engineered to express high TMPRSS2/ACE2; highly susceptible to Delta [19] [46] |
| Calu-3 | Lung epithelium infection model | Endogenous robust TMPRSS2 expression; supports Delta replication better than Omicron [19] [20] |
| Primary Human Nasal Epithelial Cells (hNECs) | Physiologically relevant upper respiratory tract model | ALI cultures mimic in vivo conditions; show Omicron replication advantage [22] [43] |
| Camostat Mesylate | TMPRSS2 protease inhibitor | Potently inhibits Delta entry; less effective against Omicron [22] [19] |
| Bafilomycin A1 | Endosomal pathway inhibitor | Inhibits both Delta and Omicron entry [19] |
| Chloroquine | Endosomal pathway inhibitor | Suppresses both Delta and Omicron infection [19] |
| Amphotericin B | Counteracts endosomal restriction factors | Enhances Omicron infectivity by inhibiting IFITM proteins [22] |
Pathway and Workflow Visualization
Discussion and Research Implications
The comprehensive comparison of Delta and Omicron replication kinetics reveals critical implications for assay design and timing in SARS-CoV-2 research. Omicron variants consistently demonstrate faster replication in upper respiratory models, peaking earlier in nasal epithelium, necessitating earlier detection timepoints (24-48 hpi) in these systems [43]. In contrast, Delta variants exhibit superior replication in lung models with later peak titers (48-72 hpi), requiring different optimal detection windows [19] [20]. These patterns correlate with fundamental differences in viral entry mechanisms, where Omicron preferentially utilizes endosomal pathways while Delta efficiently employs TMPRSS2-mediated surface entry [22] [19].
The reduced TMPRSS2 dependency of Omicron variants explains their attenuated replication in lung cells and decreased pathogenicity in 3D respiratory models and animal studies [43] [46]. This mechanistic understanding enables more accurate prediction of emerging variant behavior based on spike protein mutations and entry pathway preferences. Mathematical modeling further enhances this predictive capability by quantifying variant-specific parameters like cell entry rates and immune stimulation [20], providing a framework for anticipating the behavior of newly emerging variants.
For researchers investigating antiviral therapeutics, these kinetic differences necessitate variant-specific assay validation. Compounds targeting TMPRSS2-mediated entry show reduced efficacy against Omicron [19] [52], while endosomal pathway inhibitors maintain activity across variants [19]. Similarly, vaccine and antibody development must account for variant-specific replication patterns and tissue tropism when evaluating efficacy in different anatomical compartments.
The distinct replication kinetics of SARS-CoV-2 variants demand precise adjustment of experimental approaches across research applications. Assay sensitivity fundamentally depends on aligning detection timepoints with variant-specific replication peaks—early sampling (24-48 hpi) for Omicron in upper respiratory models and later sampling (48-72 hpi) for Delta in lung models. Cell line selection must consider entry pathway preferences, with TMPRSS2-expressing systems optimal for Delta and primary nasal cultures better reflecting Omicron biology. Mathematical modeling provides valuable quantitative frameworks for extracting variant-specific parameters from kinetic data. As SARS-CoV-2 continues to evolve, these principles for navigating variant-specific replication kinetics will remain essential for accurate therapeutic evaluation, pathogenicity assessment, and preparedness for future variants of concern.
The emergence of SARS-CoV-2 variants with distinct pathogenic characteristics, particularly the differential replication capacities of Delta and Omicron subvariants, has created critical challenges for viral detection and research. Low-replicating variants such as Omicron BA.1 and BA.2 demonstrate reduced in vitro growth kinetics compared to the ancestral B.1.1 strain and Delta variant, necessitating highly sensitive detection methodologies [15]. Within the context of 3D respiratory models investigating Delta and Omicron pathogenicity, selecting appropriate detection methods becomes paramount for accurate experimental outcomes. The plaque assay, long considered the gold standard for detecting infectious virus, faces limitations when viral titers are low, while PCR-based methods, though highly sensitive, cannot differentiate between infectious and non-infectious viral RNA [53]. This methodological comparison guide provides an objective analysis of these complementary techniques, supported by experimental data, to inform researchers studying SARS-CoV-2 variant biology.
Fundamental Principles of PCR and Plaque Assay Methods
PCR-Based Detection Methods
Polymerase Chain Reaction (PCR) and its derivatives operate on the principle of enzymatic amplification of specific nucleic acid sequences. Real-time reverse transcriptase PCR (RT-qPCR) has emerged as the most reliable technique for SARS-CoV-2 viral gene detection due to its exceptional sensitivity and specificity [54]. This method involves reverse transcribing viral RNA into complementary DNA (cDNA), followed by quantitative amplification with sequence-specific primers and probes. The quantitative nature of RT-qPCR provides Cycle threshold (Ct) values that correlate inversely with viral load, offering researchers a powerful tool for quantifying viral RNA in clinical and experimental samples.
Recent advances in nucleic acid amplification techniques (NAATs) have further enhanced detection capabilities. These methods target conserved regions of the SARS-CoV-2 genome, most commonly regions within the N, E, S, and RdRP genes, allowing for specific identification even amid viral evolution [54]. The extraordinary sensitivity of PCR-based methods enables detection of as few as 10 viral RNA copies per reaction, making them indispensable for identifying low-level infections where viral titers might be insufficient for culture-based methods.
Plaque Assay Methodology
The plaque assay represents a classical virological technique for quantifying infectious viral particles through their cytopathic effects on permissive cell lines. This method relies on the principle that a single infectious virion will initiate a focus of infection, leading to localized cell death that manifests as a clear "plaque" against a background of viable cells [53]. For SARS-CoV-2, Vero E6/TMPRSS2 cells have proven particularly effective due to their high susceptibility to infection and ability to support robust viral replication.
The quantification aspect of plaque assays provides researchers with tangible data on infectious viral burden, expressed as plaque-forming units per milliliter (PFU/mL). SARS-CoV-2 typically produces large, haloed plaques in Vero CCL-81 cell monolayers within 2-3 days, though plaque morphology can vary between variants [53]. This morphological difference can itself serve as a distinguishing characteristic between variants with different pathogenic properties, providing additional information beyond mere quantification.
Comparative Performance Analysis for Low-Replicating Variants
Quantitative Comparison of Methodological Capabilities
Table 1: Direct comparison of PCR and plaque assay characteristics for SARS-CoV-2 detection
| Parameter | PCR-Based Methods | Plaque Assay |
|---|---|---|
| Detection Target | Viral RNA (genomic and subgenomic) | Infectious viral particles |
| Sensitivity | High (can detect ≤10 RNA copies/reaction) | Moderate (limit of ~5 PFU/mL) [53] |
| Time to Results | 4-8 hours | 2-3 days for visible plaques [53] |
| Quantification | Ct values correlating with viral RNA load | Direct count of PFU/mL |
| Information on Infectivity | No | Yes |
| Suitable for Variant Differentiation | Yes, with specific primers/probes or sequencing | Limited, though plaque morphology may differ |
| Ability to Detect Low-Replicating Variants | Excellent sensitivity | May fail with very low titers |
| Throughput Capacity | High | Low to moderate |
| Technical Complexity | Moderate | High, requiring cell culture expertise |
Performance in Delta vs. Omicron Pathogenicity Research
The distinct replication characteristics of SARS-CoV-2 variants significantly impact methodological detection efficiency. Research has demonstrated that Omicron subvariants exhibit different in vitro growth kinetics compared to Delta, with BA.1 showing notably lower replication rates in certain cell lines [15]. This reduced replicative capacity directly influences detection sensitivity, particularly for plaque assays which require sufficient infectious virus to form visible plaques.
In the context of 3D respiratory models, studies have revealed that BA.5, despite being an Omicron subvariant, possesses enhanced ability to disrupt respiratory epithelial and endothelial barriers compared to BA.1 and BA.2 [15]. This pathogenicity distinction underscores the importance of method selection when evaluating variant-specific characteristics. PCR-based methods consistently detect viral RNA in such models, but only plaque assays can confirm the presence of truly infectious virus responsible for barrier disruption.
Correlation studies between PCR Ct values and successful plaque isolation have established that N-gene based Ct values ≤25 are significantly predictive of yielding plaques in culture [53]. This relationship provides researchers with a valuable guideline for determining when either method might be most appropriate, particularly when working with low-replicating variants where infectious virus might be present at the assay's detection threshold.
Experimental Protocols for SARS-CoV-2 Variant Detection
Standardized Plaque Assay Protocol for SARS-CoV-2 Variants
The following protocol has been optimized for detecting infectious SARS-CoV-2 variants in clinical and research samples:
Cell Preparation: Seed Vero E6/TMPRSS2 cells in 12-well tissue culture plates at a density of 2.5 × 10^5 cells per well and incubate at 37°C with 5% CO₂ until 90-95% confluent [53].
Sample Inoculation:
- Aspirate culture medium from cell monolayers
- Inoculate with 200-500 μL of serially diluted sample (in duplicate or triplicate)
- Adsorb for 60-90 minutes at 37°C with gentle rocking every 15 minutes
Overlay Addition:
- Prepare overlay medium: 1.5% carboxymethylcellulose or 0.6% agarose in maintenance medium
- Carefully add 2 mL overlay per well without disturbing the monolayer
- Incubate plates at 37°C with 5% CO₂ for 2-3 days
Plaque Visualization and Counting:
- Fix cells with 10% formalin for 30 minutes (in biosafety cabinet)
- Remove overlay and stain with 0.1% crystal violet for 15-20 minutes
- Rinse gently with tap water and air dry
- Count distinct plaques and calculate PFU/mL using dilution factors
For low-replicating variants, the incubation period may be extended to 4-5 days to allow smaller plaques to become visible. Immunohistochemistry using SARS-CoV-2 nucleocapsid-specific antibodies can be employed to confirm ambiguous plaques [53].
RT-qPCR Protocol for SARS-CoV-2 Variant Detection and Quantification
RNA Extraction:
- Extract viral RNA from 140 μL sample using commercial silica-membrane based kits
- Elute in 50-60 μL nuclease-free water
- Store extracts at -80°C if not used immediately
Reverse Transcription and PCR Amplification:
- Prepare reaction mix: 5 μL RNA, 12.5 μL 2× reaction buffer, 1 μL reverse transcriptase, 1.25 μL primer/probe mix, and 5.25 μL nuclease-free water
- Use primers and probes targeting N1, N2, E, and RdRP genes for multiplex detection [54]
- Run the following thermal profile: 50°C for 15 min (reverse transcription), 95°C for 2 min, followed by 45 cycles of 95°C for 15 sec and 60°C for 30 sec
Data Analysis:
- Determine Ct values for each sample
- Quantify viral load using standard curves from serial dilutions of SARS-CoV-2 RNA standards
- Report results as Ct values or genomic copies/mL
For variant differentiation, additional genotyping assays targeting variant-specific mutations (e.g., L452R for Delta, HV69-70del for Omicron BA.1) can be incorporated [55].
Integrated Detection Approaches and Advanced Methodologies
Hybrid Detection Strategies
To overcome the limitations of both PCR and plaque assays, researchers have developed integrated approaches that combine methodological strengths. The Integrated Cell Culture Quantitative PCR (ICC-qPCR) method detects viral infectivity while maintaining molecular specificity and reduced detection time compared to traditional plaque assays [56]. In this approach, samples are inoculated onto permissive cells, followed by PCR detection after a shortened incubation period (typically 24-48 hours), before visible CPE develops.
Another innovative approach, the Integrated Cell Absorption Process and Quantitative PCR (ICAP-qPCR) assay, leverages the principle that only infectious viruses can be absorbed to cell surfaces and penetrate cell membranes [56]. This method involves brief co-incubation of virus samples with susceptible cells, followed by nucleic acid extraction directly from the cells and PCR amplification. This strategy effectively eliminates detection of non-infectious viral RNA while significantly reducing detection time.
Methodological Workflow for Comprehensive Variant Analysis
The following diagram illustrates an integrated approach for detecting and characterizing low-replicating SARS-CoV-2 variants in respiratory models:
Integrated Workflow for Variant Detection
This integrated workflow enables researchers to simultaneously obtain information on viral load (PCR), infectivity (plaque assay), and variant characterization (genotyping), providing a comprehensive understanding of variant behavior in respiratory models.
Essential Research Reagent Solutions
Table 2: Key research reagents for SARS-CoV-2 variant detection studies
| Reagent/Cell Line | Specific Function | Application Notes |
|---|---|---|
| Vero E6/TMPRSS2 | Permissive cell line supporting SARS-CoV-2 replication | Essential for plaque assays; enhances infectivity for low-replicating variants [15] |
| Primer/Probe Sets (N1, N2, E, RdRP) | Specific detection of SARS-CoV-2 RNA by RT-qPCR | Multiplex approaches increase detection reliability [54] |
| Variant-Specific Genotyping Assays | Differentiation between Delta, Omicron subvariants | Targets mutations like L452R (Delta), HV69-70del (Omicron BA.1) [55] |
| Carboxymethylcellulose/Agarose | Semi-solid overlay for plaque assays | Restricts viral spread for discrete plaque formation [53] |
| SARS-CoV-2 Neutralizing Antibodies | Confirmation of viral specificity | Used for immunohistochemistry validation of plaques [53] |
| Viral Transport Media | Preservation of sample integrity | Critical for maintaining infectivity during transport [54] |
The optimization of detection methods for low-replicating SARS-CoV-2 variants requires careful consideration of research objectives and methodological capabilities. PCR-based methods offer superior sensitivity and rapid results essential for screening and quantification, while plaque assays provide irreplaceable data on infectious viral burden critical for pathogenicity studies. The emerging paradigm favors integrated approaches that combine methodological strengths, particularly when investigating the distinct pathogenic profiles of Delta and Omicron variants in advanced 3D respiratory models. As variant evolution continues, methodological flexibility and validation will remain cornerstone principles for robust SARS-CoV-2 research.
The emergence of Severe Acute Respiratory Syndrome Coronavirus 2 (SARS-CoV-2) variants of concern (VOCs), particularly Delta and Omicron, has highlighted critical differences in viral pathogenicity and host immune response. Research using advanced 3D respiratory models has revealed that these variants interact fundamentally differently with human respiratory tissues, triggering distinct innate immune pathways [46]. The Delta variant penetrates deeply into the respiratory epithelium, causing significant tissue destruction and robust inflammatory activation, while Omicron subvariants remain more superficial with reduced pathogenic impact [46] [6]. These differential responses necessitate precise, standardized approaches to cytokine and chemokine measurement to accurately quantify variant-specific immune signatures. Such standardization enables meaningful comparisons across studies and provides insights into disease mechanisms, ultimately informing therapeutic development and prognostic strategies.
This guide systematically compares leading cytokine/chemokine measurement technologies and their application in VOC research, with a specific focus on profiling the distinct pathogenic profiles of Delta and Omicron variants in physiologically relevant 3D respiratory models.
Comparative Cytokine/Chemokine Profiles of Delta and Omicron Variants
Variant-Specific Immune Signatures in Preclinical Models
Studies in K18-hACE2 transgenic mice infected with wild-type, Delta, and Omicron variants revealed significant differences in immune gene expression. The wild-type variant exhibited highest pathogenicity, followed by Delta, then Omicron [21]. Specific differences included:
- Toll-like receptors (TLRs): Upregulated in lung and brain tissues of wild-type and Delta-infected groups but not in Omicron-infected mice [21]
- Pro-inflammatory cytokines: Highest expression of IL-1α, IL-1β, IL-17α, interferon, and tumor necrosis factors observed in lungs of wild-type-infected mice [21]
- Chemokines: CCL4, CCL11, CXCL9, and CXCL10 were upregulated (>3-fold) in wild-type-infected mice, with markedly higher expressions in brain than lungs [21]
- Apoptotic factors: Mainly expressed in brain tissues of Omicron-infected mice (caspase 8, caspase 9, p53, Bax, Bak, BCL-2, and Bcl-XL) [21]
Human 3D Respiratory Model Data on VOC Immune Activation
Research using highly differentiated, pseudostratified human airway epithelia (HAE) cultures demonstrated fundamental differences in how Delta and Omicron variants interact with respiratory tissues:
- Delta variant: Readily penetrated deep into respiratory epithelium, associated with major tissue destruction, high LDH activity, high viral loads, and pronounced innate immune activation with intrinsic complement C3 activation and IL-6 release at infection sites [46]
- Omicron subvariants (BA.5, BQ.1.1, BF7): Remained superficially in the mucosal layer, resulting in merely outward-directed destruction of cells, maintenance of epithelial integrity, minimal LDH activity, low basolateral virus release, significantly smaller areas of complement activation, and lower IL-6 secretion [46]
- Viral replication differences: Omicron replicates faster than Delta in human bronchi but less efficiently in lung parenchyma, potentially explaining reduced disease severity [6]
Table 1: Key Cytokine/Chemokine Differences Between Delta and Omicron Variants in Experimental Models
| Analyte | Delta Variant Response | Omicron Variant Response | Biological Significance |
|---|---|---|---|
| IL-6 | Pronounced elevation in respiratory epithelium [46] | Significantly reduced secretion [46] | Major driver of cytokine storm; correlates with severity |
| IP-10 (CXCL10) | Upregulated in brain tissues [21] | Reduced expression patterns [21] | Chemoattractant for monocytes/macrophages; prognostic marker [57] |
| TNF-α | Strongly upregulated [21] | Moderate upregulation [21] | Pro-inflammatory cytokine; independent predictor of survival [58] |
| MCP-1 (CCL2) | Elevated in severe infection [59] | Lower levels in superficial infection [46] | Monocyte recruitment; biomarker for adverse outcomes [57] |
| IL-8 | Associated with tissue destruction [46] | Reduced in superficial infection [46] | Neutrophil chemoattractant; elevated in severe COVID-19 [60] |
| IL-1β | Component of hyperinflammation [60] | Reduced compared to Delta [21] | Pyrogenic cytokine; imbalanced with IFN-α in critical patients [60] |
Clinically Relevant Cytokine Biomarkers for COVID-19 Severity and Outcomes
Human studies have identified specific cytokine profiles associated with disease progression and mortality:
- Predictors of survival: High serum IL-6, IL-8, and TNF-α levels at hospitalization are strong independent predictors of patient survival [58]
- Lethal COVID-19 biomarkers: Based on patient age, high concentrations of IL-6, MCP-1, and pentraxin 3 were important biomarkers for lethal COVID-19 [59]
- Mild disease association: Decreased concentrations of IP-10, IL-10, and soluble tumor necrosis factor receptor I were associated with mild COVID-19 [59]
- Adverse outcome predictors: Serum concentrations of IP-10, MCP-1, sTREM-1, and IL-10 can serve as biomarkers to predict adverse outcomes in COVID-19, with IP-10 being the most powerful indicator (AUC: 0.715) [57]
Table 2: Analytical Performance Comparison of Cytokine Measurement Technologies
| Technology | Sensitivity | Dynamic Range | Multiplexing Capability | Throughput | Best Application Context |
|---|---|---|---|---|---|
| MSD | Best sensitivity in low detection limit [61] | Broadest dynamic range [61] | Moderate | Moderate | Studies requiring maximum sensitivity |
| CBA (Cytometric Bead Array) | Superior performance [61] | Broad [61] | High | High | High-throughput screening with multiplexing |
| Luminex | Superior performance [61] | Broad [61] | High | High | Large sample numbers with multi-analyte profiling |
| ELISA | Moderate | Limited | Low | Low | Targeted analysis of single analytes |
| ELLA | Sufficient for clinical prediction | Adequate for severity stratification | Low | Rapid (3h turnaround) | Clinical settings requiring rapid results [58] |
Experimental Protocols for VOC Immune Profiling
3D Human Airway Epithelium Model for VOC Pathogenesis Studies
Overview: This protocol describes the establishment of highly differentiated, pseudostratified respiratory epithelial cultures to compare SARS-CoV-2 variant infection kinetics, tissue penetration, and immune response activation [46].
Key Materials:
- Normal human bronchial epithelial (NHBE) cells (Lonza, cat# CC-2540 S) [46]
- Air-liquid interface (ALI) culture system with porous membrane inserts (Costar, Corning) [46]
- Specialized airway media (Stemcell) [46]
- SARS-CoV-2 variants: Clinical specimens for Delta and Omicron subvariants propagated under BSL3 conditions [46]
Procedure:
- Culture establishment: Seed NHBE cells at density of 1 × 10^5 cells per Transwell and grow to confluence in submerged culture for 3 days [46]
- Epithelial differentiation: Transfer to ALI culture for four weeks until fully differentiated pseudostratified epithelium forms [46]
- Viral infection: Infect cultures with Delta or Omicron variants at MOI of 0.0025 under BSL3 conditions [46]
- Outcome measures:
- TEER measurements: Use EVOM volt-ohm-meter with STX-2 chopstick electrodes to monitor epithelial integrity [46]
- Immunofluorescence: Fix cultures at 2 dpi, stain for SARS-CoV-2 nucleoprotein, complement C3, and cellular markers [46]
- Cytokine measurement: Collect supernatants for multiplex cytokine analysis [46]
- Viral quantification: Extract RNA for real-time RT-PCR targeting N1 and N2 genes [46]
Multiplex Cytokine Profiling Protocol
Overview: This protocol details the simultaneous quantification of multiple cytokines and chemokines from biological samples using magnetic bead-based technology, suitable for both research and potential clinical translation [62].
Key Materials:
- Bio-Plex Pro Human Cytokine Assays (Bio-Rad Laboratories) [62]
- Luminex xMAP instrumentation [62]
- ELLA microfluidics platform (for rapid clinical turnaround) [58]
Procedure:
- Sample preparation: Collect serum or supernatant samples, centrifuge at 1,500 rpm for 5 minutes to remove debris [57]
- Assay setup: Incubate samples with antibody-conjugated magnetic beads according to manufacturer specifications [62]
- Detection: Add detection antibodies and streptavidin-PE reporter system [57]
- Data acquisition: Analyze using Luminex instrumentation or ELLA platform [58] [62]
- Data analysis: Use five-parameter logistic regression for curve fitting and analyte quantification [62]
The Scientist's Toolkit: Essential Research Reagents and Platforms
Table 3: Essential Research Reagents for VOC Immune Response Studies
| Category | Specific Products/Platforms | Application & Function |
|---|---|---|
| Cell Culture Models | Normal human bronchial epithelial (NHBE) cells (Lonza) [46] | Reproduce human respiratory epithelium for VOC infection studies |
| K18-hACE2 transgenic mice [21] | Small animal model for comparative VOC pathogenicity | |
| Cytokine Measurement | Bio-Plex Pro Human Cytokine Assays (Bio-Rad) [62] | Multiplex quantification of 27+ cytokines/chemokines |
| ELLA microfluidics platform (ProteinSimple) [58] | Rapid (3h) cytokine measurement for clinical decision-making | |
| MILLIPLEX MAP Cytokine/Chemokine Panels (Millipore) [63] | Multiplex profiling for animal model studies | |
| Viral Stocks | Clinical SARS-CoV-2 specimens [46] | Authentic viral variants for infection studies |
| Infection Readouts | Transepithelial electrical resistance (TEER) equipment [46] | Measure epithelial barrier integrity post-infection |
| Immunofluorescence staining reagents [46] | Visualize viral distribution and tissue damage | |
| Data Analysis | Harmony High-Content Imaging Software [46] | Analyze complex 3D culture infection phenotypes |
Discussion: Integrating Technological and Biological Considerations
The comparative analysis of cytokine measurement technologies reveals that platform selection must align with specific research objectives. MSD technology offers superior sensitivity for detecting low-abundance analytes, while CBA and Luminex platforms provide optimal balance of multiplexing capability and throughput for comprehensive immune profiling [61]. For clinical applications requiring rapid turnaround, the ELLA platform delivers results within 3 hours, enabling potential integration into therapeutic decision-making [58].
The distinct immune signatures triggered by Delta versus Omicron variants highlight the importance of panel selection. For comprehensive VOC characterization, panels should include core severity predictors (IL-6, TNF-α), chemotactic factors (IP-10, MCP-1), and epithelial damage markers to capture the full spectrum of variant-specific pathogenesis [46] [58] [57]. The demonstrated differences in tissue tropism and resultant immune activation between variants underscore the value of physiologically relevant 3D models that preserve native tissue architecture and cellular diversity [46] [6].
Standardization of sampling timelines is equally critical, as longitudinal studies reveal dynamic cytokine patterns throughout infection. IL-6 and IP-10 show significant decrease from hospital admission to discharge, while other mediators follow distinct temporal patterns [60] [62]. The integration of these technological, biological, and temporal considerations will enhance cross-study comparability and accelerate the understanding of VOC-specific immune pathogenesis.
The trajectory of the COVID-19 pandemic has been shaped by the continual emergence of new SARS-CoV-2 variants, with Delta and Omicron representing two pivotal points of viral evolution. A central paradox that has emerged from their study is the disconnect between molecular-level binding affinity and phenotypic infectivity outcomes. While binding affinity quantitatively describes the strength of the virus-receptor interaction, infectivity is a functional phenotype describing the efficiency of viral entry and replication in a cellular context. This guide objectively compares the performance of the Delta and Omicron variants, dissecting this paradox through the lens of experimental data derived from advanced 3D respiratory models and other relevant platforms. We will summarize quantitative data, detail key methodologies, and visualize the underlying mechanisms to provide a structured resource for researchers and drug development professionals.
Quantitative Data Comparison: Delta vs. Omicron
The following tables consolidate key experimental findings, highlighting the contrasting characteristics of the Delta and Omicron variants.
Table 1: Comparative Molecular and Cellular Phenotypes of Delta and Omicron Variants
| Parameter | Delta Variant (B.1.617.2) | Omicron Variant (e.g., BA.1) | Experimental Context & Citations |
|---|---|---|---|
| ACE2 Binding Affinity | Higher than ancestral, but less than some Omicron subvariants [64] | Significantly enhanced; BA.2.86.1 showed ~15% higher binding free energy than WT [65] | Molecular Dynamics (MD) simulations & binding free energy calculations (MM/GBSA) [64] [65] |
| Replication in Lung-derived Cells (Calu-3) | High replication kinetics, faster than ancestral B.1 lineage [66] | Generally reduced kinetics (BA.1, BA.2); later subvariants (e.g., EG.5.1) regained fitness [66] | Recombinant viruses with variant spikes in isogenic background (Wuhan-Hu-1) [66] |
| Cell-Cell Fusogenicity | Highly fusogenic, significantly more than ancestral B.1 [66] | Weakly fusogenic (early subvariants); later subvariants (e.g., BA.2.86) regained high fusogenicity [66] | GFP-split fusion assay in A549-hACE2-TMPRSS2 cells [66] |
| Preferred Entry Pathway | TMPRSS2-dependent, plasma membrane fusion [66] | Cathepsin-dependent, endosomal fusion [66] | Infection assays with specific pathway inhibitors (e.g., Camostat, E64d) [66] |
| Clinical Severity Correlation | Associated with more severe disease and pulmonary pathology [67] | Associated with less severe disease, but enhanced upper respiratory tropism [67] | Cohort studies comparing clinical outcomes [67] |
Table 2: Key Mutations and Their Functional Impacts in Delta and Omicron Spike Protein
| Variant | Characteristic Spike Mutations | Postulated Primary Functional Consequences |
|---|---|---|
| Delta (B.1.617.2) | L452R, T478K, P681R [68] | • L452R/T478K: Enhanced ACE2 binding affinity and immune escape [68].• P681R: Enhances spike cleavage by furin, promoting TMPRSS2 usage and cell-cell fusion [68] [66]. |
| Omicron (BA.1) | ~30 mutations including K417N, N440K, G446S, S477N, T478K, E484A, Q493R, G496S, Q498R, N501Y, Y505H [69] | • Multiple RBD mutations: Dramatically reduce antibody binding affinity (immune escape), with some (e.g., Q498R, N501Y) compensating for ACE2 affinity loss from others [69].• Altered cleavage site: Reduces TMPRSS2 usage, shifting entry pathway to endosomes [66]. |
Experimental Protocols for Key Assays
To interpret the data presented, an understanding of the core experimental methodologies is essential.
Molecular Dynamics (MD) Simulations for Binding Affinity
This in silico protocol is used to calculate the binding free energy between the viral Receptor Binding Domain (RBD) and the human ACE2 receptor.
- Structure Preparation: The 3D structure of the Wild-Type (WT) RBD-ACE2 complex (e.g., PDB ID 6M0J) is obtained. Mutations (e.g., N501Y, Q498R) are introduced in silico using software like UCSF Chimera to create variant RBD models [65].
- System Solvation and Neutralization: The protein complex is placed in a water box (e.g., OPC model), and ions (e.g., Na+) are added to neutralize the system's charge [65].
- Energy Minimization and Equilibration: The system undergoes energy minimization to relieve steric clashes, followed by a gradual heating process to 298 K and an equilibration phase (e.g., 50 nanoseconds) to stabilize the system [65].
- Production Simulation: A long-scale (e.g., 500 ns to 1 μs) MD simulation is run to sample the conformational space of the complex [64] [65].
- Binding Free Energy Calculation: The Molecular Mechanics/Generalized Born Surface Area (MM/GBSA) method is applied to the simulation trajectory to estimate the binding free energy (ΔGbind). A more negative ΔGbind indicates stronger binding [64] [65].
Recombinant Virus Assay for Phenotypic Characterization
This approach isolates the effect of the spike protein by studying it in a common genetic background.
- Reverse Genetics: A panel of recombinant SARS-CoV-2 viruses is generated. Each virus carries the spike protein from a different variant (e.g., Delta, Omicron BA.1, XBB.1.5) within the identical genomic backbone of an ancestral strain (e.g., Wuhan-Hu-1) [66].
- Cell Culture Infection: These recombinant viruses are used to infect relevant cell lines, such as Calu-3 (human lung adenocarcinoma) or primary human airway epithelial cultures.
- Phenotypic Readouts:
- Replication Kinetics: Viral titers in the culture supernatant are quantified over time (e.g., via plaque assay or RT-qPCR) to generate a multi-cycle growth curve [66].
- Cell-Cell Fusion Assay: Cells expressing the variant spike protein are co-cultured with cells expressing ACE2 and TMPRSS2. Fusion is quantified using a reporter system, such as a split-GFP, whose fluorescence recovers upon cell fusion [66].
- Entry Pathway Determination: Cells are pre-treated with inhibitors targeting either the TMPRSS2 pathway (e.g., Camostat) or the endosomal/cathepsin pathway (e.g., E64d). The reduction in infectivity indicates the dependency on each pathway [66].
Signaling Pathways and Logical Workflows
The diagram below illustrates the core paradox and the divergent cellular entry pathways that help explain the differential phenotypes of Delta and Omicron.
The Scientist's Toolkit: Key Research Reagent Solutions
The following table details essential materials and reagents used in the experiments cited in this guide.
Table 3: Essential Research Reagents for SARS-CoV-2 Variant Characterization
| Research Reagent / Model | Function and Application | Specific Examples / Citations |
|---|---|---|
| Recombinant Viral Constructs | Isolates the effect of spike protein mutations by expressing variant spikes in a common genetic backbone, enabling fair phenotypic comparison. | Recombinant SARS-CoV-2 with Delta or Omicron spike in Wuhan-Hu-1 backbone [66]. |
| 3D Human Respiratory Models | Provides a physiologically relevant ex vivo system that recapitulates the human airway architecture, cell types, and polarity for studying tropism and infectivity. | Air-Liquid Interface (ALI) cultures of primary human bronchial epithelial cells; Precision-Cut Lung Slices (PCLS) [70]. |
| Specific Cell Lines | Used for specific aspects of viral phenotype. Calu-3 models lung epithelium with native ACE2/TMPRSS2. A549-ACE2-TMPRSS2 is engineered for fusion and entry assays. | Calu-3 (human lung adenocarcinoma) [66]; A549-ACE2-TMPRSS2 (engineered cell line) [66]. |
| Pathway-Specific Inhibitors | Pharmacological tools to delineate the viral entry pathway by selectively blocking key host proteases. | Camostat (TMPRSS2 inhibitor); E64d (Cathepsin inhibitor) [66]. |
| Therapeutic Monoclonal Antibodies | Probes for mapping the antigenic landscape and quantifying immune escape conferred by RBD mutations. | LY-CoV016, LY-CoV555, REGN10987, S309 [69]. |
| MD Simulation Software & Force Fields | Enables atomic-level analysis of the impact of mutations on protein structure, dynamics, and interaction energies with ACE2. | AMBER software with FF19SB force field [65]; MM/GBSA for binding free energy calculation [64] [65]. |
Advanced 3D respiratory models have become indispensable tools for elucidating the distinct pathogenic mechanisms of SARS-CoV-2 variants. This guide objectively compares the performance of 3D models in differentiating the infectivity and pathogenicity of the Delta and Omicron variants, focusing on core metrics of epithelial integrity and function. We summarize critical experimental data, detail essential methodologies, and catalog key reagents to provide a standardized framework for research and drug development.
Comparative Pathogenicity of Delta vs. Omicron in 3D Respiratory Models
Research utilizing highly differentiated human airway models consistently demonstrates that the Delta and Omicron variants of SARS-CoV-2 employ fundamentally different infection strategies, leading to stark contrasts in disease severity. These differences are quantifiable through specific biomarkers of epithelial damage and immune response.
Table 1: Quantitative Comparison of Delta and Omicron Pathogenicity in 3D Respiratory Epithelia
| Experimental Metric | Delta Variant (B.1.617.2) | Omicron Variant (e.g., BA.1, BA.5) | Biological Implication & Reference |
|---|---|---|---|
| Viral Load in Respiratory Tissue | High viral titers in lung-derived cell lines (Calu-3) and human airway epithelia (HAE) [71]. | Significantly lower replication in lung and gut cells; replication similar to Delta only in human nasal epithelial cultures (hNECs) [71]. | Suggests altered cellular tropism, with Omicron favoring the upper airways over the lower respiratory tract. |
| Tissue Penetration & Localization | Deep penetration through the entire pseudostratified epithelium to the basement membrane [46]. | Superficial, apical distribution; remains confined to the mucosal layer [46]. | Explains Omicron's reduced capacity to cause severe lower respiratory tract disease and viremia. |
| Epithelial Barrier Damage | Major tissue destruction; significant decrease in Transepithelial Electrical Resistance (TEER) [46] [72]. | Maintained epithelial integrity; minimal impact on TEER [46]. | Barrier integrity is a key determinant of disease severity; breach allows viral dissemination and secondary infections. |
| Cell Damage & Stress (LDH Release) | High LDH activity, indicating significant cellular cytotoxicity and necrosis [46]. | Low LDH activity, indicating minimal cellular damage [46]. | Directly correlates with the level of tissue damage and clinical severity observed in patients. |
| Innate Immune Activation (IL-6) | Pronounced secretion of pro-inflammatory cytokines (e.g., IL-6) at infection sites [46]. | Significantly lower release of IL-6 [46]. | A dysregulated hyperinflammatory response ("cytokine storm") is a hallmark of severe COVID-19 driven by variants like Delta. |
| Complement Activation (C3) | Large areas of intrinsic complement C3 activation within infected tissues [46]. | Significantly smaller areas of C3 deposition [46]. | Uncontrolled complement activation is linked to excessive inflammation and tissue injury in severe cases. |
Underlying Mechanisms: Viral Entry and Host Response
The differential pathogenicity observed in Table 1 stems from fundamental virological differences, primarily in how the variants utilize host cell entry mechanisms.
Altered Cellular Tropism via TMPRSS2 Usage
A pivotal discovery is that the Delta variant's spike protein is efficiently cleaved, allowing it to effectively use the cell-surface protease TMPRSS2 for entry via plasma membrane fusion. This pathway is abundant in lung-derived cells like Calu-3. In contrast, the Omicron spike protein is less efficiently cleaved and inefficiently uses TMPRSS2, shifting its entry to rely more on the endocytic pathway, which is less favorable in TMPRSS2-high lung cells but sufficient for nasal epithelial infection [71]. This tropism shift away from the lower respiratory tract is a major factor in Omicron's reduced pathogenicity.
Virally Induced Barrier Dysfunction Signaling
The SARS-CoV-2 envelope (E) protein itself plays a critical role in disrupting epithelial barrier function, a process more pronounced in highly pathogenic variants. The E protein can trigger a pro-inflammatory signaling cascade that leads to tight junction damage [73].
Diagram: SARS-CoV-2 E Protein-Induced Barrier Dysfunction Pathway
Essential Experimental Protocols for 3D Model Analysis
To generate the comparative data outlined, specific, reproducible protocols are required. Below are the core methodologies for infecting 3D models and assessing key quality control metrics.
Protocol 1: Infection of Human Airway Epithelia (HAE) Models
This protocol outlines the infection of fully differentiated, pseudostratified human airway epithelial cultures, a gold-standard model for respiratory research [46] [71].
- Model Preparation: Use fully differentiated HAE cultures grown at an air-liquid interface (ALI) for at least four weeks to ensure mature, ciliated, and mucociliary epithelium. Normal Human Bronchial Epithelial (NHBE) cells are a common cell source.
- Virus Inoculation: Apply a standardized infectious dose (e.g., Multiplicity of Infection (MOI) of 0.0025-0.01) of the SARS-CoV-2 variant in a small volume to the apical surface of the HAE cultures.
- Incubation: Incubate the inoculated cultures for 1-2 hours at 37°C/5% CO₂ to allow for viral adsorption.
- Sample Collection:
- Apical Washes: At designated time points (e.g., 24, 48, 72 hours post-infection), wash the apical surface with a suitable buffer to collect released viral particles.
- Tissue Harvesting: For viral load and histology, the epithelial layers can be lysed for RNA/protein analysis or fixed for imaging.
Protocol 2: Key Metrics for Epithelial Integrity and Function
The following assays are performed on the infected HAE models to quantify pathogenicity.
Table 2: Core Quality Control Assays for 3D Respiratory Model Analysis
| Assay | Function Measured | Detailed Methodology | Application in Variant Comparison |
|---|---|---|---|
| Transepithelial Electrical Resistance (TEER) | Real-time, non-invasive measurement of epithelial barrier integrity. | Measure electrical resistance across the epithelial layer using volt-ohm-meter with chopstick electrodes. Values are reported in Ω×cm² after correcting for surface area [46] [73]. | A significant drop in TEER indicates barrier disruption, a hallmark of Delta infection, whereas Omicron typically causes minimal change [46]. |
| Lactate Dehydrogenase (LDH) Release | Quantification of cellular cytotoxicity and irreversible cell damage. | Measure the activity of the cytosolic enzyme LDH in the basolateral culture medium using a colorimetric or fluorescent assay. Damaged cells release LDH into the supernatant [46]. | High LDH in Delta-infected models indicates major tissue destruction, while low LDH with Omicron confirms its limited cytopathicity [46]. |
| Plaque Assay / TCID₅₀ | Titration of infectious virus particles released from the epithelium. | Inoculate serial dilutions of apical washes onto permissive cell lines (e.g., Vero E6/TMPRSS2/ACE2). Count plaques or use immunofluorescence to calculate the 50% tissue culture infectious dose (TCID₅₀) [74] [46]. | Directly compares the replicative capacity and infectious viral shedding of different variants from the respiratory epithelium [74]. |
| Immunofluorescence (IF) & 3D Imaging | Spatial visualization of viral infection, tissue architecture, and innate immune markers. | Fix HAE cultures, stain with antibodies against SARS-CoV-2 (e.g., Nucleocapsid protein), tight junctions (e.g., ZO-1), and complement (C3). Image using high-content confocal microscopy and 3D reconstruction [46]. | Reveals the stark contrast in tissue penetration (deep vs. superficial) and level of innate immune activation between Delta and Omicron [46]. |
Diagram: Workflow for 3D Respiratory Model Infection and Quality Control Analysis
The Scientist's Toolkit: Essential Research Reagents and Models
Successful differentiation and analysis of 3D respiratory models require specific biological and technical components.
Table 3: Essential Research Reagents for 3D Respiratory Model Studies
| Reagent / Model | Function / Description | Example Use Case |
|---|---|---|
| Normal Human Bronchial Epithelial (NHBE) Cells | Primary cells capable of forming fully differentiated, pseudostratified mucociliary epithelium at ALI. | Serves as the primary cellular component for building physiologically relevant human airway models for infection studies [46]. |
| MucilAir or Similar Commercial HAE | Ready-to-use, highly differentiated human nasal or bronchial epithelial models available commercially. | Provides a standardized, reproducible platform for consistent evaluation of viral infectivity and drug efficacy across labs [75]. |
| Calu-3 Lung Epithelial Cell Line | A human lung adenocarcinoma cell line that expresses endogenous TMPRSS2 and can polarize. | Used to model infection in the lower respiratory tract and to demonstrate Delta's enhanced replication in TMPRSS2+ cells compared to Omicron [71]. |
| Vero E6 / TMPRSS2 / ACE2 Cells | An engineered, highly permissive monkey kidney cell line expressing human ACE2 and TMPRSS2. | Critical for propagating clinical SARS-CoV-2 isolates and performing plaque assays to titrate infectious virus from experimental samples [46] [75]. |
| Anti-SARS-CoV-2 Nucleocapsid Antibody | Antibody for detecting intracellular virus in infected tissues via immunofluorescence or Western blot. | Used to visualize and quantify the number and distribution of infected cells within the 3D epithelial model [46]. |
| Anti-Tight Junction Protein Antibodies (e.g., ZO-1, Occludin) | Antibodies for staining intercellular junctions to assess epithelial barrier structure. | Visualizing the disruption of the epithelial barrier caused by pathogenic viral proteins or active infection [73]. |
Cross-Validation of 3D Model Findings with Animal Studies and Clinical Observations
The emergence of Severe Acute Respiratory Syndrome Coronavirus 2 (SARS-CoV-2) variants of concern (VOCs), particularly Delta and Omicron, necessitated robust animal models to elucidate their distinct pathogenic profiles and accelerate the development of countermeasures. While the virus exhibits a broad host range, feline models (including domestic cats and wild felids) and K18-hACE2 transgenic mice have been extensively utilized to model human COVID-19 pathogenesis, vaccine efficacy, and therapeutic interventions [76] [77]. These models are pivotal for dissecting the mechanisms underlying the differential virulence observed with the Delta variant, which is associated with more severe disease, and the Omicron variant, characterized by heightened transmissibility but often attenuated pathogenicity [78]. This guide provides a structured comparison of these two animal models, focusing on their application in studying Delta and Omicron VOC pathogenicity within the respiratory tract. We synthesize experimental data, detail standardized protocols, and outline essential research tools to inform model selection and experimental design for researchers and drug development professionals.
Comparative Model Pathogenesis and Experimental Data
The K18-hACE2 mouse model and feline models both support SARS-CoV-2 replication but demonstrate distinct pathological features and disease severity in response to different VOCs. Quantitative data from key studies are summarized in Table 1, and a comparative overview of their pathogenic profiles is illustrated in Figure 1.
Table 1: Summary of Quantitative Pathogenicity Data in K18-hACE2 Mouse and Feline Models
| Animal Model / Parameter | Ancestral/Wuhan-like Strains | Delta Variant (B.1.617.2) | Omicron Variant (B.1.1.529) | Citations |
|---|---|---|---|---|
| K18-hACE2 Mouse | ||||
Weight Loss (%) |
~20-25% | Severe (≥20%) | Mild to Moderate | [79] [80] |
Mortality Rate |
High, dose-dependent | High | Reduced compared to Delta | [79] |
Lung Viral Titer (TCID50/g or p.f.u.) |
~10⁵-10⁷ (peak) | High (similar to ancestral) | Significantly lower | [79] [81] |
Brain Viral Titer |
Detected in a subset of animals | Reported | Reduced/Not Detected | [79] [80] |
Histopathological Score (Lungs) |
Severe interstitial pneumonia | Severe interstitial pneumonia | Mild pathology | [79] [81] |
| Feline (Domestic Cat) | ||||
Upper Resp. Viral Shedding |
High | High | High (potentially higher) | [76] |
Lung Viral Titer |
Moderate | Data limited, expected high | Data limited, expected low | [76] [77] |
Clinical Severity |
Mild or asymptomatic | Mild or asymptomatic | Mild or asymptomatic | [76] |
Histopathological Score (Lungs) |
Mild to moderate pneumonia | Data limited | Data limited | [76] [77] |
Figure 1: Comparative pathogenic profiles of K18-hACE2 mouse and feline models upon infection with SARS-CoV-2 variants.
K18-hACE2 Mouse Model Pathogenesis
The K18-hACE2 transgenic mouse model expresses the human angiotensin-converting enzyme 2 (hACE2) under the control of the cytokeratin-18 (K18) promoter, primarily targeting epithelial cells [79] [80]. This model is characterized by its susceptibility to severe and lethal infection with ancestral and Delta variants, making it a cornerstone for studying severe COVID-19.
- Disease Manifestation: Intranasal inoculation leads to rapid weight loss starting around day 2-4 post-infection (dpi), with uniform lethality observed at higher doses (e.g., 10⁵ TCID₅₀) by 7 dpi [79]. Clinical signs include lethargy, ruffled fur, hunched posture, and labored breathing.
- Viral Replication and Shedding: High levels of viral RNA (up to 10⁷ copies/mL) are shed from the respiratory tract (nasal and oropharyngeal swabs). The lungs are the primary site of replication, with peak titers reaching ~10¹⁰ genome copies/gram and high infectious virus titers [79] [80]. Intermittent rectal shedding is also observed.
- Pathology: The model consistently develops severe interstitial pneumonia, with histopathological findings including alveolar septal thickening, immune cell infiltration (macrophages, lymphocytes, neutrophils), type II pneumocyte hyperplasia, and pulmonary edema [79] [80]. Immunohistochemistry confirms viral antigen in pneumocytes.
- Extrapulmonary Spread: A key feature of this model is the detection of infectious virus and viral RNA in the brain at 7 dpi, indicating neuroinvasion, which is thought to contribute to the lethal outcome in some animals [79] [80].
- Response to VOCs: The Omicron variant demonstrates attenuated pathogenicity in this model. Studies show significantly less weight loss, improved survival, reduced viral loads in the lungs, and markedly milder pulmonary pathology compared to the Delta variant [81] [78].
Feline Model Pathogenesis
Cats are naturally susceptible to SARS-CoV-2 infection as the feline ACE2 receptor supports viral entry, making them a relevant model for natural infection and transmission dynamics [76] [77].
- Disease Manifestation: Infections in cats are typically mild or asymptomatic, even with variants like Delta. Overt clinical signs are rare, though some studies may report subtle changes [76].
- Viral Replication and Shedding: Despite mild disease, infected cats efficiently replicate the virus in the upper respiratory tract and shed high viral loads from the nose and mouth, facilitating onward transmission to other cats and potentially humans [76].
- Pathology: Experimental infection can lead to mild to moderate pulmonary lesions, such as multifocal peribronchiolar lymphoplasmacytic infiltration and alveolar edema, but these are generally less severe than the diffuse alveolar damage seen in severe human cases and in K18-hACE2 mice [77].
- Response to VOCs: While direct comparative data for Delta and Omicron in felines from the provided search results is less extensive than for murine models, the natural history of infection in cats suggests that all VOCs, including Omicron, maintain high replicative fitness in the upper airways, consistent with their high transmissibility [76].
Detailed Experimental Protocols
To ensure reproducibility and facilitate comparative analysis, this section outlines standardized protocols for pathogenicity studies in both models.
K18-hACE2 Mouse Inoculation and Sampling Protocol
Objective: To assess the pathogenicity, viral kinetics, and immune response to SARS-CoV-2 VOCs in the K18-hACE2 transgenic mouse model.
Workflow Diagram:
Figure 2: Standardized experimental workflow for SARS-CoV-2 pathogenicity studies in K18-hACE2 mice.
Key Steps:
- Virus Preparation: Propagate SARS-CoV-2 VOCs (e.g., Delta B.1.617.2, Omicron BA.1) in VeroE6/TMPRSS2 cells. Aliquot and titer stocks (e.g., by plaque assay or TCID₅₀) [79] [78].
- Animal Inoculation: Anesthetize 6-8 week-old heterozygous K18-hACE2 mice. Administer the virus intranasally (e.g., 10⁴ to 10⁵ TCID₅₀ in 50 μL of DMEM) [79] [80]. A control group should receive sterile medium or inactivated virus.
- Clinical Monitoring: Weigh mice and record clinical signs (lethargy, posture, fur ruffling) daily. Score disease severity using an approved scale.
- Sample Collection:
- Longitudinal: Collect nasal, oropharyngeal, and rectal swabs daily to profile viral shedding kinetics via qRT-PCR [79].
- Terminal: At predetermined endpoints (e.g., 3, 5, 7 dpi), euthanize mice. Aseptically collect tissues: nasal turbinates, trachea, lungs (multiple lobes), brain (olfactory bulb, cortex, hippocampus), and other organs (heart, kidney, spleen) [79] [80].
- Downstream Analysis:
- Virology: Homogenize tissues. Determine viral RNA load by qRT-PCR targeting the N or E gene. Quantify infectious virus titers by plaque assay or TCID₅₀ on permissive cells [79] [81].
- Histopathology: Inflate and fix lungs in 10% neutral buffered formalin. Process, embed in paraffin, section, and stain with Hematoxylin and Eosin (H&E). Score lesions semi-quantitatively (e.g., 0-4 for inflammation, edema, hyperplasia) [79] [80].
- Immunohistochemistry (IHC): Stain tissue sections with antibodies against SARS-CoV-2 nucleocapsid (N) or spike protein to visualize viral antigen distribution [79] [80].
- Immunology: Analyze cytokine/chemokine levels in lung homogenates using multiplex immunoassays (e.g., Luminex) or ELISA. Profile immune cell populations in lungs by flow cytometry [80].
Feline Inoculation and Sampling Protocol
Objective: To evaluate susceptibility, viral shedding, and transmission potential of SARS-CoV-2 VOCs in a natural host model.
Workflow Diagram:
Figure 3: Standardized experimental workflow for SARS-CoV-2 susceptibility and transmission studies in feline models.
Key Steps:
- Virus and Animals: Use specific-pathogen-free domestic cats. House in ABSL-3 facilities. Inoculate with SARS-CoV-2 VOCs (e.g., 10⁵-10⁶ TCID₅₀) via intranasal, oral, or aerosol routes [76] [77].
- Clinical Monitoring: Observe cats daily for signs of respiratory illness (sneezing, coughing), ocular discharge, lethargy, or inappetence.
- Viral Shedding and Transmission:
- Collect nasal, oral, and rectal swabs daily. Extract RNA and quantify by qRT-PCR to establish shedding kinetics and duration [76].
- To assess transmission, place naive sentinel cats in direct contact or adjacent cages with inoculated animals 24 hours post-inoculation. Monitor sentinels for viral shedding and seroconversion [76].
- Necropsy and Sampling: At the end of the study (e.g., 7-21 dpi), perform a full necropsy. Collect tissues from the nasal turbinates, trachea, lungs (all lobes), tonsil, and other major organs.
- Downstream Analysis:
- Virology: Quantify viral RNA and infectious virus in tissue homogenates and swabs [77].
- Serology: Test serum samples for virus-specific neutralizing antibodies using virus neutralization tests (VNT) or ELISA [76].
- Histopathology: Process and examine respiratory tissues with H&E and IHC, as described for the mouse model [77].
The Scientist's Toolkit: Essential Research Reagents and Models
Table 2: Key Research Reagent Solutions for SARS-CoV-2 Animal Model Studies
| Reagent / Model | Function / Application | Specific Examples & Notes |
|---|---|---|
| K18-hACE2 Transgenic Mouse | A model for severe COVID-19; expresses human ACE2 in epithelial, enabling viral entry and causing lethal infection. | C57BL/6J background; available from Jackson Laboratory (Stock No. 034860). Ideal for testing antivirals and vaccines against severe disease [79] [80]. |
| VeroE6/TMPRSS2 Cells | A mammalian cell line optimized for efficient isolation and propagation of SARS-CoV-2 variants, including Omicron. | Used for virus stock preparation, plaque assays, and TCID₅₀ titrations to quantify infectious virus from animal samples [78]. |
| SARS-CoV-2 Specific Antibodies | Detection of viral antigens in infected tissues via immunohistochemistry (IHC) and immunofluorescence (IFA). | Anti-SARS-CoV-2 Nucleocapsid (N) protein antibody is commonly used for IHC on formalin-fixed lung sections [79] [78]. |
| qRT-PCR Assays | Quantitative measurement of viral RNA load in swabs, tissues, and cell culture supernatants. | Targets include viral genes N, E, and RdRp. Essential for determining viral replication kinetics and shedding [79] [81]. |
| Plaque Assay / TCID₅₀ | Gold-standard methods for quantifying infectious virus titers in samples. | Performed on confluent VeroE6/TMPRSS2 cells under overlay medium; requires BSL-3 containment [79] [78]. |
| Cytokine/Chemokine Panels | Profiling of host immune responses in infected tissues (e.g., lung homogenates) via multiplex immunoassays. | Panels measuring pro-inflammatory cytokines (e.g., IL-6, TNF-α) and chemokines (e.g., MCP-1, CXCL10) to characterize the "cytokine storm" [80]. |
The K18-hACE2 mouse and feline models offer complementary strengths for SARS-CoV-2 VOC research. The K18-hACE2 model is unparalleled for modeling severe human disease and lethal outcomes, particularly with the Delta variant. Its robust and reproducible pathology, coupled with the vast array of murine-specific reagents, makes it ideal for the pre-clinical evaluation of antivirals and immunomodulators aimed at preventing severe COVID-19 [79] [80]. In contrast, the feline model excels in modeling upper respiratory tract infection, viral shedding, and natural transmission dynamics, aspects that are highly relevant to the public health challenge of controlling spread, especially with highly transmissible variants like Omicron [76].
The concordance between these models and human disease is variant-dependent. Both models correctly recapitulate the attenuated lower respiratory pathology of Omicron compared to Delta, a key observation in clinical settings [81] [78]. However, the profound neuroinvasion seen in the K18-hACE2 model is not a common feature of human COVID-19, highlighting a limitation of this transgenic system that may be related to the K18 promoter-driven overexpression of hACE2 [80]. Newer models, such as knock-in mice where hACE2 expression is under the control of its native promoter, are being developed to better mirror human receptor distribution and may provide a more nuanced view of pathogenesis, particularly for long-term sequelae [82] [83].
In conclusion, the selection between the K18-hACE2 mouse and feline models should be guided by the specific research question. For studies of pathogenesis and medical countermeasures against severe pneumonia, the K18-hACE2 mouse is superior. For investigations into transmission chains, asymptomatic infection, and population-level spread, the feline model provides critical insights. A combined approach, leveraging both models, will provide the most comprehensive understanding of the evolving threat posed by SARS-CoV-2 variants.
The successive waves of SARS-CoV-2 variants, particularly Delta and Omicron, provided a natural experiment for investigating the correlation between in vitro cytopathic effects and clinical disease severity. This review synthesizes evidence from advanced 3D respiratory models including air-liquid interface (ALI) cultures, lung organoids, and organs-on-chips, demonstrating how variant-specific pathogenicity mechanisms observed in vitro correspond to distinct clinical manifestations. Data from these models reveal that the Delta variant induces substantial cytopathic effects including syncytia formation, barrier integrity disruption, and pronounced inflammatory responses, mirroring its association with severe pulmonary disease. In contrast, Omicron variants exhibit preferential upper respiratory tract tropism with reduced lung pathology, aligning with their clinical presentation of milder disease. These findings establish 3D respiratory models as predictive platforms for assessing variant pathogenicity and therapeutic efficacy, providing crucial insights for public health preparedness and drug development strategies.
The emergence of SARS-CoV-2 variants of concern (VOCs) throughout the COVID-19 pandemic created distinct waves of infection with varying clinical severity. The Delta variant (B.1.617.2), associated with more severe pulmonary disease and increased hospitalization rates, was subsequently displaced by the Omicron variant (B.1.1.529) and its sublineages, which demonstrated markedly different clinical manifestations characterized by enhanced transmissibility yet reduced severity, particularly in the lower respiratory tract [38] [84]. This epidemiological shift presented a critical opportunity to investigate whether in vitro cytopathic effects could reliably predict clinical disease patterns.
Advanced 3D respiratory models have emerged as indispensable tools for characterizing viral pathogenicity mechanisms, bridging the gap between conventional cell lines and in vivo observations. These sophisticated experimental platforms recapitulate key aspects of human respiratory physiology, enabling detailed investigation of viral tropism, host responses, and cellular damage patterns. By comparing the effects of Delta and Omicron variants in these systems, researchers have identified fundamental differences in viral entry pathways, tissue tropism, and cytopathogenicity that correlate with their distinct clinical impacts [38] [25] [85].
Variant-Specific Pathogenicity in Experimental Models
Comparative Pathogenicity of SARS-CoV-2 Variants
Table 1: Comparative Pathogenicity of SARS-CoV-2 Variants in Experimental Models
| Variant | Clinical Disease Severity | In Vitro Replication Efficiency | Primary Entry Pathway | Key Cytopathic Effects In Vitro |
|---|---|---|---|---|
| Delta | Increased severity, pneumonia, hospitalization [38] | High in both upper and lower respiratory models [38] | TMPRSS2-dependent, plasma membrane fusion [85] | Syncytia formation, barrier integrity disruption, substantial cell death [38] |
| Omicron | Reduced severity, predominantly upper respiratory symptoms [38] [43] | Enhanced in upper respiratory tract; attenuated in lung models [38] [43] | TMPRSS2-independent, endosomal entry [85] | Minimal syncytia, reduced epithelial damage, preserved barrier function [38] |
| Ancestral (WH-09) | Moderate to severe disease [32] | Moderate in respiratory models [32] | TMPRSS2-dependent [86] | Intermediate pathology between Delta and Omicron [32] |
Differential Cellular Entry Mechanisms
The fundamental differences in pathogenicity between Delta and Omicron variants originate from their distinct cellular entry mechanisms, which dictate tissue tropism and subsequent cytopathic effects:
The Delta variant predominantly utilizes the TMPRSS2 protease for spike protein priming, facilitating direct plasma membrane fusion and entry into cells expressing high TMPRSS2 levels, particularly in the lung epithelium. This entry pathway enables efficient replication in the lower respiratory tract and promotes cell-cell fusion, leading to syncytia formation and extensive tissue damage [85]. In contrast, the Omicron variant favors a TMPRSS2-independent, endosomal entry pathway mediated by cathepsins, resulting in preferential infection of upper respiratory tissues with lower TMPRSS2 expression and reduced fusion capacity, thereby explaining its attenuated lung pathology [85].
3D Respiratory Models for Pathogenicity Assessment
Advanced Experimental Platforms
Table 2: 3D Respiratory Models for SARS-CoV-2 Research
| Model Type | Key Components | Advantages | Applications in VOC Research |
|---|---|---|---|
| Air-Liquid Interface (ALI) Cultures | Primary nasal or bronchial epithelial cells differentiated at air-liquid interface [38] [25] | Recapitulates mucociliary differentiation, polarized infection, innate immune responses | Variant-specific replication kinetics, ciliary function assessment, cytokine production [38] |
| Lung Organoids | Self-organizing 3D structures containing multiple lung cell types [25] | Models cellular complexity, stem cell function, regeneration capacity | Viral tropism studies, drug screening, host-pathogen interactions [25] |
| Organs-on-Chips | Microfluidic devices with epithelial and endothelial compartments, mechanical stretching [25] | Incorporates fluid flow, mechanical forces, vascular perfusion, immune cell recruitment | Barrier function assessment, viral dissemination, neutrophil migration studies [25] |
| 3D Bioprinted Airway Models | Structured constructs with epithelium, extracellular matrix, and endothelium [26] | Precise spatial control, reproducible architecture, dual exposure capability | Antiviral drug penetration studies, long-term infection modeling [26] |
Experimental Workflow for Variant Characterization
Detailed Methodologies for Key Assays
Viral Replication Kinetics in ALI Cultures
Primary human nasal epithelial cells are cultured on transwell inserts until full differentiation (typically 4-6 weeks), confirmed by cilia formation and mucin production. Cultures are infected apically with standardized inoculums (MOI=0.1) of respective variants. At designated time points (0, 24, 48, 72, 96 hours post-infection), apical washes are collected with minimal essential medium, while basolateral samples are collected from the lower chamber. Viral titers are quantified by plaque assay on Vero E6-TMPRSS2 cells and genomic copies measured by RT-qPCR targeting the E gene [38]. Omicron variants demonstrate significantly faster replication in nasal ALI cultures compared to Delta, with 1.5-log higher genome copies at 24 hours post-infection, correlating with their enhanced transmissibility [43].
Barrier Integrity Assessment
Transepithelial electrical resistance (TEER) is measured using an epithelial voltohmmeter at regular intervals post-infection. Parallel inserts are fixed for immunostaining of tight junction proteins (ZO-1, occludin) and F-actin to visualize structural integrity. Delta infection causes significant TEER reduction (>70% by 48 hours) and discontinuous tight junction staining, while Omicron-infected cultures maintain near-normal resistance and junctional organization [38].
Histopathological Analysis
Infected 3D models are fixed in 4% paraformaldehyde, embedded in paraffin, and sectioned for hematoxylin and eosin staining. Pathological scoring systems evaluate features including epithelial layer disorganization, immune cell infiltration, hyaline membrane formation, and syncytia. Delta variant infection produces moderate to severe pathological changes with prominent immune cell infiltration and consolidation, while Omicron causes minimal alterations [32] [86].
The Scientist's Toolkit: Essential Research Reagents
Table 3: Key Research Reagents for SARS-CoV-2 Variant Studies
| Reagent Category | Specific Examples | Application in VOC Research |
|---|---|---|
| Cell Culture Systems | Primary human nasal epithelial cells (ALI), Calu-3 lung epithelial cells, Vero E6-TMPRSS2, Primary cytotrophoblast cells [38] [16] | Variant replication kinetics, tissue tropism studies, plaque assays |
| Viral Entry Reagents | Recombinant human ACE2, TMPRSS2 inhibitors (camostat), endosomal acidification inhibitors (chloroquine) [85] | Entry pathway characterization, mechanism of action studies |
| Detection Antibodies | Anti-spike protein antibodies, anti-nucleocapsid antibodies, anti-ZO-1 tight junction protein [86] [26] | Immunofluorescence, immunohistochemistry, western blot |
| Cytokine/Chemokine Assays | Multiplex ELISA panels (IL-6, IL-8, IFN-λ, IP-10) [32] [38] | Host immune response profiling, inflammation assessment |
| Molecular Biology Kits | RNA extraction kits, RT-qPCR master mixes, SARS-CoV-2 specific primers/probes [32] [43] | Viral load quantification, host gene expression analysis |
Metabolic and Signaling Pathway Alterations
Beyond structural damage, SARS-CoV-2 variants induce distinct metabolic and immune response profiles that correlate with disease severity. Plasma metabolomic analysis of patients infected with Delta versus Omicron variants reveals significant differences in specific metabolites including tyrosine, asparagine, leucine, and acylcarnitines (C3, C4, C5), with Delta infections showing stronger association with severe outcomes [48]. In 3D models, Delta infection triggers robust proinflammatory cytokine production (IL-6, IP-10) and chemokine release, resulting in substantial macrophage and neutrophil infiltration [32]. Conversely, Omicron infection induces higher type I and III interferon responses with reduced inflammatory cytokine production, facilitating viral control with minimized tissue damage [38].
Discussion and Future Directions
The comprehensive analysis of Delta and Omicron variants in 3D respiratory models demonstrates a strong correlation between in vitro cytopathic effects and clinical disease severity. The enhanced syncytia formation, barrier disruption, and inflammatory responses induced by Delta mirror its association with severe pneumonia, while Omicron's preferential upper respiratory tropism and reduced cytopathogenicity align with its milder clinical presentation. These findings validate 3D models as predictive platforms for assessing emerging variant threat levels and therapeutic efficacy.
Future research should focus on developing more complex multi-tissue models incorporating immune components and vascularization to better recapitulate systemic viral effects. Additionally, standardization of readout parameters across laboratories will facilitate more direct comparisons and meta-analyses. As SARS-CoV-2 continues to evolve, these advanced experimental systems will be crucial for rapid characterization of novel variants and guiding public health responses, ultimately enhancing pandemic preparedness.
The emergence of severe acute respiratory syndrome coronavirus 2 (SARS-CoV-2) variants of concern (VOCs), particularly Delta and Omicron, has highlighted the critical need to understand variant-specific pathogenesis and immune activation patterns. Innate immune responses form the first line of defense against viral infection, and their activation profiles significantly influence disease severity and outcomes. This review systematically compares cytokine response patterns between advanced 3D respiratory models and patient data, focusing on Delta and Omicron infections. By evaluating the fidelity of microphysiological systems in recapitulating human immune responses, we aim to validate these models as predictive platforms for investigating viral pathogenicity and screening therapeutic interventions.
Comparative Pathogenicity of SARS-CoV-2 Variants
Variant-Specific Clinical Severity and Viral Dynamics
Epidemiological and clinical studies have established clear differences in pathogenicity between SARS-CoV-2 VOCs. The Delta variant (B.1.617.2) is associated with more severe pulmonary disease, while the Omicron variant (B.1.1.529) demonstrates reduced severity but enhanced transmissibility [15] [38]. These clinical observations are supported by robust experimental data from multiple model systems.
Table 1: Comparative Pathogenicity of SARS-CoV-2 Variants in Experimental Models
| Parameter | Delta Variant | Omicron Variant | Experimental Model |
|---|---|---|---|
| In vivo pathogenicity | High | Moderate/Low | Hamster model [15] |
| Lung damage | Severe immune cell infiltration | Reduced pathology | Hamster model [17] |
| Viral fusogenicity | High | Low (BA.1/BA.2), Moderate (BA.5) | VeroE6/TMPRSS2 cells [15] |
| Epithelial/endothelial barrier disruption | Severe | Moderate (BA.5 > BA.1/BA.2) | Airway-on-a-chip [15] |
| Replication in upper airways | High | Very high (early time points) | Primary nasal cultures [38] |
| Replication in lower airways | High | Reduced | Calu-3 lung cell line [38] |
| Interferon response induction | Moderate | Strong | Primary nasal cultures [38] |
Notably, Omicron subvariants have evolved distinct pathogenic characteristics. While early Omicron subvariants (BA.1, BA.2) exhibited reduced fusogenicity and pathogenicity compared to Delta, the BA.5 subvariant demonstrated intermediate features with enhanced fusogenicity and barrier disruption capacity compared to its predecessors [15]. This illustrates the continuing evolution of SARS-CoV-2 pathogenicity determinants.
Host Entry Mechanisms and Viral Spread
Variations in pathogenicity between VOCs are partially attributable to differences in viral entry mechanisms. While most VOCs primarily enter cells through the TMPRSS2-dependent pathway, Omicron shows increased utilization of endosomal entry routes [38]. Additionally, the efficiency of spike protein cleavage at the furin recognition site influences cell-to-cell spread, with Delta exhibiting enhanced cleavage efficiency compared to Omicron variants [38].
3D Respiratory Models for Viral Pathogenesis Studies
Model Systems and Methodologies
Advanced microphysiological systems (MPS) have emerged as powerful tools for modeling respiratory infections with high physiological relevance. These platforms bridge the gap between conventional cell cultures and in vivo models, providing human-relevant data on host-pathogen interactions.
Table 2: 3D Respiratory Model Systems for Innate Immunity Studies
| Model Type | Key Components | Applications in SARS-CoV-2 Research | References |
|---|---|---|---|
| Airway-on-a-chip | Respiratory epithelial + endothelial cells | Barrier integrity assessment, viral transmigration | [15] |
| Primary nasal cultures at ALI | Patient-derived nasal epithelial cells | Viral replication kinetics, innate immune responses | [38] |
| Lung-on-a-chip | Alveolar epithelial + microvascular endothelial cells | Modeling lower respiratory infection, immune cell recruitment | [87] |
| iPS cell-derived alveolar cells | Induced pluripotent stem cell-derived alveolar type II cells | Viral replication studies, surfactant production | [15] |
Primary nasal cultures grown at air-liquid interface (ALI) recapitulate the pseudostratified mucociliary epithelium of the human upper airway. The standard protocol involves:
- Cell isolation: Epithelial cells obtained from patient nasal brushings or surgical specimens
- ALI differentiation: Cells cultured on permeable transwell filters with specialized media for 4-6 weeks to establish mature epithelium with functional cilia and mucus production
- Viral infection: Infection with SARS-CoV-2 VOCs at low multiplicity of infection (MOI=0.1)
- Sample collection: Collection of apical washes and basolateral media at specified time points for viral titration and cytokine analysis
- Immunofluorescence: Processing of fixed membranes for immunohistochemical analysis of viral antigens and cellular markers [38]
Airway-on-a-chip models incorporate fluid flow and mechanical stretch to better mimic the in vivo microenvironment. The methodology typically includes:
- Device fabrication: Creation of microfluidic devices with parallel channels separated by a porous membrane
- Cell seeding: Epithelial cells in the upper channel and endothelial cells in the lower channel
- Culture conditions: Application of air-liquid interface in epithelial channel and medium flow in endothelial channel
- Infection studies: Introduction of SARS-CoV-2 to the epithelial channel
- Analysis: Measurement of viral transit to the vascular channel, transepithelial electrical resistance (TEER), and cytokine production in both compartments [15] [87]
3D Model Validation Against Clinical Data
The physiological relevance of 3D respiratory models is confirmed through direct comparison with patient data. In a comprehensive systems immunology study, multi-omics profiling of immune responses to COVID-19 vaccination and infection revealed distinct innate immune activation patterns that could be modeled in vitro [88]. Additionally, single-cell transcriptomic analyses of cytokine responses in primary human cells provide a reference framework for validating model systems [89].
Innate Immune Activation Profiles
Cytokine and Chemokine Response Patterns
SARS-CoV-2 infection triggers complex innate immune activation characterized by variant-specific cytokine signatures. Comparative studies of VOC infections in primary nasal cultures and patient samples have revealed distinct immune response patterns.
Innate Immune Signaling Pathway Activation During SARS-CoV-2 Infection
In airway-on-a-chip models, Delta infection induced more substantial barrier disruption and production of pro-inflammatory cytokines compared to Omicron variants [15]. This correlates with the increased disease severity observed in Delta-infected patients. The BA.5 subvariant, however, demonstrated enhanced ability to disrupt respiratory epithelial and endothelial barriers compared to earlier Omicron subvariants, though not reaching the level of disruption caused by Delta [15].
Analysis of patient samples has identified specific cytokine signatures associated with severe disease. A study comparing general and severe Mycoplasma pneumoniae pneumonia (GMPP vs. SMPP) revealed that severe disease correlates with elevated levels of 13 cytokines including IL-2, IL-10, IL-11, IL-12, IL-20, IL-28A, IL-32, IL-35, IFN-α2, IFN-γ, IFN-β, BAFF, and TSLP [90]. Similar patterns are likely operative in severe SARS-CoV-2 infections, though variant-specific differences exist.
Interferon and Antiviral Response Dynamics
The interferon (IFN) response represents a critical component of innate antiviral defense. Comparative infections in primary nasal cultures revealed that all SARS-CoV-2 VOCs activate and overcome double-stranded RNA-induced cellular responses, including IFN signaling, oligoadenylate ribonuclease L degradation, and protein kinase R activation [38]. However, the magnitude and composition of IFN responses differ between variants.
Notably, Omicron infection induces stronger expression of IFN and IFN-stimulated genes (ISGs) compared to Delta and other VOCs [38]. This robust IFN response may contribute to the accelerated clearance and reduced severity of Omicron infections. The heightened IFN response to Omicron has been observed in both 3D models and patient-derived samples, demonstrating the physiological relevance of these model systems.
Experimental Protocols for Immune Profiling
Methodologies for Cytokine Response Analysis
Standardized protocols enable consistent profiling of innate immune responses across different experimental platforms:
Sample Processing for Cytokine Analysis:
- Sample collection: Serum, bronchoalveolar lavage fluid (BALF), or basolateral media from infected cultures
- Storage: Immediate freezing at -80°C after centrifugation to preserve cytokine stability
- Multiplex immunoassay: Utilization of validated cytokine detection kits (e.g., Bio-Plex Pro Human Inflammation Panel)
- Instrument analysis: Measurement using multiplex analyzers (e.g., Luminex 200) with quality controls and standards in duplicate
- Data processing: Calculation of cytokine concentrations from standard curves with appropriate dilution factors [90]
Single-Cell RNA Sequencing for Immune Profiling:
- Cell isolation: Dissociation of infected tissues or models into single-cell suspensions
- Cell viability assessment: Exclusion of dead cells using fluorescence-activated cell sorting (FACS)
- Library preparation: Utilization of droplet-based systems (e.g., 10x Genomics)
- Sequencing: High-depth sequencing on Illumina platforms
- Bioinformatic analysis: Cell clustering, differential gene expression, and pathway analysis [89]
Validation in Model Systems
To ensure physiological relevance, immune activation in 3D models must be validated against primary human data:
Immunophenotyping Validation:
- Flow cytometry: Surface and intracellular staining for immune cell markers
- Activation-induced marker (AIM) assays: Detection of antigen-specific T cells
- ELISpot assays: Measurement of antigen-specific cytokine secretion
- Comparison to human samples: Parallel analysis of patient-derived peripheral blood mononuclear cells (PBMCs) or tissue specimens [88]
Functional Assays:
- Neutralization tests: Plaque reduction neutralization tests (PRNT) for antiviral antibody responses
- Phagocytosis assays: Measurement of macrophage and neutrophil function
- Barrier integrity assessments: Transepithelial electrical resistance (TEER) measurements
- Ciliary function analysis: High-speed video microscopy of ciliary beating [38]
Research Reagent Solutions
Table 3: Essential Research Reagents for Innate Immune Profiling
| Reagent/Category | Specific Examples | Research Application | Function |
|---|---|---|---|
| Cytokine Detection Kits | Bio-Plex Pro Human Inflammation Panel (37-Plex) | Multiplex cytokine quantification | Simultaneous measurement of 37 inflammatory mediators in small sample volumes [90] |
| Cell Culture Media | Air-liquid interface differentiation media | 3D respiratory model development | Supports differentiation of primary epithelial cells into mucociliary phenotype [38] |
| Viral Reagents | Clinical SARS-CoV-2 isolates (Delta, Omicron) | Pathogenesis studies | Authentic virus strains for infection models [15] [38] |
| Microfluidic Systems | Organ-on-chip platforms | Advanced 3D modeling | Recreation of tissue-tissue interfaces and mechanical forces [15] [87] |
| Single-Cell RNA Seq Kits | 10x Genomics Chromium Single Cell Immune Profiling | High-resolution immune mapping | Comprehensive analysis of immune cell heterogeneity and responses [89] |
| Antibody Panels | Flow cytometry panels for innate immune cells | Immunophenotyping | Simultaneous detection of multiple immune cell populations and activation states [88] |
Discussion and Future Perspectives
The integration of 3D respiratory models with multi-omics technologies provides unprecedented resolution for studying innate immune activation by SARS-CoV-2 VOCs. The consistent observation of variant-specific immune responses across experimental platforms and patient samples validates these approaches for investigating viral pathogenesis. Future research directions should focus on:
- Model complexity enhancement: Incorporation of immune cell populations into 3D respiratory models to better recapitulate the full scope of host-pathogen interactions
- Temporal resolution: High-frequency sampling to define the evolution of immune responses throughout infection
- Personalized models: Development of patient-specific MPS using primary cells from individuals with varying susceptibility to severe COVID-19
- Therapeutic screening: Utilization of validated models for evaluating immunomodulatory therapies against emerging variants
The continued refinement of these experimental platforms will enhance our ability to anticipate the pathogenicity of future variants and develop targeted countermeasures.
Integrated Workflow for Comparing 3D Model and Patient Immune Responses
This guide objectively compares the performance of different model systems in validating the distinct tissue tropism of SARS-CoV-2 Delta and Omicron variants. Data synthesized from peer-reviewed studies demonstrate that in vitro cell lines, primary cell cultures, animal models, and human ex vivo tissues provide consistent yet complementary insights. The core finding across all systems is that the Delta variant exhibits broad tropism and heightened pathogenicity in respiratory tissues, whereas the Omicron variant shows attenuated lung replication but maintains—or even enhances—replication capacity in certain extrapulmonary sites like the intestine and placenta.
Table 1: Overview of Model System Performance in Tropism Studies
| Model System | Key Advantage | Primary Use Case | Data Output |
|---|---|---|---|
| Cell Lines (Caco-2, Calu-3) [13] | High-throughput, controlled environment | Quantifying variant-specific replication kinetics and entry efficiency | Viral titer (TCID₅₀), intracellular RNA levels |
| Primary Cell Cultures [16] | Physiologically relevant, donor-specific responses | Studying infection in non-transformed human cells (e.g., trophoblasts) | Viral replication, host gene expression (RT-qPCR), fusion indices |
| Animal Models (Golden Syrian Hamster) [17] | In vivo pathogenesis and systemic immune response | Assessing overall virulence, lung damage, and immunometabolic dysregulation | Lung pathology scores, viral titers in organs, cytokine/metabolite levels |
| Human Ex Vivo Tissues [91] [92] | Direct human tissue context, identifies target cell types | Definitive tropism mapping and correlation with human receptor distribution | Viral antigen detection (IHC/IF), co-localization with host markers |
Quantitative Comparison of Variant Tropism Across Models
Experimental data from disparate model systems converge to illustrate a clear dichotomy in the tissue preference of Delta and Omicron variants.
Table 2: Quantitative and Observational Tropism Data Across Model Systems
| Tissue/Organ | Delta Variant Findings | Omicron Variant Findings | Key Supporting Model Systems |
|---|---|---|---|
| Lung / Respiratory | Higher viral titers and significant lung pathology with immune infiltration [17]. Efficient infection of lung epithelial cell lines (Calu-3) [13]. | Significantly lower viral titers and reduced lung damage [17]. Attenuated replication in Calu-3 cells [13]. | Animal models (GSH) [17], Cell lines [13] |
| Intestine | Robust replication in human intestinal epithelial cell line (Caco-2) [13]. Viral antigen detected in enterocytes [92]. | Robust replication in Caco-2 cells; some studies report increased RNA in anal swabs [13]. | Cell lines (Caco-2) [13], Human autopsy [92] |
| Placenta | High replication efficiency in primary first-trimester trophoblasts [16]. Alters syncytiotrophoblast dynamics, increases syncytial knots [16]. | Permissive infection in a variant- and donor-dependent manner; generally lower replication than Delta [16]. | Primary trophoblast cultures [16], Placental tissue analysis [16] |
| Vascular Endothelium | Infection of CD31+ vascular endothelial cells in multiple organs [92]. | Information not specified in search results. | Human autopsy, multiplex immunofluorescence [92] |
| Kidney | Viral antigens identified in distal tubules and collecting ducts [92]. | Information not specified in search results. | Human autopsy, co-localization studies [92] |
Detailed Experimental Protocols for Key Assays
Viral Replication Kinetics in Cell Lines
This protocol is adapted from studies utilizing Caco-2 and Calu-3 cells to compare Delta and Omicron replication [13].
- Cell Culture: Seed 30,000 cells per well in an appropriate plate. Use Caco-2 for intestinal and Calu-3 for lung modeling.
- Infection: At ~80% confluency, inoculate cells with SARS-CoV-2 at a defined Multiplicity of Infection (MOI) (e.g., 0.1 for Caco-2, 0.5 for Calu-3). Incubate for 2 hours.
- Post-Infection Handling: Remove the inoculum, wash cells to remove unbound virions, and add fresh culture medium.
- Data Collection:
- Infectious Titer: Harvest supernatant at designated time points (e.g., 8, 24, 48 hours post-infection/hpi). Determine the 50% tissue culture infectious dose (TCID₅₀) on permissive cells like Vero E6.
- Intracellular RNA: Lyse cells at various time points (e.g., 2, 8, 24, 48 hpi). Extract RNA and perform RT-qPCR for viral genes (e.g., subgenomic E RNA), normalized to a housekeeping gene like GAPDH.
Tropism Validation in Primary Human Trophoblasts
This method details the use of primary cytotrophoblasts (CTBs) from first-trimester placentas to assess viral impact on placental function [16].
- Trophoblast Isolation and Differentiation: Isolate CTBs from placental tissue via enzymatic digestion and Percoll gradient centrifugation. Immunopurify to remove CD45+ immune cells.
- For CTB infection: Seed cells and infect 24 hours post-seeding.
- For syncytiotrophoblast (STB) infection: Allow CTBs to spontaneously differentiate and fuse for 72 hours in culture before infection.
- Infection: Infect cells with relevant SARS-CoV-2 variants.
- Post-Infection Analysis:
- Viral Replication: Measure viral RNA copies in supernatant and cell lysate by RT-qPCR.
- Host Response: Quantify expression of viral entry receptors (ACE2, TMPRSS2) and innate immunity genes (e.g., IFN-λ) by RT-qPCR.
- Fusion Index: Fix cells and stain for desmoplakin or another membrane marker. Calculate the fusion index as the number of nuclei within syncytia divided by the total number of nuclei, multiplied by 100.
- Syncytial Knots (SK) Quantification: In parallel, analyze fixed placental tissues from infected and control pregnancies via immunohistochemistry to count SK formations.
In-situ Hybridization (ISH) for Viral Detection in Tissues
This protocol is used on formalin-fixed paraffin-embedded (FFPE) human tissue sections to pinpoint infected cell types [91].
- Probe Generation: Generate a digoxigenin-labeled DNA probe targeting a specific region of the SARS-CoV-2 genome (e.g., the membrane protein gene).
- Tissue Preparation: Cut FFPE tissue sections to 5 µm thickness. Deparaffinize and rehydrate through a series of xylenes and ethanol.
- Antigen Retrieval: Perform heat-induced epitope retrieval by microwaving slides in sodium citrate buffer.
- Hybridization: Apply the denatured probe to tissues and incubate at 42°C for 16 hours in a hybridization mix.
- Stringency Washes: Wash slides stringently to remove non-specifically bound probe.
- Detection: Incubate with an anti-digoxigenin antibody conjugated to alkaline phosphatase. Develop the signal using BCIP/NBT, which produces an insoluble blue precipitate where the probe has hybridized. Counterstain with methyl green.
Visualizing Experimental Workflows and Pathogenesis
The following diagrams summarize the key experimental pathways and biological concepts discussed.
Experimental Workflow for Tropism Validation
Mechanisms of Delta vs. Omicron Pathogenesis
The Scientist's Toolkit: Key Research Reagents
This table catalogs essential materials and their specific functions in tropism and pathogenicity research.
Table 3: Essential Research Reagents for SARS-CoV-2 Tropism Studies
| Reagent / Material | Function in Research | Specific Application Example |
|---|---|---|
| Caco-2 Cell Line [13] | Model of human intestinal epithelium; expresses ACE2 and TMPRSS2. | Comparing intestinal replication kinetics of Delta vs. Omicron [13]. |
| Calu-3 Cell Line [13] | Model of human lung epithelium; expresses ACE2 and TMPRSS2. | Assessing respiratory replication efficiency and innate immune response induction [13]. |
| Primary First-Trimester Trophoblasts [16] | Non-transformed human placental cells capable of spontaneous fusion. | Studying variant-specific placental infection, syncytialization effects, and vertical transmission risk [16]. |
| Golden Syrian Hamster (GSH) [17] | Small animal model for in vivo pathogenesis and transmission studies. | Evaluating lung damage, immune cell infiltration, and systemic immunometabolic dysregulation [17]. |
| Vero E6 (TMPRSS2 OE) Cells [16] | Monkey kidney cell line, often engineered to overexpress TMPRSS2 for efficient virus isolation and titration. | Propagating and quantifying infectious viral stocks for all infection experiments [16]. |
| Digoxigenin-labeled ISH Probe [91] | Nucleic acid probe for precise spatial localization of viral RNA in FFPE tissues. | Identifying specific infected cell types (e.g., pneumocytes, enterocytes) in human autopsy samples [91]. |
| Multiplex Immunofluorescence [92] | Technique for simultaneous detection of multiple antigens on a single tissue section. | Co-localizing viral antigens with specific host cell markers (e.g., CD31 for endothelium) to define cellular tropism [92]. |
Translating Epithelial Damage Markers to Histopathological Findings in Infected Tissues
The emergence of severe acute respiratory syndrome coronavirus 2 (SARS-CoV-2) variants of concern (VOCs) has significantly influenced the clinical presentation and pathogenesis of COVID-19. Among these, the Delta (B.1.617.2) and Omicron (B.1.1.529) variants display markedly different pathological profiles, particularly regarding their interaction with respiratory epithelial cells and the resulting tissue damage. This guide objectively compares the performance of these variants in experimental models, focusing on how epithelial damage markers translate to observable histopathological findings in infected tissues. The comparative analysis is framed within a broader thesis on SARS-CoV-2 pathogenicity investigated through advanced 3D respiratory models, providing researchers and drug development professionals with a structured overview of critical experimental data and methodologies.
Comparative Pathogenicity of Delta and Omicron Variants
The Delta and Omicron variants employ distinct mechanisms for cellular entry and replication, leading to differential activation of host immune responses and ultimately, divergent histopathological outcomes. The Omicron variant generally causes attenuated lung pathology compared to the Delta variant, despite its enhanced transmissibility [93]. This attenuated phenotype is linked to its altered cellular tropism and reduced efficiency in utilizing the TMPRSS2 protease for entry into lung epithelial cells [43]. Instead, Omicron shows a preference for the endosomal entry pathway, which influences its replication efficiency in different tissue types.
Table 1: Comparative Overview of Delta and Omicron Variant Characteristics
| Characteristic | Delta Variant | Omicron Variant |
|---|---|---|
| Primary Entry Pathway | TMPRSS2-mediated membrane fusion [93] | Cathepsin-dependent endocytosis [93] |
| Lung Replication Efficiency | High [43] [93] | Attenuated [43] [93] |
| Upper Respiratory Tract Fitness | Moderate [43] | Enhanced [43] |
| Induction of Pro-inflammatory Cytokines | Strong (e.g., IL-1α, IL-1β, IL-17α) [21] | Weaker [21] |
| Apoptosis Induction in Brain Tissue | Moderate [21] | Pronounced (caspase 8, caspase 9, p53) [21] |
| Overall Pathogenicity in Animal Models | High [21] [86] | Low to Moderate [21] [43] |
Conversely, the Delta variant efficiently utilizes TMPRSS2, facilitating robust replication in lung cells and leading to more severe lower respiratory tract pathology [93]. This fundamental difference in entry mechanism is a key determinant of the observed epithelial damage and subsequent immune activation. Mathematical modeling based on infection dynamics in Caco-2 (intestinal epithelium model) and Calu-3 (lung epithelium model) cell lines confirms that a lower cell entry rate for Omicron and a stronger innate immune response in infected cells are both necessary to explain its attenuated replication phenotype [13] [20].
Quantitative Data on Viral Dynamics and Host Response
Viral Replication and Dissemination
Experimental data from in vivo studies highlight significant differences in tissue tropism and viral load between the Delta and Omicron variants.
Table 2: Quantitative Viral Load in K18-hACE2 Mice Tissues (6 Days Post-Infection)
| Tissue | Delta Variant | Omicron Variant | Measurement Technique |
|---|---|---|---|
| Lung (Infectious Virus) | ~4.0 × 10⁶ PFU/g [86] | Not Detected [21] | Plaque Assay |
| Brain (Infectious Virus) | ~2.3 × 10⁸ PFU/g [86] | Not Reported | Plaque Assay |
| Lung (Viral RNA) | High [21] | Lower than Delta & Wild-type [21] | RT-qPCR |
| Brain (Viral RNA) | Significantly Higher than Ancestral [86] | Upregulation of Apoptotic Factors [21] | RT-qPCR |
In Syrian hamsters, contemporary Omicron variants (XBB.1.5, XBB.1.16, EG.5.1) replicate efficiently in the upper respiratory tract but show limited replication in the lungs. The JN.1 subvariant is notably attenuated in both the upper and lower respiratory tracts and fails to produce detectable infectious virus in the lungs [43]. This aligns with ex vivo data using human nasal and lung epithelium, where Omicron variants replicate faster than Delta in nasal epithelium but fail to replicate effectively in human lung organoids [43].
Immune and Apoptotic Response Markers
The host's immune response to infection, including cytokine production and apoptotic pathway activation, serves as a critical epithelial damage marker that precedes and correlates with histopathological changes.
Table 3: Expression of Immune and Apoptotic Response Markers in K18-hACE2 Mice
| Response Marker | Delta Variant Expression | Omicron Variant Expression | Primary Tissue Location |
|---|---|---|---|
| TLRs (Toll-like Receptors) | Upregulated [21] | Not Upregulated [21] | Lung, Brain |
| Pro-inflammatory Cytokines (IL-1α, IL-1β, IFN) | Upregulated (>3-fold) [21] | Lower than Wild-type/Delta [21] | Lung |
| Chemokines (CCL4, CCL11, CXCL10) | Upregulated (>3-fold) [21] | Lower than Wild-type/Delta [21] | Brain > Lung |
| Apoptotic Factors (Caspase 8, p53, Bax) | Moderate [21] | Pronounced Upregulation [21] | Brain |
A mathematical model integrating these findings suggests that the attenuated replication of Omicron is not solely due to reduced cell entry but also involves a stronger cytokine-mediated innate immune response from infected cells. This response makes uninfected cells resistant to infection, thereby limiting viral spread [13] [20].
Experimental Protocols and Methodologies
In Vivo Pathogenicity and Immune Response Profiling
Objective: To compare the pathogenicity, viral dissemination, and host immune response elicited by SARS-CoV-2 Delta and Omicron variants [21] [86].
- Animal Model: K18-hACE2 transgenic mice (8-12 week-old females).
- Virus Inoculation: Mice are intranasally inoculated with a defined dose (e.g., 10⁴ PFU) of either the Delta (B.1.617.2) or Omicron (B.1.1.529) variant.
- Clinical Monitoring: Mice are monitored daily for body weight change and clinical disease score until the endpoint (e.g., 6 days post-infection, dpi).
- Sample Collection: At euthanasia, tissues (lung, brain, intestine, kidney) and serum are collected.
- Viral Load Quantification:
- Infectious Virus Titration: Homogenized tissue samples are titrated on permissive cell lines (e.g., VeroE6). The median tissue culture infectious dose (TCID₅₀) or plaque-forming units (PFU) per gram of tissue is calculated [21] [86].
- Viral RNA Quantification: RNA is extracted from tissues, and viral genome copies are quantified by reverse-transcription quantitative PCR (RT-qPCR) against a standard curve [21].
- Immune Gene Expression Profiling: RNA from tissues is analyzed by RT-qPCR using panels of immune response genes (e.g., TLRs, cytokines, chemokines, apoptotic factors). Expression folds are calculated using the ΔΔCt method [21].
- Histopathological Analysis: Tissues are fixed, embedded, sectioned, and stained with Hematoxylin and Eosin (H&E). Pathological changes (e.g., immune infiltration, tissue damage) are scored by a pathologist blinded to the experimental groups [86].
Ex Vivo Replication Kinetics in Human Respiratory Models
Objective: To assess the replication capacity of variants in models of the human upper and lower respiratory tract [43] [93].
- Cell Models:
- Primary Human Nasal Epithelial Cells (HNECs): Differentiated at an air-liquid interface (ALI) to form a polarized pseudostratified mucociliary epithelium.
- Human Lung Organoids or Calu-3 Cells: Representing the lower respiratory tract.
- Infection: Cultures are inoculated apically (for HNEC-ALI) or in suspension with either Delta or Omicron variants at a defined multiplicity of infection (MOI).
- Viral Kinetics Measurement:
- Infectious Virus Release: Apical washes (for ALI) or culture supernatants are collected at various time points (e.g., 24, 48, 72, 96 hours post-inoculation, hpi). Infectious virus titers are determined by TCID₅₀ assay.
- Viral RNA Quantification: Cell lysates and supernatants are analyzed for genomic and subgenomic RNA by RT-qPCR, indicating viral replication and transcription activity [43].
- Innate Immune Response: Culture supernatants can be assayed for cytokines/chemokines via ELISA or multiplex immunoassays.
Mathematical Modeling of Within-Host Dynamics
Objective: To identify key viral and host parameters (e.g., cell entry rate, innate immune response strength) that drive differential variant dynamics [13] [20].
- Data Input: The model is fitted to experimental data from cell lines (e.g., Caco-2, Calu-3), including initial conditions, infectious virus titers, and intracellular viral RNA measurements at multiple time points.
- Model Framework: A refined integro-differential equation model describing target cell susceptibility, viral entry, intracellular replication, and innate immune response (e.g., cytokine-mediated resistance) is employed.
- Parameter Estimation: Variant- and cell-line-specific parameters (e.g., cell entry rate, cytokine production rate) are estimated through model fitting to the experimental data. The model tests whether differences in a single parameter or a combination thereof can explain the observed data.
Visualization of Experimental Workflows and Pathogenic Mechanisms
Pathogenicity Comparison Workflow
The following diagram outlines the core experimental workflow for comparing the pathogenicity of SARS-CoV-2 variants, from model selection to integrated data analysis.
Variant-Specific Pathogenesis Mechanisms
This diagram illustrates the distinct cellular entry pathways and subsequent host responses that characterize Delta and Omicron infections, leading to divergent histopathological outcomes.
The Scientist's Toolkit: Key Research Reagent Solutions
Table 4: Essential Research Materials and Reagents for SARS-CoV-2 Pathogenicity Studies
| Reagent/Material | Function/Application | Example Use in Context |
|---|---|---|
| K18-hACE2 Transgenic Mice | In vivo model expressing human ACE2 receptor, susceptible to SARS-CoV-2 infection and showing severe disease [21] [86]. | Comparing viral dissemination, weight loss, and clinical scores between variants [21] [86]. |
| Primary Human Nasal Epithelial Cells (HNECs) | Differentiated at air-liquid interface (ALI) to model the human upper respiratory tract with authentic cell composition and function [43]. | Assessing variant-specific replication kinetics in the upper airways [43]. |
| Calu-3 Cell Line | Human lung epithelial cell line expressing ACE2 and TMPRSS2, modeling the lower respiratory tract [13] [20]. | Quantifying viral entry efficiency and replication in lung-derived cells in vitro [13] [20]. |
| TCID₅₀ Assay | Standard virology method to quantify infectious virus titers in tissue homogenates or culture supernatants [21] [43]. | Determining infectious viral loads in lungs of infected animals or culture models [21] [43]. |
| RT-qPCR Panels for Immune Genes | Pre-designed sets of primers and probes to quantify host mRNA expression of immune-related genes (e.g., cytokines, TLRs, apoptotic factors) [21]. | Profiling host immune and apoptotic responses in infected tissues to link to pathology [21]. |
| Pangolin Lineage Assignment Tool | Bioinformatics software for assigning SARS-CoV-2 genomic sequences to phylogenetic lineages [84] [94]. | Confirm the identity and purity of viral variants used in challenge studies. |
Conclusion
Research utilizing 3D respiratory models consistently demonstrates that the Delta variant exhibits enhanced pathogenicity through efficient TMPRSS2-mediated entry, robust replication, syncytia formation, and induction of pronounced inflammatory responses that cause significant tissue damage. In contrast, the Omicron variant shows attenuated pathogenicity with altered cellular entry pathways, reduced replication efficiency in lower respiratory cell types, and diminished activation of destructive host immune responses. These fundamental differences in early host-virus interactions, elucidated through sophisticated model systems, explain the clinical observations of reduced severity during Omicron-dominated waves. Future research should focus on leveraging these models to predict the pathogenicity of emerging variants, develop broad-spectrum antivirals that target conserved pathogenic mechanisms, and refine public health strategies based on variant-specific virulence assessments. The integration of 3D models with multi-omics approaches and advanced imaging will further enhance our predictive capability for managing future pandemic threats.
References
- 1. Delta variant (B.1.617.2) of SARS-CoV-2: Mutations, impact ... [https://pmc.ncbi.nlm.nih.gov/articles/PMC9359381/]
- 2. The Delta and Omicron Variants of SARS-CoV-2 [https://pmc.ncbi.nlm.nih.gov/articles/PMC9698608/]
- 3. A computational evaluation of structural stability of omicron ... [https://pmc.ncbi.nlm.nih.gov/articles/PMC9450468/]
- 4. Computational analysis of the effect of SARS-CoV-2 variant ... [https://virological.org/t/computational-analysis-of-the-effect-of-sars-cov-2-variant-omicron-spike-protein-mutations-on-dynamics-ace2-binding-and-propensity-for-immune-escape/776]
- 5. Computational analysis of the sequence-structure relation ... [https://www.nature.com/articles/s41598-023-30052-w]
- 6. SARS-CoV-2 Omicron variant replication in human ... [https://www.nature.com/articles/s41586-022-04479-6]
- 7. Computational analysis of interior mutations of SARS-CoV ... [https://www.sciencedirect.com/science/article/pii/S2001037022004913]
- 8. Comparison of SARS-CoV-2 variants of concern in primary ... [https://pubmed.ncbi.nlm.nih.gov/38477472/]
- 9. Comparative Computational Analysis of Spike Protein ... [https://www.mdpi.com/1422-0067/24/22/16069]
- 10. Mechanisms of SARS-CoV-2 entry into cells [https://www.nature.com/articles/s41580-021-00418-x]
- 11. Neuropilin-1 facilitates SARS-CoV-2 cell entry and infectivity [https://pmc.ncbi.nlm.nih.gov/articles/PMC7857391/]
- 12. A Detailed Overview of SARS-CoV-2 Omicron: Its Sub- ... [https://pmc.ncbi.nlm.nih.gov/articles/PMC9866114/]
- 13. Mathematical model explains differences in Omicron and ... [https://pmc.ncbi.nlm.nih.gov/articles/PMC10981414/]
- 14. Neuropilin-1: A Conserved Entry Receptor for SARS-CoV-2 ... [https://www.mdpi.com/2227-9059/13/7/1730]
- 15. Comparative pathogenicity of SARS-CoV-2 Omicron ... [https://www.nature.com/articles/s42003-023-05081-w]
- 16. SARS-CoV-2 delta and omicron variants alter trophoblast ... [https://www.nature.com/articles/s41419-025-08016-x]
- 17. Article Differential immunometabolic responses to Delta ... [https://www.sciencedirect.com/science/article/pii/S2589004224017267]
- 18. Altered TMPRSS2 usage by SARS-CoV-2 Omicron impacts ... [https://www.nature.com/articles/s41586-022-04474-x]
- 19. SARS-CoV-2 Omicron variant shows less efficient ... [https://pmc.ncbi.nlm.nih.gov/articles/PMC8774049/]
- 20. Mathematical model explains differences in Omicron and ... [https://peerj.com/articles/16964/]
- 21. Comparison of the Pathogenicity of SARS-CoV-2 Delta and ... [https://pubmed.ncbi.nlm.nih.gov/36472114/]
- 22. Modelling the viral dynamics of the SARS-CoV-2 Delta and ... [https://pmc.ncbi.nlm.nih.gov/articles/PMC10410224/]
- 23. SARS-CoV-2 leverages airway epithelial protective ... [https://pmc.ncbi.nlm.nih.gov/articles/PMC9912025/]
- 24. Age-specific nasal epithelial responses to SARS-CoV-2 ... [https://www.nature.com/articles/s41564-024-01658-1]
- 25. 3D Lung Tissue Models for Studies on SARS-CoV-2 ... [https://pmc.ncbi.nlm.nih.gov/articles/PMC9456220/]
- 26. 3D-printed airway model as a platform for SARS-CoV-2 ... [https://www.sciencedirect.com/science/article/abs/pii/S0142961224002230]
- 27. Experimental Models to Investigate Viral and Cellular ... [https://www.mdpi.com/2076-2607/13/11/2444]
- 28. the viral escape room secret to persistent infection of SARS ... [https://www.frontiersin.org/journals/microbiology/articles/10.3389/fmicb.2025.1561274/full]
- 29. The Mechanism and Consequences of SARS-CoV-2 Spike ... [https://pmc.ncbi.nlm.nih.gov/articles/PMC8485708/]
- 30. SARS‐CoV‐2 Alpha, Beta, and Delta variants display ... [https://pmc.ncbi.nlm.nih.gov/articles/PMC8646911/]
- 31. Exploring the Replication and Pathogenic Characteristics ... [https://pubmed.ncbi.nlm.nih.gov/39684353/]
- 32. Comparison of the pathogenicity of multiple SARS-CoV-2 ... [https://pubmed.ncbi.nlm.nih.gov/40394859/]
- 33. Comparative temporal transcriptome analyses of SARS ... [https://www.frontiersin.org/journals/cellular-and-infection-microbiology/articles/10.3389/fcimb.2025.1553464/full]
- 34. SARS-CoV-2 S-protein expression drives syncytia ... [https://www.nature.com/articles/s41598-025-86242-1]
- 35. Differences in syncytia formation by SARS-CoV-2 variants ... [https://www.sciencedirect.com/science/article/pii/S2211124723014900]
- 36. SARS‐CoV‐2‐infected human airway epithelial cell ... [https://pmc.ncbi.nlm.nih.gov/articles/PMC11017760/]
- 37. Morphogenesis and cytopathic effect of SARS-CoV-2 ... [https://www.nature.com/articles/s41467-020-17796-z]
- 38. Comparison of SARS-CoV-2 variants of concern in primary ... [https://pmc.ncbi.nlm.nih.gov/articles/PMC11005367/]
- 39. Viral dynamics of Omicron and Delta SARS-CoV-2 variants ... [https://pmc.ncbi.nlm.nih.gov/articles/PMC8996632/]
- 40. Omicron subvariants illustrate reduced respiratory tissue ... [https://pubmed.ncbi.nlm.nih.gov/37915577/]
- 41. An Optimized High-Throughput Immuno-Plaque Assay for ... [https://pmc.ncbi.nlm.nih.gov/articles/PMC7906992/]
- 42. The comparison of pathogenicity among SARS-CoV-2 ... [https://www.nature.com/articles/s41598-024-71791-8]
- 43. Evolution of Omicron lineage towards increased fitness in ... [https://www.nature.com/articles/s41467-025-55938-3]
- 44. Comparison οf Immune Responses Through ... [https://www.mdpi.com/2227-9067/11/11/1278]
- 45. Patient Stratification for Serum LDH Levels Reveals Distinct ... [https://pmc.ncbi.nlm.nih.gov/articles/PMC12387014/]
- 46. Omicron subvariants illustrate reduced respiratory tissue ... [https://pmc.ncbi.nlm.nih.gov/articles/PMC10616953/]
- 47. Omicron subvariants illustrate reduced respiratory tissue ... [https://www.frontiersin.org/journals/immunology/articles/10.3389/fimmu.2023.1258268/full]
- 48. Comparative plasma metabolomics of Delta and Omicron ... [https://pubmed.ncbi.nlm.nih.gov/41181326/]
- 49. Structure and dynamics of the interaction of Delta and ... [https://pmc.ncbi.nlm.nih.gov/articles/PMC11668877/]
- 50. Protective prototype-Beta and Delta-Omicron chimeric RBD ... [https://www.sciencedirect.com/science/article/pii/S009286742200527X]
- 51. Insights into the Replication Kinetics Profiles of Malaysian ... [https://www.mdpi.com/1422-0067/25/19/10541]
- 52. Ancestral, Delta, and Omicron (BA.1) SARS-CoV-2 strains ... [https://www.sciencedirect.com/science/article/pii/S2666634023002878]
- 53. Detection and quantification of infectious severe acute ... [https://www.nature.com/articles/s41598-022-09218-5]
- 54. Advances and Challenges in SARS-CoV-2 Detection - PMC [https://pmc.ncbi.nlm.nih.gov/articles/PMC10931201/]
- 55. Evidence for SARS-CoV-2 Delta and Omicron co-infections ... [https://pmc.ncbi.nlm.nih.gov/articles/PMC9581791/]
- 56. An integrated cell absorption process and quantitative PCR ... [https://www.sciencedirect.com/science/article/abs/pii/S0048969718314013]
- 57. Characteristics of cytokines/chemokines associated with ... [https://pmc.ncbi.nlm.nih.gov/articles/PMC11625740/]
- 58. An inflammatory cytokine signature predicts COVID-19 ... [https://pmc.ncbi.nlm.nih.gov/articles/PMC7869028/]
- 59. Cytokine, chemokine, and acute-phase protein profiles in ... [https://www.nature.com/articles/s41598-025-99248-6]
- 60. Cytokine profiles dynamics in COVID-19 patients [https://www.nature.com/articles/s41598-025-98505-y]
- 61. Comparative Analysis of Multiple Immunoassays for ... [https://www.sciencedirect.com/science/article/pii/S2472555222066473]
- 62. Multiplex array analysis of circulating cytokines and ... [https://bmcimmunol.biomedcentral.com/articles/10.1186/s12865-024-00641-z]
- 63. Comparison of the Cytokine and Chemokine Dynamics ... [https://pmc.ncbi.nlm.nih.gov/articles/PMC3148335/]
- 64. Binding affinity and mechanisms of SARS-CoV-2 variants [https://pmc.ncbi.nlm.nih.gov/articles/PMC8312055/]
- 65. The Omicron variant BA.2.86.1 of SARS- CoV-2 ... - Nature [https://www.nature.com/articles/s41598-025-89548-2]
- 66. Phenotypic evolution of SARS-CoV-2 spike during the ... [https://www.nature.com/articles/s41564-024-01878-5]
- 67. Comparison of clinical characteristics between SARS-CoV-2 ... [https://pmc.ncbi.nlm.nih.gov/articles/PMC9597612/]
- 68. From Alpha to Omicron: How Different Variants of Concern ... [https://pmc.ncbi.nlm.nih.gov/articles/PMC10525159/]
- 69. The landscape of antibody binding affinity in SARS-CoV-2 ... [https://elifesciences.org/articles/83442]
- 70. Human Pulmonary 3D Models For Translational Research [https://pmc.ncbi.nlm.nih.gov/articles/PMC7161817/]
- 71. Altered TMPRSS2 usage by SARS - CoV - 2 impacts... | Nature Omicron [https://www.nature.com/articles/s41586-022-04474-x?error=cookies_not_supported]
- 72. SARS-CoV-2 Causes Severe Epithelial Inflammation and ... [https://pmc.ncbi.nlm.nih.gov/articles/PMC8139673/]
- 73. SARS-CoV-2 envelope protein impairs airway epithelial ... [https://www.nature.com/articles/s41392-024-01753-z]
- 74. The Omicron Variant BA.1.1 Presents a Lower Pathogenicity than... [https://pmc.ncbi.nlm.nih.gov/articles/PMC9472624/]
- 75. Astodrimer sodium nasal spray forms a barrier to SARS ... [https://www.nature.com/articles/s41598-024-72262-w]
- 76. Current Advances and Applications of Animal Models in ... [https://www.mdpi.com/2076-2607/13/9/2009]
- 77. Comparative pathology of animal models for COVID-19 - PMC [https://pmc.ncbi.nlm.nih.gov/articles/PMC10878030/]
- 78. Exploring the Replication and Pathogenic Characteristics ... [https://www.mdpi.com/1422-0067/25/23/12641]
- 79. K18-hACE2 mice develop respiratory disease resembling ... [https://pmc.ncbi.nlm.nih.gov/articles/PMC7875348/]
- 80. SARS-CoV-2 infection of human ACE2-transgenic mice ... [https://www.nature.com/articles/s41590-020-0778-2]
- 81. SARS-CoV-2 Omicron variant causes mild pathology in the ... [https://www.nature.com/articles/s41467-022-31200-y]
- 82. Establishment and characterization of an hACE2/ ... [https://www.frontiersin.org/journals/immunology/articles/10.3389/fimmu.2024.1428711/full]
- 83. New mouse model for inducible hACE2 expression ... [https://link.springer.com/article/10.1007/s00335-025-10115-1]
- 84. SARS-CoV-2 variants of concern as of 31 October 2025 - ECDC [https://www.ecdc.europa.eu/en/covid-19/variants-concern]
- 85. SARS-CoV-2 Omicron is an immune escape variant with ... [https://www.nature.com/articles/s41564-022-01143-7]
- 86. The Delta SARS-CoV-2 Variant of Concern Induces Distinct ... [https://pmc.ncbi.nlm.nih.gov/articles/PMC9239116/]
- 87. Modelling the innate immune system in microphysiological ... [https://pmc.ncbi.nlm.nih.gov/articles/PMC11264333/]
- 88. A systems immunology study comparing innate and ... [https://pmc.ncbi.nlm.nih.gov/articles/PMC9935276/]
- 89. Dictionary of immune responses to cytokines at single-cell ... [https://www.nature.com/articles/s41586-023-06816-9]
- 90. Serum cytokine profiling reveals different immune ... [https://www.frontiersin.org/journals/immunology/articles/10.3389/fimmu.2022.1088725/full]
- 91. Tissue and cellular tropism of the coronavirus associated with ... [https://pmc.ncbi.nlm.nih.gov/articles/PMC7167900/]
- 92. SARS-CoV-2 cell tropism and multiorgan infection [https://www.nature.com/articles/s41421-021-00249-2]
- 93. Omicron: increased transmissibility and decreased ... [https://www.nature.com/articles/s41392-022-01009-8]
- 94. Recombinant SARS-CoV-2 Delta/Omicron BA.5 emerging ... [https://www.nature.com/articles/s41598-024-75241-3]