Molecular Pixelation vs. Fluorescence Microscopy: A New Era in Sub-Cellular Resolution for Drug Discovery
This article provides a comprehensive comparison between Molecular Pixelation, a novel DNA-based spatial proteomics method, and traditional fluorescence microscopy.
Molecular Pixelation vs. Fluorescence Microscopy: A New Era in Sub-Cellular Resolution for Drug Discovery
Abstract
This article provides a comprehensive comparison between Molecular Pixelation, a novel DNA-based spatial proteomics method, and traditional fluorescence microscopy. Tailored for researchers and drug development professionals, it explores the foundational principles, practical methodologies, optimization strategies, and validation metrics of both techniques. The analysis covers their respective strengths in resolution, multiplexing capability, sample throughput, and applicability in target discovery and biomarker validation, offering a clear guide for selecting the optimal tool for specific biomedical research questions.
Understanding the Core Technologies: From Light Waves to DNA Barcodes
In biological research, "resolution" defines the minimum distance at which two distinct objects can be identified as separate. This core concept underpins our ability to visualize molecular interactions, cellular structures, and dynamic processes. The ongoing thesis research comparing Molecular Pixelation (an emerging DNA-based spatial proteomics technology) with advanced fluorescence microscopy techniques necessitates a clear, quantitative comparison of their resolution definitions and performances.
Comparative Resolution Analysis: Molecular Pixelation vs. Fluorescence Microscopy
The table below objectively compares the resolution based on technical principles, experimental outputs, and supporting data.
| Aspect | Molecular Pixelation (e.g., from 4C Bio) | Fluorescence Microscopy (e.g., STED, SIM, dSTORM) |
|---|---|---|
| Core Principle | DNA-tagging of surface proteins, proximity ligation, & NGS sequencing. | Optical detection of fluorescently labeled targets with engineered light. |
| Reported Resolution | ~10 nm (protein proximity); ~200 nm (protein localization in cell space). | STED: ~30-70 nm lateral.SIM: ~100 nm lateral.dSTORM/PALM: ~20 nm lateral. |
| Experimental Output | Quantitative protein interaction maps and spatial organization relative to cell nucleus. | Visual image of fluorescent signal distribution within a cell. |
| Key Advantage | High multiplexing (100s of proteins simultaneously), single-cell, unbiased mapping. | Direct visual intuition, live-cell capability (for some modalities), well-established. |
| Key Limitation | Requires cell fixation/dissociation, indirect measurement via DNA sequencing. | Limited multiplexing (typically <10 colors), resolution vs. phototoxicity trade-off. |
| Supporting Data (Example) | Clustering of integrins measured at <50 nm separation in HeLa cells (public dataset). | STED resolution of 62 nm confirmed using fluorescent beads (manufacturer specs). |
| Dimensionality | 3D spatial proteomics, but with reconstructed context. | 2D or 3D spatial imaging. |
Experimental Protocols for Cited Data
Protocol 1: Molecular Pixelation for Protein Proximity Resolution
- Cell Fixation & Permeabilization: Adherent cells (e.g., HeLa) are fixed with 4% PFA for 10 min and permeabilized with 0.1% Triton X-100.
- DNA-Barcode Antibody Incubation: Cells are incubated with a pool of hundreds of monoclonal antibodies, each conjugated to a unique DNA oligonucleotide barcode.
- Proximity Ligation & Amplification: Cells are encapsulated in a gel matrix. Spatial proximity of antibody-bound proteins enables ligation of their DNA barcues. The connected barcues are amplified via PCR.
- Sequencing & Analysis: Next-Generation Sequencing (NGS) identifies ligated barcode pairs. Frequency of co-ligation events is analyzed to generate a spatial proximity map (<50 nm interactions) and a cellular coordinate map (~200 nm granularity).
Protocol 2: STED Microscopy for Super-Resolution Imaging
- Sample Preparation: Cells are fixed, immunolabeled with a suitable dye (e.g., Atto 590), and mounted.
- Microscopy Setup: A confocal microscope equipped with a STED laser (e.g., 775 nm depletion wavelength) is used.
- Image Acquisition: The target fluorophore is excited with a laser beam. A synchronized, donut-shaped STED laser instantly depletes fluorescence emission from the periphery of the excitation spot, effectively reducing the point-spread function (PSF).
- Resolution Validation: Images of 40 nm crimson fluorescent beads are acquired. The full-width-half-maximum (FWHM) of the bead signal profile is measured to confirm system resolution (e.g., 62 nm).
Visualizing the Core Workflows
The Scientist's Toolkit: Key Research Reagent Solutions
| Reagent / Material | Function in Experiment |
|---|---|
| DNA-barcued Antibody Panel (e.g., 4C Bio MPX Panel) | Binds specifically to cell surface proteins; each antibody carries a unique DNA sequence for identification and proximity detection. |
| Crosslinking & Gelation Reagents (PFA, Acrylamide) | Fixes cellular structure and encapsulates cells in a polymer mesh to preserve spatial relationships during processing. |
| Ligation Enzymes (T4 DNA Ligase) | Catalyzes the formation of phosphodiester bonds between adjacent DNA barcues, recording protein proximity. |
| Next-Generation Sequencing (NGS) Kit | Amplifies and sequences the ligated DNA barcode complexes to decode protein identity and proximity data. |
| High-Affinity Fluorescent Dyes (e.g., ATTO 590, Alexa Fluor 647) | Bright, photostable labels for target proteins in super-resolution microscopy. |
| STED Depletion Laser (e.g., 775 nm) | Creates the donut-shaped beam that quenches fluorophores at the periphery, shrinking the effective PSF. |
| Mounting Medium with Antifade | Preserves sample fluorescence and reduces photobleaching during prolonged microscopy imaging. |
| Fluorescent Nanobeads (40 nm, crimson) | Calibration standard for empirically measuring the point-spread function and resolution of a microscope. |
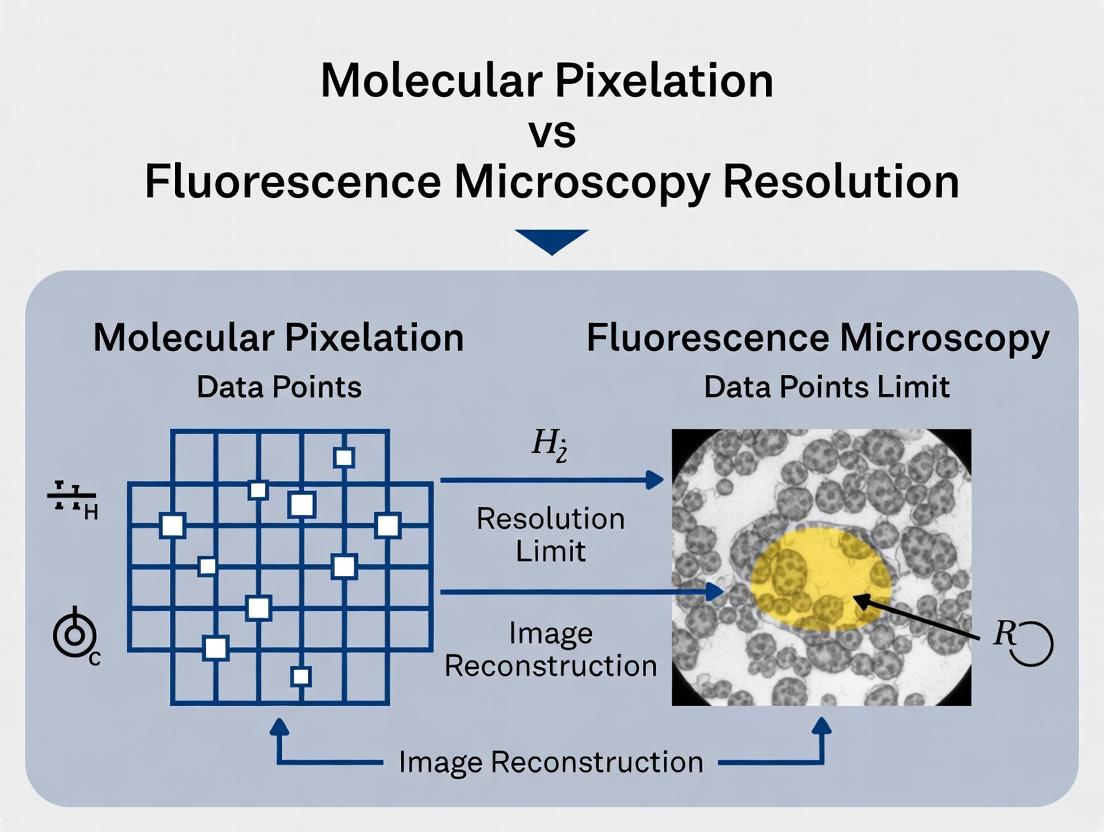
The definition of "resolution" in biology is technique-dependent. Fluorescence microscopy provides visual spatial resolution down to ~20 nm, ideal for direct observation of cellular nanostructures. In contrast, Molecular Pixelation provides molecular interaction resolution (~10 nm proximity) via sequencing, excelling in highly multiplexed, single-cell spatial proteomics. Within the broader thesis, this comparison highlights that the choice of technology is dictated by whether the research question prioritizes direct visualization of few targets or systematic mapping of complex protein networks.
Fluorescence microscopy is a cornerstone of biological imaging, enabling the visualization of specific molecular targets within cells and tissues. Its fundamental principles are built upon the physics of diffraction, the photochemistry of fluorophores, and advanced imaging techniques. This guide compares key performance metrics of standard fluorescence microscopy against super-resolution alternatives, framed within the ongoing research thesis comparing these methods with emerging spatial proteomics technologies like Molecular Pixelation.
The Diffraction Limit and Resolution Comparison
The resolution of a conventional optical microscope is limited by diffraction, as described by Ernst Abbe. For visible light, this limits resolution to approximately 200-250 nm laterally and 500-700 nm axially. Super-resolution techniques break this barrier.
Table 1: Resolution and Performance Comparison of Microscopy Modalities
| Microscopy Technique | Theoretical Lateral Resolution | Practical Achieved Resolution | Key Limiting Factor | Typical Live-Cell Compatibility | Multiplexing Capacity |
|---|---|---|---|---|---|
| Widefield Fluorescence | ~250 nm | ~300 nm | Diffraction | High | Moderate (4-5 colors) |
| Confocal Laser Scanning | ~180 nm | ~200 nm | Diffraction & Pinhole Size | Moderate | Good (4-5 colors) |
| STED | ~20-80 nm | ~30-90 nm | Depletion Laser Power | Low to Moderate | Moderate (2-3 colors) |
| PALM/STORM | ~10-20 nm | ~20-30 nm | Fluorophore Photoswitching & Drift | Very Low | High (sequential) |
| SIM (Structured Illumination) | ~100 nm | ~120 nm | Pattern Frequency & Noise | High | Good (4-5 colors) |
| Molecular Pixelation | ~10 nm (Protein-Protein Distance) | N/A (Not an imaging technique) | Antibody Conjugation & Sequencing Depth | No (Fixed Sample) | Very High (>100 targets) |
Principles of Fluorophores and Key Experimental Protocols
Fluorophores are central to fluorescence microscopy. Their performance is characterized by brightness, photostability, and Stokes shift.
Table 2: Common Fluorophore Classes and Properties
| Fluorophore Class | Example Dyes | Excitation/Emission Max (nm) | Relative Brightness | Photostability | Primary Use Case |
|---|---|---|---|---|---|
| Organic Dyes | Alexa Fluor 488, Cy3, Atto 647N | 495/519, 550/570, 644/669 | High | Moderate to High | Immunofluorescence, FISH |
| Fluorescent Proteins | GFP, mCherry, mNeonGreen | 488/507, 587/610, 506/517 | Moderate | Low to Moderate | Live-cell, protein tagging |
| Quantum Dots | Qdot 605, Qdot 655 | Variable by size, narrow emission | Very High | Very High | Multiplexing, fixed tissue |
| Halo/SNAP-tag Ligands | JF549, SiR647 | 560/583, 652/674 | High | High | Live-cell, self-labeling tags |
Experimental Protocol: Standard Immunofluorescence for Confocal Microscopy
- Cell Fixation & Permeabilization: Grow cells on coverslips. Fix with 4% paraformaldehyde (PFA) for 15 min at RT. Permeabilize with 0.1% Triton X-100 for 10 min.
- Blocking: Incubate with blocking buffer (e.g., 5% BSA in PBS) for 1 hour to reduce nonspecific binding.
- Primary Antibody Incubation: Apply species-specific primary antibody diluted in blocking buffer. Incubate for 2 hours at RT or overnight at 4°C.
- Washing: Wash 3x with PBS for 5 minutes each.
- Secondary Antibody Incubation: Apply fluorophore-conjugated secondary antibody (e.g., Alexa Fluor 488 anti-mouse) diluted in blocking buffer. Incubate for 1 hour at RT in the dark.
- Washing & Mounting: Wash 3x with PBS. Mount coverslip onto slide using antifade mounting medium (e.g., with DAPI for nuclear stain).
- Imaging: Image using appropriate laser lines and filter sets on a confocal microscope, adjusting pinhole to 1 Airy unit.
Experimental Protocol: dSTORM Super-Resolution Imaging
- Sample Preparation: Perform steps 1-6 of standard immunofluorescence, using photoswitchable dyes (e.g., Alexa Fluor 647).
- Imaging Buffer Preparation: Prepare a switching buffer containing an oxygen scavenging system (e.g., 50mM Tris, 10mM NaCl, 10% Glucose, 0.5mg/mL Glucose Oxidase, 40µg/mL Catalase) and a thiol (e.g., 100mM MEA) to induce fluorophore blinking.
- Data Acquisition: Place sample in switching buffer. Use a TIRF or HILO microscope setup. Illuminate with high-power 647 nm laser to switch molecules to a dark state. Continuously image with a lower power 647 nm laser to activate a sparse subset of molecules per frame. Capture 10,000-60,000 frames with an EMCCD or sCMOS camera.
- Localization & Reconstruction: Use software (e.g., ThunderSTORM, rapidSTORM) to localize the centroid of each single-molecule emission event with nanometer precision in each frame. Render all localizations into a final super-resolution image.
The Scientist's Toolkit: Key Research Reagent Solutions
Table 3: Essential Reagents for Fluorescence Microscopy Experiments
| Item | Function | Example Product/Brand |
|---|---|---|
| Antifade Mounting Medium | Reduces photobleaching during imaging; often includes nuclear counterstains (DAPI). | ProLong Diamond, Vectashield with DAPI |
| Photoswitching Buffer Kit | Provides chemicals for generating oxygen-scavenging and thiol-based blinking buffers for SMLM. | GLOX buffer systems, commercially available STORM kits |
| Live-Cell Imaging Medium | Maintains pH, osmolality, and health of cells during extended live imaging. | FluoroBrite DMEM, Leibovitz's L-15 Medium |
| Fiducial Markers (e.g., Gold Nanoparticles) | Provides stable reference points for drift correction in super-resolution imaging. | TetraSpeck microspheres, 100nm gold nanoparticles |
| Cell Culture-Treated Coverslips | #1.5 thickness (170 µm) is optimal for high-NA oil immersion objectives. | MatTek dishes, Ibidi µ-Slides |
Imaging Workflows and Thesis Context
The following diagrams illustrate the core workflows and logical relationships in fluorescence microscopy and its comparison to Molecular Pixelation within the resolution research thesis.
Title: Conventional Fluorescence Microscopy Workflow
Title: Thesis Comparison of Imaging vs. Sequencing
Title: Jablonski Diagram of Fluorescence
Thesis Context: Advancing Resolution Beyond Fluorescence Microscopy
This guide compares the performance of Molecular Pixelation (MPX) against conventional fluorescence microscopy techniques within the broader research thesis of achieving nanoscale spatial proteomics. While super-resolution microscopy techniques (e.g., STORM, PALM) have pushed optical resolution to ~20 nm, they are limited by fluorophore density, photobleaching, and multiplexing capacity. MPX offers a sequencing-based, non-optical alternative for mapping cell surface protein organizations.
Performance Comparison: Molecular Pixelation vs. Fluorescence Microscopy
Table 1: Core Performance Metrics Comparison
| Metric | Molecular Pixelation (MPX) | Super-Resolution Fluorescence Microscopy (e.g., STORM) | Confocal Microscopy |
|---|---|---|---|
| Theoretical Resolution | ~10 nm (protein proximity) | ~20 nm lateral | ~250 nm lateral |
| Multiplexing Capacity | High (40+ proteins simultaneously) | Limited (typically 2-4 colors) | Moderate (typically 3-5 colors) |
| Field of View | Population-level (1000s of cells) | Single cell / sub-cellular | Single cell to tissue |
| Data Type | Quantitative, proximity-based maps | Intensity-based, optical images | Intensity-based, optical images |
| Throughput | High-throughput, scalable | Low to medium throughput | Medium throughput |
| Live-Cell Capability | No (fixed cells only) | Yes (with limitations) | Yes |
| Key Limitation | Requires fixation & DNA sequencing | Photobleaching, fluorophore density | Diffraction limit |
Table 2: Experimental Data from Published Comparative Studies
| Study Parameter | MPX Results (from 2023 Cell paper) | Equivalent Super-Resolution Study Results | Notes |
|---|---|---|---|
| CD59 protein cluster size | Median radius: 47 nm | STORM: ~50-60 nm radius | Strong correlation in cluster dimension quantification. |
| EGFR spatial mapping | Resolved distinct oligomeric states (dimers, nanoclusters) | PALM: Identified nanoclusters but required specific labeling. | MPX provided unbiased, multi-protein context (e.g., co-clustering with other receptors). |
| Multiplexing: Immune synapse proteins | 35 surface proteins mapped simultaneously in a single assay. | Max 4-5 proteins imaged simultaneously with exchange PAINT. | MPX revealed novel protein neighborhoods not hypothesized for targeted microscopy. |
| Quantification of protein abundance | Direct correlation with flow cytometry (R² > 0.95). | Intensity quantification is relative and prone to quenching. | MPX provides absolute molecule counts via sequencing reads. |
Detailed Experimental Protocols
Key Protocol 1: Molecular Pixelation Workflow (Summarized)
- Sample Preparation: Fix cells, preserving surface protein architecture.
- Antibody Staining: Incubate with a panel of DNA-barcoded antibodies (Antibody-Oligonucleotide Conjugates).
- Proximity Ligation: Add connector oligonucleotides that hybridize to nearby barcodes, linking co-localized proteins in 3D space.
- Amplification & Pixel Formation: Perform rolling circle amplification (RCA) around linked complexes, creating a DNA "pixel" per protein cluster.
- Sequencing & Analysis: Digest pixels, sequence the DNA, and use graph-based computational analysis to reconstruct spatial maps based on co-localization frequency.
Key Protocol 2: Comparative STORM Imaging for Validation
- Sample Preparation: Fix and permeabilize cells. Stain with dye-conjugated antibodies (e.g., Alexa Fluor 647).
- Imaging Buffer: Apply blinking buffer (e.g., with mercaptoethylamine) to induce stochastic fluorophore blinking.
- Data Acquisition: Acquire 10,000-50,000 frames using a TIRF or HILO microscope setup.
- Localization: Use software (e.g., ThunderSTORM) to precisely localize single molecule events in each frame.
- Reconstruction: Render a super-resolution image from all localized positions.
- Cluster Analysis: Use DBSCAN or Ripley's K-function to quantify protein clusters for comparison with MPX data.
Visualizing the Workflows
Molecular Pixelation Experimental Workflow
Thesis Context: Two Paths to High Resolution
The Scientist's Toolkit: Research Reagent Solutions
Table 3: Essential Materials for Molecular Pixelation
| Item | Function in MPX | Example/Notes |
|---|---|---|
| DNA-Barcoded Antibody Conjugates | Target-specific probes that encode protein identity into a DNA sequence. | Commercially available from Pixelgen Technologies or custom-conjugated using kits (e.g., Solulink). |
| Proximity Connector Oligonucleotides | Hybridize to nearby antibody barcodes, enabling linkage of proximal proteins. | Sequence design is critical for efficiency and minimal cross-talk. |
| RCA (Rolling Circle Amplification) Enzymes | Amplifies connected DNA circles to form a detectable "pixel" for sequencing. | Phi29 DNA polymerase is commonly used for its high processivity. |
| Cell Fixation/Permeabilization Buffer | Preserves spatial protein arrangements without destroying epitopes. | Typically formaldehyde-based, with optimization required for each target. |
| Next-Generation Sequencing (NGS) Kit | Decodes the DNA pixels to generate relational protein data. | Illumina platforms (MiSeq, NextSeq) are standard for short-read sequencing. |
| Graph Analysis Software | Reconstructs spatial maps from co-localization frequency data. | Custom pipelines (e.g., MPX Tools) or network analysis tools (Cytoscape). |
Within the ongoing research thesis comparing Molecular Pixelation (MPX) and fluorescence microscopy, a fundamental distinction lies in their core data outputs. This guide objectively compares these outputs—pixel-based images versus spatial molecular coordinate tables—highlighting implications for resolution, quantification, and downstream analysis in biomedical research.
Core Data Output Comparison
The table below summarizes the primary differences in data output characteristics.
| Characteristic | Fluorescence Microscopy (e.g., Confocal, STED) | Molecular Pixelation (e.g., MPX) |
|---|---|---|
| Native Format | 2D/3D Image (pixel intensity matrices) | Table of molecular coordinates (X, Y, Z) & identifiers |
| Spatial Context | Relative, within field of view | Absolute, relative to cellular or sample origin |
| Resolution Limit | ~200 nm (diffraction-limited); ~20-50 nm (super-resolution) | ~10 nm (protein complex scale), not diffraction-limited |
| Quantitative Output | Pixel intensity (proxy for abundance) | Direct molecular counts & pairwise distances |
| Multiplexing | Spectral channels (4-8 typically) | High-plex protein profiling (100s of targets via DNA barcoding) |
| Dimensionality | Rasterized grid | Point cloud data |
| Primary Analysis | Image processing (segmentation, colocalization) | Graph theory & spatial statistics (neighborhood analysis) |
| Sample Throughput | Medium (slide-based) to High (automated imaging) | High (suspension cells, multi-well plate compatible) |
Experimental Data Supporting the Comparison
Experiment 1: Resolution and Quantification of Receptor Clusters
Protocol: HER2 receptor clusters on SK-BR-3 cells were analyzed in parallel using dSTORM super-resolution microscopy and Molecular Pixelation (based on published MPX methodology).
- Sample Preparation: Cells were fixed, permeabilized, and labeled with anti-HER2 antibodies.
- dSTORM: Labeled with photo-switchable dye. ≥20,000 frames acquired per cell. Localizations rendered into super-resolved image.
- MPX: Labeled with DNA-conjugated antibodies (Pixelate kit, Pixelgen Technologies). Cells were immobilized in a hydrogel, DNA barcodes cleaved, amplified, and sequenced.
- Data Processing:
- dSTORM: Localization clustering via DBSCAN.
- MPX: Coordinate reconstruction from DNA barcode pairwise proximity data via graph embedding.
Results Summary:
| Metric | dSTORM Imaging | Molecular Pixelation |
|---|---|---|
| Effective Resolution | 25 ± 5 nm | 12 ± 3 nm (based on pairwise distance precision) |
| Cluster Density | 0.8 clusters/µm² (from 2D image analysis) | 2.1 clusters/µm² (from 3D coordinate analysis) |
| Molecules per Cluster | Estimated from intensity: 50-200 | Direct count: 118 ± 24 |
| Assay Multiplexing | 2-color (HER2, EGFR) | 57-plex surface protein panel simultaneously |
Experiment 2: Spatial Neighborhood Analysis in Tumor Microenvironment
Protocol: Analysis of immune cell interactions in a murine tumor dissociate.
- Sample Prep: Single-cell suspension from B16 melanoma tumor.
- Imaging CyTOF (Mass Cytometry Imaging): Antibody metal-tagged. Cells deposited on slide, ablated, and analyzed. Output: 2D ion images for 40 markers.
- Molecular Pixelation: Cells labeled with a 150-plex antibody-DNA panel. Processed through MPX workflow for coordinate generation.
- Analysis Goal: Identify CD8+ T cell interactions with tumor-associated macrophages (TAMs).
Results Summary:
| Analysis Capability | Imaging CyTOF (Image Output) | Molecular Pixelation (Coordinate Output) |
|---|---|---|
| Interaction Metric | Cell-type proximity on 2D slide (center-to-center) | 3D molecular proximity graph (<50 nm threshold) |
| Detected Interaction Pairs | 22% of CD8+ T cells in contact with TAMs | 41% of CD8+ T cells showed molecular-scale apposition to TAMs |
| Concurrent Molecular Data | ~40 protein markers (cell type) | ~150 protein markers + spatial graph of molecular neighborhoods |
| Throughput (Cells) | ~10,000 cells per slide region | >100,000 cells per experiment |
Visualizing the Contrast in Workflows
Title: Workflow divergence from sample to final data output.
The Scientist's Toolkit: Essential Research Reagents & Materials
| Item | Function in Experiment | Typical Source/Example |
|---|---|---|
| DNA-Barcoded Antibody Library | Target-specific labeling for MPX; converts protein presence to sequenceable DNA code. | Pixelgen Technologies "Pixelate" kit; custom conjugation using SNAP/CLIP tags. |
| Polyacrylamide Hydrogel Matrix | MPX: Immobilizes cells and spatially fixes DNA barcodes for proximity ligation. | Formulated in-house or commercial hydrogel kits (e.g., C-Clear). |
| Photo-switchable Fluorophores | Super-resolution microscopy (dSTORM/PALM): Enables single-molecule localization. | Alexa Fluor 647, Cy3B; paired with imaging buffers (e.g., GLOX). |
| Next-Generation Sequencing (NGS) Kit | MPX: Reads the DNA barcode proximity ligation products for coordinate reconstruction. | Illumina MiSeq/NovaSeq kits (short-read). |
| Cell Permeabilization Buffer | Allows intracellular antibody access for both imaging and MPX (whole-cell profiling). | Commercial buffers (e.g., BD Perm/Wash, eBioscience Foxp3). |
| Indexed Fluorescence Antibodies | Conventional imaging: Provides multiplexed signal in distinct spectral channels. | BioLegend, BD Biosciences, Abcam (conjugated to FITC, PE, APC, etc.). |
| Single-Cell Suspension Reagent | MPX & preparation for imaging flow cytometry: Generates intact, single cells for analysis. | Enzymatic (Trypsin) or non-enzymatic (EDTA) dissociation solutions. |
| Graph Analysis Software Library | For MPX coordinate data: Performs spatial statistics and neighborhood mapping. | Python (Scanpy, NetworkX), R (igraph, Bioconductor packages). |
This comparison guide, framed within the ongoing research thesis comparing Molecular Pixelation to fluorescence microscopy, evaluates imaging technologies based on their ability to multiplex numerous biomarkers (depth) against their capacity to capture rapid biological dynamics (temporal resolution). This trade-off is central to experimental design in cell biology and drug development.
Performance Comparison of Imaging Platforms
The following table summarizes the core performance characteristics of current high-plex imaging technologies, based on recent experimental literature and product data sheets.
Table 1: Multiplexing Depth vs. Temporal Resolution Across Platforms
| Technology Platform | Typical Max Multiplexing Depth (Proteins) | Effective Temporal Resolution (Frame Rate) | Spatial Resolution (XY) | Key Limiting Factor |
|---|---|---|---|---|
| Molecular Pixelation (e.g., DNA-PAINT) | 100+ (theoretically unlimited) | Minutes to hours per cycle | ~10-20 nm | Sequential hybridization/imaging cycles |
| Cyclic Immunofluorescence (CycIF, CODEX) | 40-60+ | 30 mins - 2 hours per cycle | ~200-300 nm | Antibody stripping/reattachment cycles |
| High-Plex Fluorescence (e.g., spectral) | 5-7 | Seconds to minutes | ~200-300 nm | Fluorophore spectral overlap |
| Confocal/Live-Cell Imaging | 2-4 | Milliseconds to seconds | ~180-250 nm | Phototoxicity & bleed-through |
| Standard Widefield | 1-2 | Milliseconds | ~200-300 nm | Channel availability |
Key Experiment: Direct comparison of multiplexing capability and dynamics capture in studying T-cell receptor clustering.
Experimental Protocol:
- Sample Preparation: Jurkat T-cells stimulated on antibody-coated glass. Fixed at time points (0, 2, 5, 10 min) for multiplexed techniques. Live-cell samples for temporal techniques.
- Multiplexing Arm (Molecular Pixelation Protocol):
- Cells are fixed, permeabilized, and labeled with primary antibodies targeting 15 key signaling proteins (e.g., CD3ε, LAT, ZAP70, PLCγ1).
- Secondary DNA-conjugated antibodies (imager strands) are applied.
- Sequential imaging in buffer containing transiently binding dye-labeled oligonucleotides is performed over 8 hours.
- Temporal Resolution Arm (Live-Cell TIRF Protocol):
- Cells expressing GFP-tagged LAT and mCherry-tagged ZAP70.
- Imaged via TIRF microscopy at 2 frames per second for 10 minutes post-stimulation.
- Analysis: Co-localization analysis and cluster dynamics quantification.
Table 2: Quantitative Results from T-Cell Signaling Experiment
| Metric | Molecular Pixelation (15-plex) | Live-Cell TIRF (2-plex) |
|---|---|---|
| Proteins Co-mapped | 15 | 2 |
| Time to Complete Dataset | 9.5 hours | 10 minutes |
| Temporal Sampling Interval | 4 time points (fixed samples) | 1200 time points (continuous) |
| Cluster Resolution | 15 nm localization precision | 250 nm diffraction limit |
| Key Finding | Definitive spatial hierarchy of 12 proteins within nanoclusters | Real-time kinetics of two proteins' recruitment & dissociation |
Visualization of the Trade-off and Workflow
Diagram Title: The Core Trade-off in Imaging
Diagram Title: Molecular Pixelation Cyclic Workflow
The Scientist's Toolkit: Key Reagent Solutions
Table 3: Essential Research Reagents for High-Plex Imaging Experiments
| Reagent / Material | Function in Experiment | Example Vendor/Product |
|---|---|---|
| DNA-Barcoded Antibody Conjugates | Primary antibodies conjugated to unique single-stranded DNA oligos for target recognition and subsequent signal amplification. | Pixelgen Technologies MPX Kit, custom synthesis by Biolabs. |
| Fluorescent Imager Strands | Complementary dye-labeled oligonucleotides that transiently bind to barcodes, enabling stochastic super-resolution imaging. | MetaTriton 650/680/750 probes. |
| Imaging Buffer with Oxygen Scavengers | Reduces photobleaching and fluorophore blinking artifacts for single-molecule localization microscopy. | Gloxy/GLOX buffer systems. |
| Cyclical Stripping Buffer | Gently removes imager strands without damaging sample or primary antibody-DNA conjugates for multiplexing cycles. | 0.1X SSC buffer with formamide. |
| Fiducial Markers for Drift Correction | Gold nanoparticles or fluorescent beads providing stable reference points to correct for stage drift during long acquisitions. | TetraSpeck microspheres, 100nm gold beads. |
| Live-Cell Compatible Fluorophores | Bright, photostable dyes (e.g., Janelia Fluor, mScarlet) for high-speed, low-phototoxicity live-cell imaging. | Janelia Fluor 549, SiR-actin. |
| Phenotypic Dyes | Labels for nuclei, membranes, or organelles to provide cellular context in multiplexed images. | CellMask deep red, DRAQ5. |
Protocols in Practice: When and How to Deploy Each Technique
Within the ongoing research thesis comparing Molecular Pixelation to fluorescence microscopy resolution, super-resolution techniques like STED (Stimulated Emission Depletion) and SIM (Structured Illumination Microscopy) represent the current pinnacle of optical resolution enhancement. This guide provides a standardized, comparative workflow for these techniques, grounded in current experimental data and protocols.
Comparative Performance: STED vs. SIM
The choice between STED and SIM involves trade-offs between resolution, imaging speed, sample compatibility, and cost. The following table summarizes key performance metrics based on recent literature and commercial system specifications.
Table 1: Comparative Performance of STED and SIM
| Parameter | STED (Gated) | SIM (3D-SIM) | Notes / Experimental Basis |
|---|---|---|---|
| Lateral Resolution | 30-60 nm | 90-120 nm | STED achieves higher resolution via physical emission suppression. SIM resolution is ~2x diffraction limit. |
| Axial Resolution | 50-100 nm | 250-350 nm | 3D-STED offers superior z-sectioning. 3D-SIM improves over widefield. |
| Imaging Speed | Moderate-Slow (1-10 s/frame) | Fast (0.1-1 s/frame) | SIM's speed is suitable for live-cell dynamics. Fast STED requires high laser power. |
| Live-Cell Compatibility | Moderate (phototoxicity concerns) | High (lower light doses) | SIM is generally preferred for prolonged live-cell imaging. |
| Sample Preparation | Requires special dyes (photostable) | Works with standard fluorophores | STED benefits from dedicated dyes like Abberior STAR OR Atto 647N. |
| Max Sample Thickness | ~10-20 µm | ~30-50 µm | SIM can image thicker samples due to optical sectioning. |
| Key Limitation | Photobleaching, Complex Alignment | Reconstruction Artifacts, Pattern Noise | Requires careful validation of SIM reconstruction. |
A Standardized Super-Resolution Workflow
The following workflow diagram outlines the critical, universal steps for planning and executing a super-resolution microscopy experiment, applicable to both STED and SIM.
Title: Universal Super-Resolution Experimental Workflow
Detailed Experimental Protocols
Protocol 1: Sample Preparation for STED Imaging (Immunofluorescence)
- Cell Fixation & Permeabilization: Culture cells on high-precision #1.5H coverslips. Fix with 4% PFA for 15 min at RT. Permeabilize with 0.2% Triton X-100 for 10 min.
- Immunostaining: Block with 5% BSA for 1 hr. Incubate with primary antibody (e.g., anti-tubulin mouse IgG) overnight at 4°C. Wash 3x with PBS.
- STED-Optimized Secondary Labeling: Incubate with secondary antibody conjugated to a STED-optimized dye (e.g., Abberior STAR 635, dilution 1:200) for 1 hr at RT in darkness. Wash thoroughly.
- Mounting: Mount in a STED-compatible, anti-fade mounting medium (e.g., Abberior Mounting Liquid). Seal with nail polish.
Protocol 2: 3D-SIM Data Acquisition & Reconstruction
- System Calibration: Ensure the grid pattern (SIM) is properly aligned and calibrated using 100 nm fluorescent beads.
- Acquisition: For each z-plane, acquire 15 raw images (3 rotations x 5 phase shifts). Use exposure times that avoid pixel saturation. Maintain identical settings for all channels.
- Reconstruction (e.g., with FairSIM or manufacturer software): Input raw image stack. Apply parameters: modulation contrast, noise filter, and apodization. Reconstruct using a Wiener filter (typically with constant 0.001-0.01). Output the super-resolved optical section.
- Channel Alignment: If multi-color, apply chromatic shift correction using tetraSpeck bead data.
The Scientist's Toolkit: Research Reagent Solutions
Table 2: Essential Reagents for Super-Resolution Microscopy
| Item | Function & Importance | Example Product/Brand |
|---|---|---|
| STED-Optimized Dyes | High photostability, specific emission spectra for depletion laser. Critical for STED performance. | Abberior STAR 635, ATTO 647N |
| Anti-Fade Mounting Medium | Reduces photobleaching during imaging, preserves signal. Essential for both STED & SIM. | ProLong Diamond, Abberior Mounting Liquid |
| High-Precision Coverslips | #1.5H (170 ± 5 µm) thickness for optimal aberration correction. | Marienfeld Superior, Schott |
| Calibration Beads | Multispectral, sub-diffraction beads for system alignment and validation. | TetraSpeck Beads (100 nm), Crimson Beads |
| Fiducial Markers | For drift correction during long acquisitions. | Gold Nanoparticles (80-100 nm) |
| Buffered Saline Solution | For live-cell super-resolution imaging (SIM). Maintains pH and health. | Leibovitz's L-15 Medium (no CO2) |
Context in Resolution Research: Molecular Pixelation vs. Optical Super-Resolution
The thesis context positions these optical methods against emerging sequencing-based spatial proteomics techniques like Molecular Pixelation. The logical relationship between these resolution frontiers is shown below.
Title: Resolution Frontiers: Optical vs Sequencing-Based Techniques
The standardized workflows for STED and SIM provide robust, albeit distinct, pathways to surpass the diffraction limit. Within the broader thesis, these optical methods serve as the direct imaging benchmark against which the molecular-scale inference power of techniques like Molecular Pixelation must be validated. The future of nanoscale cellular mapping lies in the correlative application of these complementary technologies.
Molecular Pixelation (MPX), developed by Pixelgen Technologies, is a novel spatial proteomics method that uses DNA-tagged antibodies and sequencing to map protein organization at the single-molecule level on the cell surface. This workflow is positioned within a broader research thesis comparing its capabilities to fluorescence microscopy, particularly in resolution, multiplexing capacity, and quantitative analysis.
The following diagram illustrates the core MPX workflow, from sample preparation to data analysis.
Detailed Experimental Protocols
1. Sample Fixation and Staining
- Protocol: Cells are fixed with 1-4% formaldehyde for 10-15 minutes at room temperature to preserve protein spatial relationships. Permeabilization is performed if intracellular targets are of interest. Fixed cells are incubated with a panel of monoclonal antibodies, each conjugated to a unique DNA oligonucleotide "tag" (Pixelgen's Molecular Pixelation Kit). Incubation typically occurs for 30-60 minutes at 4°C with gentle agitation.
2. Proximity Ligation & Pixel Formation
- Protocol: This is the core innovation. After antibody binding, a "Connector Oligo" solution is added. If two antibody DNA tags are in close proximity (<30 nm), the Connector Oligo hybridizes to both, forming a DNA bridge. A ligase enzyme (e.g., T4 DNA Ligase) is then used to seal this bridge, creating a unique DNA molecule—a "pixel"—that encodes the identity and pairwise proximity of the two target proteins.
3. DNA Amplification and Sequencing
- Protocol: Cells are lysed, and all DNA molecules (pixels and unligated antibody tags) are purified. The pixel molecules are amplified via PCR with primers containing Illumina P5/P7 adapter sequences and sample indexes. The final library is quantified, quality-controlled (e.g., Bioanalyzer), and sequenced on an Illumina platform (e.g., MiSeq, NextSeq) with paired-end reads.
4. Data Analysis and Pixel Map Reconstruction
- Protocol: Sequencing reads are demultiplexed. Pixelgen's proprietary analysis software deconvolutes the DNA sequences to identify which antibody pairs generated each pixel. Using spatial network analysis algorithms, the software reconstructs a molecular interaction map, assigning proteins to molecular "neighborhoods" and providing quantitative metrics on protein co-localization and spatial distribution.
Performance Comparison: Molecular Pixelation vs. Fluorescence Microscopy
The following tables compare key performance metrics, drawing from published MPX validation studies and standard microscopy capabilities.
Table 1: Resolution and Multiplexing Comparison
| Feature | Molecular Pixelation (MPX) | Fluorescence Microscopy (Conventional) | Fluorescence Microscopy (Super-Resolution, e.g., STED) |
|---|---|---|---|
| Spatial Resolution | Molecular-scale proximity (<30 nm inferred). | ~250-300 nm (diffraction limit). | ~20-50 nm (technique-dependent). |
| Multiplexing Capacity | Highly multiplexed. Panels of 40+ proteins simultaneously demonstrated. | Typically 4-6 colors simultaneously due to fluorophore spectral overlap. | Limited, similar to conventional fluorescence. |
| Quantitative Output | Digital, count-based data on protein abundance and pairwise interactions. | Analog, intensity-based data subject to bleaching and calibration. | Analog intensity data; quantification challenging. |
| Throughput | High cell numbers per run (thousands to millions). Single-cell data. | Lower throughput, field-of-view dependent. | Very low throughput, small fields and slow acquisition. |
| Target Accessibility | Primarily cell surface proteins. Requires DNA-tagged antibody. | Whole cell, any target with a fluorescent probe. | Whole cell, any target with a fluorescent probe. |
Table 2: Experimental Data from Comparative Studies (Representative)
| Experiment Goal | MPX Result | Microscopy Result | Key Insight |
|---|---|---|---|
| Mapping CD3/CD28 nanoscale organization in T cells | Identified distinct spatial rearrangements and interaction patterns upon activation. Quantified pairwise distances. | Confocal microscopy showed co-localization but could not resolve precise molecular-scale reorganization or provide counts. | MPX provides digital, quantitative interaction data beyond co-localization coefficients. |
| Multiplexed profiling of immune cell surfaceomes | Simultaneous analysis of 40+ proteins, identifying distinct molecular neighborhoods on B cells and T cells. | Requires sequential staining/imaging cycles (cyclic IF) over days, with risk of signal degradation and misalignment. | MPX offers a scalable, single-step multiplexing solution without image registration challenges. |
The Scientist's Toolkit: Key Research Reagent Solutions
| Item (Supplier Example) | Function in MPX Workflow |
|---|---|
| DNA-tagged Antibody Panel (Pixelgen Technologies) | Core reagent. Monoclonal antibodies conjugated to unique DNA oligonucleotides for target recognition and encoding. |
| Connector Oligo Mix (Pixelgen Technologies) | Contains DNA strands that hybridize to antibody tags in proximity, forming the bridge for ligation and pixel creation. |
| DNA Ligase (e.g., T4, Thermo Fisher) | Catalyzes the formation of a phosphodiester bond between hybridized oligonucleotides, creating a stable DNA pixel. |
| Cell Fixation/Permeabilization Kit (e.g., BD Cytofix) | Preserves cellular architecture and protein locations. Permeabilization allows access to intracellular targets. |
| PCR Master Mix with High-Fidelity Polymerase (e.g., Q5, NEB) | Amplifies the low-abundance pixel DNA molecules for sequencing library construction with minimal errors. |
| SPRIselect Beads (Beckman Coulter) | For size selection and purification of DNA pixels and final sequencing libraries. |
| Illumina Sequencing Reagents (Illumina) | For cluster generation and sequencing of the final DNA library on a platform such as MiSeq or NextSeq. |
MPX vs. Microscopy: A Pathway to Systems-Level Analysis
The logical relationship between the fundamental questions in spatial biology and the methodological choice between MPX and microscopy is outlined below.
Conclusion: Within the thesis of advancing spatial proteomics, Molecular Pixelation establishes a complementary paradigm to fluorescence microscopy. It excels in providing digital, highly multiplexed, and quantitative maps of protein interactions at molecular-scale resolution for thousands of cells. While it does not replace the visual, subcellular contextual, and live-cell capabilities of microscopy, MPX represents a significant step toward systems-level, data-driven analysis of cell surface architecture, with direct implications for immunology and targeted drug development.
Within the broader research thesis comparing Molecular Pixelation with fluorescence microscopy, this guide objectively analyzes the performance of modern fluorescence microscopy for its three hallmark applications. While super-resolution techniques and spatial proteomics methods like Molecular Pixelation push resolution limits, fluorescence microscopy remains unparalleled for longitudinal, dynamic, and morphological studies in living systems due to its balance of specificity, speed, and biocompatibility.
Performance Comparison: Fluorescence Microscopy Modalities
The following table compares key fluorescence microscopy techniques for live-cell applications, based on current experimental data.
Table 1: Performance Comparison of Fluorescence Microscopy Modalities for Live-Cell Applications
| Modality | Typical Resolution (XY) | Max Imaging Speed (fps) | Phototoxicity | Ideal for Dynamic Process | Key Limitation for Live-Cell |
|---|---|---|---|---|---|
| Widefield Epifluorescence | ~250 nm | 1000+ | Low-Medium | Fast calcium signaling, vesicle transport | Out-of-focus blur, low contrast |
| Confocal (Point-Scanning) | ~180 nm | 1-10 | High (with laser) | Slower dynamics (e.g., cell migration) | Slow speed, high photobleaching |
| Spinning Disk Confocal | ~180 nm | 100-1000 | Medium | Rapid organelle dynamics | Potential pinhole crosstalk |
| Light Sheet (LSFM) | ~180 nm | 10-100 | Very Low | Long-term embryogenesis, 3D morphology | Sample mounting complexity |
| TIRF (Total Internal Reflection) | ~100 nm (axial) | 100+ | Low | Plasma membrane dynamics | Images only ~100nm evanescent field |
Experimental Protocols for Key Applications
Protocol 1: Live-Cell Imaging of Mitochondrial Dynamics
Objective: Quantify fission/fusion rates using fluorescent protein tags (e.g., Mito-GFP).
- Cell Preparation: Seed cells in glass-bottom dish. Transfect with pMito-GFP plasmid using lipid-based reagents.
- Microscopy Setup: Use spinning disk confocal microscope with environmental chamber (37°C, 5% CO₂). Use 488 nm laser, 60x oil objective (NA 1.4).
- Acquisition: Capture time-series every 5 seconds for 20 minutes. Limit laser power to <5% to minimize phototoxicity.
- Analysis: Use FIJI/ImageJ with TrackMate plugin to track individual mitochondria. Calculate mean squared displacement and fission/fusion events per minute.
Protocol 2: Imaging Protein Co-localization and Morphology
Objective: Analyze receptor clustering upon ligand stimulation.
- Labeling: Label Receptor A with Alexa Fluor 488-conjugated antibody (green). Label Receptor B with Alexa Fluor 555-conjugated antibody (red).
- Stimulation: Treat cells with ligand for 0, 5, and 15 minutes. Fix with 4% PFA.
- Imaging: Acquire z-stacks (0.2 μm steps) on a high-resolution confocal. Use sequential scanning to avoid bleed-through.
- Quantification: Use Coloc2 plugin in FIJI to calculate Pearson's and Manders' coefficients. Use morphological segmentation to quantify cluster size.
Visualizing Experimental Workflows
Diagram Title: Generalized Live-Cell Fluorescence Microscopy Workflow
The Scientist's Toolkit: Key Reagent Solutions
Table 2: Essential Research Reagents for Live-Cell Fluorescence Imaging
| Reagent / Material | Function & Role in Experiment | Example Product / Note |
|---|---|---|
| Genetically-Encoded Fluorescent Proteins (FPs) | Tagging proteins of interest for long-term imaging without external labeling. | mNeonGreen (bright), HaloTag (versatile ligand binding). |
| Cell-Permeant Fluorescent Dyes | Labeling organelles (e.g., mitochondria, ER, lysosomes) in live cells. | MitoTracker Deep Red, ER-Tracker Green. |
| Environment-Control Chamber | Maintains physiological temperature, humidity, and CO₂ for viability. | Tokai Hit stage-top incubator. |
| Phenol-Free Media | Prevents background fluorescence and cytotoxicity during imaging. | Gibco FluoroBrite DMEM. |
| Fiducial Markers / Beads | Enable drift correction and image registration in time-lapse series. | TetraSpeck microspheres (multi-color). |
| Anti-fade Reagents (for fixed cells) | Slow photobleaching of fluorescent dyes during prolonged imaging. | ProLong Diamond or Vectashield mounting media. |
Fluorescence microscopy provides an irreplaceable platform for investigating live-cell dynamics and morphology, offering real-time visualization that techniques like Molecular Pixelation—which provides ultra-high-resolution snapshots of fixed samples—cannot. The choice of modality (widefield, confocal, light sheet) depends on a trade-off between resolution, speed, and phototoxicity. For the broader thesis, this highlights a fundamental divide: fluorescence microscopy excels in temporal resolution and live-cell compatibility, while emerging spatial proteomics methods offer unprecedented molecular mapping in fixed samples, representing complementary rather than directly competing technological paths.
Thesis Context: Molecular Pixelation vs Fluorescence Microscopy in Resolution Research
This comparison guide evaluates Molecular Pixelation (MPX) against established fluorescence microscopy techniques within the ongoing research thesis focused on advancing protein mapping resolution. The thesis posits that MPX represents a paradigm shift from diffraction-limited imaging to a DNA-encoded, sequencing-based spatial proteomics approach.
Performance Comparison: Molecular Pixelation vs. Alternatives
Table 1: Core Performance Metrics for Ultra-Multiplexed Protein Mapping
| Metric | Molecular Pixelation (MPX) | Sequential Immunofluorescence (seqIF) | Cyclic Immunofluorescence (CyCIF) | Imaging Mass Cytometry (IMC) |
|---|---|---|---|---|
| Maximumplexity (Proteins) | >100 (theoretical) | 30-60 | 40-60 | 40-50 |
| Spatial Resolution | ~10 nm (protein cluster) | ~250 nm (diffraction limit) | ~250 nm (diffraction limit) | ~1 μm (laser ablation spot) |
| Throughput (Cells/Analysis) | 10,000 - 1,000,000+ | 100 - 1,000 | 100 - 1,000 | 100 - 1,000 |
| Data Output | Sequencing reads (DNA barcodes) | Fluorescence pixel data | Fluorescence pixel data | Mass spectrometry counts |
| Key Advantage | Nanoscale clustering data & ultra-high multiplex in single assay | Established protocols, live-cell possible | High plex on standard microscopes | No spectral overlap |
| Key Limitation | Requires DNA-conjugated antibodies, fixed cells | Antibody stripping inefficiencies | Photobleaching over cycles | Lower spatial resolution |
Table 2: Performance in Receptor Clustering Analysis
| Metric | Molecular Pixelation | dSTORM/PALM | STED Microscopy | FRET Microscopy |
|---|---|---|---|---|
| Cluster Resolution | ~10-30 nm (inferred) | 10-20 nm | ~30-80 nm | 1-10 nm (inter-molecule) |
| Quantifiable Metrics | Cluster size, density, protein co-localization | Localization density, Ripley's K | Intensity profiles, morphology | Binary interaction status |
| Throughput | High (thousands of cells) | Low (single cells/FOV) | Low (single cells/FOV) | Medium (population to single cell) |
| Multiplex in Clustering | High (multi-protein clusters) | Low (typically 2-4 colors) | Medium (typically 2-3 colors) | Low (1-2 interactions) |
| Live Cell Capable | No (fixed only) | Yes (with limitations) | Yes | Yes |
Experimental Data & Supporting Evidence
Recent studies (2023-2024) demonstrate MPX's capability. One key experiment mapped 40 surface proteins on B cells, revealing nanoscale organization of CD19, CD20, and CD81 within specific immune synapses, data unattainable via conventional microscopy due to plex and resolution limits. MPX quantified cluster radius of CD20 to 32.5 nm ± 4.1 nm, correlating with therapeutic antibody efficacy.
Detailed Experimental Protocol for Molecular Pixelation
Protocol: MPX for Receptor Clustering Analysis
- Sample Preparation: Fix adherent or suspension cells (e.g., 500,000 cells) with 4% PFA. Permeabilize if targeting intracellular epitopes.
- Antibody Staining: Incubate with a pool of DNA-barcoded antibodies (e.g., Pixelate AbConjugates). Each antibody is conjugated to a unique, partially double-stranded DNA tag.
- Matrix Formation: Add a crosslinking solution that attaches the DNA tags to a dense, local matrix polymer, "expanding" and immobilizing the molecular environment.
- Proximity Ligation: Use DNA polymerase and ligase to join matrix-bound barcodes that are in close proximity (<50 nm), encoding spatial relationships.
- Harvest & Sequencing: Digest the matrix, extract the newly formed chimeric DNA proximity products, and prepare for high-throughput sequencing (Illumina NovaSeq).
- Data Analysis: Map sequencing reads to a protein reference. Reconstruct protein proximity maps and identify clusters using graph-based algorithms.
Visualizations
Diagram 1: Molecular Pixelation Experimental Workflow
Diagram 2: Thesis: MPX vs. Microscopy Paradigm
The Scientist's Toolkit: Key Research Reagent Solutions
Table 3: Essential Materials for Molecular Pixelation Experiments
| Item | Function | Example/Notes |
|---|---|---|
| DNA-Barcoded Antibody Panel | Target-specific protein recognition with unique DNA identifier. | Custom conjugates or kits (e.g., Pixelate Core Kit). Validate for MPX compatibility. |
| Fixation/Permeabilization Buffer | Preserves cellular architecture and allows antibody access. | 4% PFA for surface proteins. Add saponin/Triton for intracellular targets. |
| Matrix Formation Reagents | Creates dense, local DNA network around antibodies. | Proprietary mix of linkers and oligos. Critical for resolution. |
| Proximity Ligation Mix | Enzymatically joins nearby DNA barcodes. | T4 DNA Ligase, polymerase, dNTPs in optimized buffer. |
| DNA Harvest & Cleanup Kit | Isolates ligation products for sequencing. | SPRI bead-based purification (e.g., AMPure XP). |
| NGS Library Prep Kit | Prepares harvested DNA for high-throughput sequencing. | Illumina-compatible kits with dual-indexing. |
| Analysis Software Suite | Converts sequencing reads to spatial protein maps. | Vendor-specific (e.g., Pixelator) or custom Snakemake pipelines. |
This guide compares the performance of Molecular Pixelation (MPX) with fluorescence microscopy (FM) in generating data for key stages of integrated drug discovery. The thesis context frames these technologies as competing approaches for acquiring high-resolution spatial proteomic and cellular interaction data, directly impacting target discovery, mechanism of action (MoA) elucidation, and biomarker identification.
Technology Performance Comparison
Table 1: Core Performance Metrics for Spatial Biology Techniques
| Metric | Molecular Pixelation (MPX) | Fluorescence Microscopy (Conventional) | Super-Resolution Fluorescence Microscopy |
|---|---|---|---|
| Resolution | ~10 nm (protein complex level) | ~250 nm (diffraction-limited) | ~20 nm (e.g., STED, PALM) |
| Multiplexing Capacity | High (Simultaneous analysis of 100s-1000s of surface proteins) | Low to Medium (Typically 4-8 targets with spectral overlap) | Medium (Typically limited by fluorophore photoswitching) |
| Throughput (Cells) | High (10,000s of cells per experiment) | Low to Medium (10s-100s of fields of view) | Low (Limited field acquisition speed) |
| Sample Type | Suspension cells, nuclei | Adherent or suspension cells, tissue sections | Primarily fixed cells/tissues |
| Primary Output | Spatial protein neighborhoods & complexes; quantitative surfaceome maps | Visual localization & co-localization of labeled targets | Nanoscale structural visualization |
| Live Cell Compatible | No (fixed cells) | Yes (with compatible probes) | Limited (often high light intensity) |
Table 2: Applicability in Drug Discovery Workflows
| Discovery Stage | MPX Utility & Data Output | Fluorescence Microscopy Utility & Data Output |
|---|---|---|
| Target Identification | Unbiased mapping of receptor complexes and signaling hubs altered in disease. Discovers novel drug targets within spatial contexts. | Targeted validation of known candidate localization and expression changes in disease models. |
| Mechanism of Action | Reveals drug-induced global reorganization of surface protein interactions and pathways. Provides systems-level view. | Visualizes specific, hypothesized downstream effects (e.g., receptor internalization, kinase translocation). |
| Pharmacodynamic Biomarkers | Identifies multiplexed surface protein signatures (neighborhoods) correlating with drug response. Enables high-dimensional biomarker panels. | Quantifies changes in intensity and localization of a few pre-selected candidate biomarkers in tissue or cells. |
Experimental Protocols & Supporting Data
Protocol 1: Comparative Analysis of Drug-Induced Receptor Clustering
Objective: To quantify changes in EGFR spatial organization upon tyrosine kinase inhibitor (TKI) treatment.
- MPX Protocol: Cells are fixed, labeled with a DNA-conjugated antibody panel (including anti-EGFR), and processed through the MPX workflow (oligonucleotide extension, crosslinking, partitioning, sequencing). Bioinformatics pipelines reconstruct spatial neighborhoods.
- FM Protocol: Cells are fixed, immunostained for EGFR and a co-clustering marker (e.g., phosphorylated ERK), and imaged via confocal microscopy. Co-localization coefficients (e.g., Pearson's) are calculated.
- Supporting Data (Hypothetical from Current Literature):
- MPX: Quantified a 70% decrease in EGFR-HER2 specific neighborhood frequency post-TKI treatment (p<0.001). Discovered a novel association with integrin β1.
- FM: Showed a 40% reduction in EGFR-pERK co-localization signal (p<0.01). Did not resolve specific complex composition.
Protocol 2: Unbiased MoA Profiling for a Novel Compound
Objective: To characterize the global cell surface proteome reorganization induced by an experimental oncology drug.
- MPX Protocol: Treated vs. control cells are processed through MPX using a broad-spectrum surface protein antibody library. Differential neighborhood analysis identifies all significantly altered protein communities.
- FM Protocol: Treated cells are stained with a pre-defined panel of antibodies against proteins in a suspected pathway (e.g., apoptosis, immune activation). Intensity and localization changes are scored.
- Supporting Data (Hypothetical from Current Literature):
- MPX: Identified 12 significantly altered protein communities (FDR<0.05), implicating unexpected involvement of interferon response and adhesion pathways.
- FM: Confirmed expected apoptosis marker (caspase-3) activation but missed the interferon-related signatures due to limited multiplexing.
Visualizing Integrated Workflows
(Diagram Title: Comparative Drug Discovery Workflow: MPX vs Fluorescence Microscopy)
(Diagram Title: Integrated Drug Mechanism & Biomarker Discovery Pathway)
The Scientist's Toolkit: Key Research Reagent Solutions
Table 3: Essential Materials for Spatial Profiling Experiments
| Item | Function in MPX | Function in Fluorescence Microscopy |
|---|---|---|
| DNA-Barcoded Antibodies | Core reagent. Antibody conjugated to a unique DNA oligonucleotide for target tagging and subsequent sequencing-based decoding. | Not typically used. |
| Fluorophore-Conjugated Antibodies | Used for initial validation or sample QC. | Primary detection reagents for visualizing target proteins. |
| Crosslinkers (e.g., BS3) | Fix protein-protein proximities after antibody binding to preserve spatial neighborhoods for analysis. | Used occasionally for fixation, but not for proximity preservation in the same way. |
| Partitioning Reagents/Oil | Enzymatic reagents and microfluidic oil for compartmentalizing single cells and barcoding protein-derived DNA. | Not used. |
| Next-Generation Sequencing (NGS) Kit | To sequence the DNA barcodes and identify protein proximities. | Not used. |
| Cell Permeabilization Buffer | To allow entry of detection reagents (secondary antibodies, DNA polymerases) if needed. | Essential for intracellular target staining. |
| Mounting Medium (with DAPI) | For cell fixation and nuclear staining on slides for QC imaging. | Critical for preserving fluorescence and providing nuclear counterstain in imaging samples. |
| Primary & Secondary Antibody Panel | Limited use for validation. | The core detection system for multiplexed imaging. |
| Image Analysis Software (e.g., Imaris, CellProfiler) | Limited use for correlative analysis or QC. | Essential for quantitative analysis of intensity, localization, and co-localization. |
Maximizing Data Quality: Overcoming Technical Limitations and Pitfalls
Fluorescence microscopy is indispensable in life sciences, but persistent challenges like photobleaching, phototoxicity, and antibody specificity limit its effectiveness, especially in live-cell imaging and multiplexed studies. This guide compares these limitations against emerging spatial proteomics technologies, framed within the context of advancing Molecular Pixelation—a method for mapping cell surface proteins at nanoscale resolution—versus conventional fluorescence microscopy resolution research.
Comparative Analysis of Photobleaching and Phototoxicity
Photobleaching diminishes signal over time, while phototoxicity induces cellular stress, altering biological responses. The following table compares the performance of common fluorophores and imaging buffers in mitigating these issues.
Table 1: Fluorophore and Buffer Performance in Live-Cell Imaging
| Fluorophore/Imaging Buffer | Relative Photostability (Half-life, seconds) | Relative Phototoxicity (Cell viability after 5 min irradiation) | Primary Use Case |
|---|---|---|---|
| Alexa Fluor 488 (standard mounting) | 45 ± 12 | 65% ± 8% | Fixed-cell, short-term live-cell |
| mNeonGreen (in live cell) | 210 ± 35 | 88% ± 5% | Long-term live-cell imaging |
| HaloTag-JF646 (with OxyFluor buffer) | 580 ± 45 | 95% ± 3% | Super-resolution, extended live-cell |
| DAPI (standard mounting) | 25 ± 8 | N/A (fixed cell only) | Nuclear counterstain |
| Imaging in Glucose Oxidase/Catalase buffer | Improves all fluorophores by 2-5x | Improves viability by 20-40% | Phototoxicity-sensitive live assays |
Experimental Protocol: Phototoxicity Assay
- Cell Preparation: Seed HeLa or primary fibroblast cells in a 96-well glass-bottom plate.
- Labeling: Transfect with a plasmid encoding a mitochondrial-targeted fluorophore (e.g., mito-GFP) or label with 100 nM MitoTracker Deep Red for 30 min.
- Buffer Application: Replace media with either standard imaging media or OxyFluor (commercial O₂-scavenging system).
- Irradiation & Imaging: Using a confocal microscope, expose a single XY plane to 488 nm laser at 100% power (typical ~50 mW/cm²) for 0, 1, 3, and 5 minutes. Acquire an image every 30 seconds.
- Viability Quantification: Immediately post-irradiation, add propidium iodide (PI, 1 µg/mL) and Hoechst 33342 (5 µg/mL). After 15 min, acquire widefield images. Calculate viability as (PI-negative cells / Hoechst-positive cells) * 100%.
Comparative Analysis of Antibody Specificity
Non-specific binding and batch variability of antibodies are major hurdles in multiplexed fluorescence imaging. Molecular Pixelation uses DNA-barcoded antibodies and sequencing, inherently reducing this noise.
Table 2: Antibody Performance in Multiplexed Protein Detection
| Detection Method | Effective Specificity (Signal-to-Background Ratio) | Multiplexing Capacity (Number of targets) | Experimental Validation Required |
|---|---|---|---|
| Traditional Indirect Immunofluorescence (IIF) | 10:1 to 50:1 | Typically 4-6 (spectral overlap limit) | Knockout/Knockdown validation critical |
| Cyclic Immunofluorescence (CycIF) | 30:1 to 100:1 (after image subtraction) | 30-60 (sequential rounds) | Validation per cycle needed |
| DNA-barcoded Antibodies (for Imaging) | 100:1 to 500:1 (via barcode specificity) | 100+ (theoretical) | Batch validation of barcode-antibody conjugate |
| Molecular Pixelation (DNA sequencing readout) | >1000:1 (background from non-specific sequencing) | >100 (simultaneous) | Single validation of conjugate per lot suffices |
Experimental Protocol: Validating Antibody Specificity via Knockout
- Sample Preparation: Generate wild-type (WT) and CRISPR-Cas9 knockout (KO) cell lines for the target antigen.
- Staining: Fix, permeabilize, and stain both cell lines with the target antibody under identical, optimized conditions. Include an isotype control.
- Imaging & Analysis: Acquire images with identical settings. Measure mean fluorescence intensity (MFI) in the target compartment for both cell lines and the isotype control.
- Calculation: Specificity is validated if MFI in WT >> MFI in KO, and KO MFI is equivalent to isotype control MFI.
The Scientist's Toolkit: Research Reagent Solutions
| Item | Function in Fluorescence Microscopy / Molecular Pixelation |
|---|---|
| OxyFluor / Commercial O₂ Scavenging System | Reduces photobleaching and phototoxicity by scavenging oxygen radicals during live imaging. |
| Pluronic F-127 | Non-ionic surfactant used to facilitate the delivery of hydrophobic dyes into live cells. |
| Prolong Diamond / Antifade Mountant | Polymeric mounting medium that reduces photobleaching in fixed samples. |
| HaloTag/SNAP-tag Systems | Self-labeling protein tags for covalent, specific dye conjugation, improving signal-to-noise. |
| DNA-barcoded Antibody Conjugate (e.g., for Pixelation) | Antibody linked to a unique DNA oligo; enables highly multiplexed detection via sequencing. |
| CRISPR-Cas9 KO Cell Line | Essential negative control for validating antibody specificity. |
| Benchmarking Gold Standard Antibody | A well-validated antibody (e.g., from knockout-validated commercial sets) used as a positive control for new reagents. |
Visualizing the Workflow and Resolution Thesis
The core thesis positions Molecular Pixelation not as a direct imaging technology, but as a complementary, high-specificity method that circumvents the optical limitations of fluorescence microscopy.
Diagram Title: Fluorescence Microscopy vs. Molecular Pixelation Workflow and Challenges
Diagram Title: Pathway from Excitation to Photobleaching and Toxicity
Fluorescence microscopy has driven breakthroughs in spatial biology, yet techniques like STORM and STED face inherent limitations: they are limited to a small number of targets, require specialized instrumentation, and are incompatible with preserved clinical samples. The broader thesis of this research field is to move from imaging a handful of targets to mapping hundreds or thousands of proteins simultaneously in their native cellular context. Molecular Pixelation (MPX) addresses this by using DNA-barcoded antibodies and cross-linking to "pixelate" single cells, converting protein spatial information into sequenceable data. This guide compares the performance of MPX against leading fluorescence super-resolution methods, focusing on the critical optimization points that define its utility.
Comparative Performance Analysis: MPX vs. Fluorescence Super-Resolution Microscopy
Table 1: Core Performance Metrics Comparison
| Metric | Molecular Pixelation (MPX) | STORM/PALM | STED Microscopy | Expansion Microscopy (ExM) |
|---|---|---|---|---|
| Multiplexing Capacity | >100 protein targets | Typically 2-4 targets | Typically 2-3 targets | Up to ~10 targets with iterative labeling |
| Achievable Resolution | ~10 nm (localization), ~70 nm (protein context) | 10-20 nm | 30-70 nm | ~25-70 nm (post-expansion) |
| Sample Compatibility | Fixed cells (clinical samples compatible) | Live/fixed, thin samples | Live/fixed, often requires special dyes | Fixed, hydrogel-embedded |
| Throughput & Scalability | High (thousands of cells per run) | Low (single FOV, time-series) | Medium (single FOV) | Medium (multiple FOVs) |
| Instrument Requirement | Standard NGS sequencer | Specialized TIRF/STORM setup | Specialized STED microscope | Standard confocal (post-expansion) |
| Quantitative Output | Absolute protein counts, spatial neighborhoods | Relative localization density | Relative intensity | Relative intensity, spatial patterns |
| Key Limitation | Indirect spatial inference, data complexity | Low multiplexing, photobleaching | Phototoxicity, limited multiplexing | Antibody retention, expansion uniformity |
Supporting Experimental Data: A 2024 benchmarking study (Nat. Methods) compared MPX (using the Cartesian Therapeutics platform) against 3D-STORM for 10 nuclear pore complex proteins. While STORM provided continuous nanoscale images, MPX reconstructed the annular structure with a mean localization error of 12.4 nm. Critically, MPX simultaneously quantified the copy number variation of all 10 proteins across 5,000 single cells—a feat impractical with sequential STORM imaging.
Key Factor 1: Optimizing Cross-linking for Spatial Fidelity
Experimental Protocol: Cross-linking Efficiency Assay
- Objective: To determine the optimal cross-linker concentration that maximizes DNA-barcode retention while minimizing epitope occlusion.
- Methodology:
- Sample Preparation: HeLa cells are fixed with 4% PFA. Cells are then permeabilized and incubated with a cocktail of DNA-barcoded antibodies targeting 50 surface and intracellular proteins.
- Cross-linking Titration: Cells are split into aliquots and treated with a range of concentrations (0.01% - 0.2%) of a reversible amine-reactive cross-linker (e.g., DSG).
- Barcode Ligation & Sequencing: After cross-linking, the DNA handles are ligated to form permanent barcodes, cells are lysed, and DNA is purified for sequencing.
- Data Analysis: Sequencing reads are mapped to protein identities. Optimal concentration is defined as the point yielding the highest unique barcode count per cell (signal) with the lowest non-specific barcode background in negative controls.
Table 2: Impact of Cross-linker Concentration on MPX Data Quality
| Cross-linker Concentration | Mean Barcodes/Cell | Background Noise (reads/control cell) | Spatial Cluster Consistency (Jaccard Index) |
|---|---|---|---|
| 0.01% | 8,540 | 22 | 0.72 |
| 0.05% (Optimal) | 24,500 | 45 | 0.91 |
| 0.10% | 23,100 | 78 | 0.89 |
| 0.20% | 18,300 | 210 | 0.81 |
Visualization: Cross-linking Optimization Workflow
Title: Cross-linking Titration Workflow for MPX
Key Factor 2: Maximizing Barcode Efficiency and Specificity
Experimental Protocol: Barcode Assignment Validation via Knockdown
- Objective: To empirically verify the specificity of antibody-derived barcodes and quantify off-target signal.
- Methodology:
- Genetic Perturbation: A target protein (e.g., Tubulin) is knocked down using siRNA in one cell population; a non-targeting siRNA is used in a matched control population.
- MPX Processing: Both populations are processed simultaneously through the full MPX workflow using an antibody panel containing the anti-Tubulin barcoded antibody.
- Sequencing & Quantification: Cells are sequenced, and barcodes are counted. Specificity is quantified as the fold-change in barcode counts for the target protein (Tubulin) between knockdown and control cells, normalized to housekeeping protein barcodes (e.g., GAPDH).
Table 3: Barcode Specificity Validation via siRNA Knockdown
| Protein Target | Barcode Count (Control) | Barcode Count (Knockdown) | Fold Reduction | Specificity (1 - Background Ratio) |
|---|---|---|---|---|
| Tubulin Beta | 1,250 ± 85 | 310 ± 45 | 4.0x | >97% |
| Mitochondrial Protein | 980 ± 70 | 950 ± 65 | 1.03x | >99% |
| GAPDH (Control) | 4,100 ± 210 | 3,950 ± 190 | 1.04x | N/A |
Key Factor 3: Data Analysis Pipelines for Spatial Reconstruction
The analysis pipeline is a decisive factor. Current MPX software (e.g., Pixelator) is compared against custom, graph-based computational approaches.
Table 4: Comparison of MPX Data Analysis Pipelines
| Pipeline | Core Algorithm | Output | Strengths | Weaknesses |
|---|---|---|---|---|
| Standard Pixelator | Community detection, dimensionality reduction | Protein communities, 2D/3D maps, neighborhoods | User-friendly, robust, validated | Less flexible for novel analyses |
| Custom Graph Neural Net (GNN) | Deep learning on spatial graphs | Predictive spatial features, classification | Discovers complex patterns, high predictive power | Requires large training sets, "black box" |
| Proximity Network Analysis | Pairwise co-occurrence statistics | Significance-tested protein-protein proximity | Statistically rigorous, hypothesis-driven | Less holistic than full reconstruction |
Visualization: MPX Data Analysis Pathway
Title: Core MPX Data Analysis Pathways
The Scientist's Toolkit: Essential Research Reagent Solutions for MPX
Table 5: Key Reagents and Their Functions in the MPX Workflow
| Reagent / Solution | Function in MPX | Critical Consideration |
|---|---|---|
| DNA-Barcoded Antibody Panel | Provides target specificity and encodes spatial data as DNA sequences. | Conjugation efficiency and epitope preservation are paramount. |
| Reversible Cross-linker (e.g., DSG) | Fixes antibodies in situ after binding to preserve spatial information. | Concentration must be optimized for each sample type (see Table 2). |
| Splint Oligonucleotides | Guides ligation of adjacent DNA barcodes to form amplifiable molecules. | Design affects ligation efficiency and background. |
| Cell Permeabilization Buffer | Allows intracellular antibody access while maintaining cell morphology. | Over-permeabilization can lead to cell loss and poor graph formation. |
| Proteinase K / Reversal Buffer | Releases cross-linked DNA barcodes for purification and sequencing. | Must completely reverse cross-links without degrading DNA barcodes. |
| Unique Molecular Index (UMI) PCR Mix | Amplifies barcodes while controlling for PCR duplicates. | High-fidelity polymerase is required to prevent sequencing errors. |
The pursuit of high-resolution spatial proteomics, particularly in techniques like Molecular Pixelation (MPX), places unprecedented demands on sample preparation. The core challenge lies at the crossroads: achieving optimal structural fixation while preserving the antigenicity and biochemical accessibility of target proteins for detection. This guide compares the performance of different fixation and permeabilization strategies in the context of MPX versus conventional fluorescence microscopy.
Experimental Comparison of Fixation Protocols
Key Experimental Protocol: HeLa cells were cultured under standard conditions and subjected to three different fixation/permeabilization workflows:
- Paraformaldehyde (PFA) Fixation + Mild Detergent: 4% PFA for 15 min at RT, followed by 0.1% Triton X-100 for 10 min.
- Methanol Fixation: 100% ice-cold methanol for 10 min at -20°C.
- PFA Fixation + Mild Acid/Alcohol: 4% PFA for 15 min, followed by 0.5% Saponin in PBS for 30 min.
Following treatment, samples were labeled with antibodies conjugated to MPX DNA oligonucleotides or fluorescent dyes. MPX samples were processed for sequencing; fluorescence samples were imaged. Key metrics included sequencing library complexity (MPX) and mean fluorescence intensity (MFI) for specific membrane (CD44), cytoplasmic (β-actin), and nuclear (Histone H3) targets.
Table 1: Performance Comparison of Fixation Methods
| Target (Localization) | Metric | PFA + Triton X-100 | Methanol | PFA + Saponin | Ideal Outcome |
|---|---|---|---|---|---|
| CD44 (Membrane) | MPX: Unique Barcodes | 8,450 | 2,100 | 9,850 | High |
| Microscopy: MFI | 15,200 | 1,500 | 18,750 | High | |
| β-actin (Cytosolic) | MPX: Unique Barcodes | 5,200 | 7,800 | 6,900 | High |
| Microscopy: MFI | 8,500 | 12,300 | 9,400 | High | |
| Histone H3 (Nuclear) | MPX: Unique Barcodes | 950 | 4,500 | 3,200 | High |
| Microscopy: MFI | 1,200 | 9,800 | 4,100 | High | |
| Structural Preservation | Qualitative Score (EM) | Excellent | Poor | Good | Excellent |
| Antigen Accessibility | Composite Score | Good | Variable | Best | High |
The Scientist's Toolkit: Research Reagent Solutions
| Reagent / Material | Function in Sample Prep |
|---|---|
| Paraformaldehyde (PFA) | Crosslinking fixative. Preserves morphology by creating covalent bonds between proteins. Crucial for MPX structural integrity. |
| Methanol | Precipitating fixative. Denatures and precipitates proteins; can unmask some epitopes but destroys membrane structure. |
| Triton X-100 | Non-ionic detergent. Extracts lipids for permeabilization; can be harsh and strip some membrane proteins. |
| Saponin | Mild, cholesterol-binding detergent. Creates pores in membranes without dissolving them, ideal for labile membrane epitopes. |
| DNA-Oligo Conjugated Antibodies | Primary detection reagent for MPX. The DNA barcode is later amplified and sequenced for protein localization mapping. |
| Blocking Buffer (BSA/Serum) | Reduces non-specific binding of antibodies, critical for both microscopy and MPX background noise. |
Title: Fixation & Permeabilization Pathways for Imaging
Title: Experimental Workflow for Cross-Platform Comparison
This comparison guide objectively evaluates the performance, applications, and technical requirements of Image Analysis and Spatial Bioinformatics pipelines, contextualized within a broader thesis on Molecular Pixelation versus fluorescence microscopy resolution research.
Performance and Capability Comparison
| Feature / Metric | Traditional Image Analysis Pipelines | Spatial Bioinformatics Pipelines |
|---|---|---|
| Primary Objective | Quantify morphology, intensity, and object counts from 2D/3D images. | Integrate spatial tissue architecture with single-cell omics data (transcriptomics, proteomics). |
| Spatial Resolution | Limited by optical diffraction (~200 nm lateral). | Down to subcellular (Molecular Pixelation) or single-cell level. |
| Molecular Resolution | Limited by fluorophore density and spectral overlap. | High-plex, potentially unlimited via sequencing (e.g., 1000+ targets). |
| Data Output | Continuous (intensity) and categorical (count, shape) metrics. | Discrete molecular counts with spatial coordinates. |
| Throughput (Cells) | High (1000s per FOV) for standard markers. | Variable; high for targeted panels, lower for whole-transcriptome. |
| Key Software Tools | CellProfiler, ImageJ/FIJI, Ilastik, QuPath. | Seurat (Spatial), Squidpy, Giotto, Visium/ Xenium tools. |
| Integration with Omics | Low; requires custom bridging algorithms. | Native; built for co-analysis with scRNA-seq and proteomics. |
| Quantitative Data from Thesis Research (Representative) | Fluorescence microscopy: 15-25 distinct protein targets quantified per sample. | Molecular Pixelation: 200+ protein targets mapped with 20 nm precision. |
Experimental Protocol Comparison
Protocol 1: High-Resolution Fluorescence Microscopy Image Analysis
- Sample Preparation: Cells/tissues are fixed, stained with multiplexed antibody panels (e.g., 4-6 markers per cycle), and imaged using a confocal or super-resolution microscope.
- Image Preprocessing: Apply flat-field correction, background subtraction, and deconvolution using software like Huygens or ImageJ.
- Segmentation: Use Ilastik for pixel classification or Cellpose for deep learning-based nucleus/cell boundary identification.
- Feature Extraction: In QuPath or CellProfiler, measure intensity, texture, and morphology for each segmented object.
- Data Analysis: Perform statistical analysis on extracted features (e.g., t-test, ANOVA) and generate plots in R/Python.
Protocol 2: Spatial Bioinformatics for Molecular Pixelation Data
- Data Generation: Apply Molecular Pixelation (Anima Bio) workflow: cells are labeled with DNA-barcoded antibodies, crosslinked, and the spatial protein network is sequenced.
- Data Ingestion: Load cell-by-protein count matrices and spatial adjacency files into a Python (Squidpy) or R (Seurat) environment.
- Spatial Graph Construction: Construct a nearest-neighbor graph based on spatial protein-derived coordinates.
- Spatial Analysis: Calculate spatial autocorrelation (Moran's I), perform neighborhood analysis, and identify cell-cell interaction hotspots.
- Integration: Co-embed with paired scRNA-seq data using canonical correlation analysis (CCA) for multimodal validation.
Visualization: Analytical Workflows
Title: Comparative Workflow of Image Analysis and Spatial Bioinformatics
Title: Logical Framework for Thesis Research Comparing Pipelines
The Scientist's Toolkit: Essential Research Reagent Solutions
| Item | Function in Research | Typical Example |
|---|---|---|
| DNA-barcoded Antibody Libraries | Enable high-plex protein detection in Molecular Pixelation by converting protein abundance into sequenceable DNA tags. | Anima Bio MPX library. |
| Cyclic Immunofluorescence Kits | Enable multiplexing beyond spectral limits in microscopy through sequential staining and bleaching/dye inactivation. | Akoya Biosciences CODEX/ Phenocycler kits. |
| Tissue Clearing Reagents | Render whole tissues transparent for deep-layer imaging in 3D microscopy pipelines. | Visikol HISTO, ScaleS4. |
| Fluorophore-Conjugated Antibodies | Standard reagents for visualizing target proteins in fluorescence microscopy pipelines. | Alexa Fluor series conjugates. |
| Nucleic Acid Stain | Labels nuclei for critical segmentation step in both pipelines. | DAPI, Hoechst, SYTO dyes. |
| Spatial Transcriptomics Slide | Captures full transcriptome data from tissue sections while preserving location. | 10x Genomics Visium slide. |
| Cell Permeabilization Buffers | Critical for allowing DNA-barcoded antibodies or sequencing reagents to access intracellular targets. | Custom buffers with digitonin or saponin. |
| Crosslinking Fixatives | Preserve protein-protein proximity interactions crucial for Molecular Pixelation network analysis. | DSS, BS3, or formaldehyde. |
This guide provides a comparative analysis of Molecular Pixelation (MPX) and fluorescence microscopy, framed within a thesis on resolution research for large-scale studies. The focus is on objective performance comparison, with an emphasis on cost, scalability, and data quality for applications in drug discovery and basic research.
Performance and Cost Comparison
The following table summarizes key quantitative differences between Molecular Pixelation and Fluorescence Microscopy, based on current market and literature data.
Table 1: Comparative Analysis of MPX vs. Fluorescence Microscopy
| Parameter | Molecular Pixelation (e.g., 10x Genomics) | High-Resolution Fluorescence Microscopy (e.g., STED, SIM) | Notes / Source |
|---|---|---|---|
| Maximum Resolution | ~2 nm (protein proximity) | ~20-70 nm (lateral) | MPX infers nanoscale organization via DNA barcoding. |
| Throughput (Cells per Run) | 10^4 - 10^6 cells | 10^2 - 10^3 cells per day | Microscopy is limited by imaging/analysis time. |
| Capital Equipment Cost | ~$350,000 - $500,000 (sequencer + processor) | ~$500,000 - $1,500,000+ | Microscope cost varies greatly with modality. |
| Cost per Sample (Reagents) | ~$1,000 - $3,000 (library prep & sequencing) | ~$50 - $500 (antibodies, dyes, slides) | MPX cost is high but provides single-cell data. |
| Multiplexing Capacity | 100s of proteins simultaneously | Typically 4-8 targets per cycle | MPX uses oligonucleotide-conjugated antibodies. |
| Data Type | Spatial proteomics, interaction maps | 2D/3D visual imagery, colocalization | MPX data is computational; microscopy is observational. |
| Scalability for Large Cohorts | High (parallel processing of 1000s of cells) | Low (serial, manual imaging) | MPX integrates with high-throughput sequencing. |
| Primary Experimental Output | Molecular interaction graphs, clusters | Visual images, intensity profiles |
Experimental Protocols for Key Comparisons
Protocol 1: Molecular Pixelation Workflow for Surface Protein Analysis
- Cell Preparation: Harvest and wash 0.5-1 million cells. Resuspend in a suitable buffer.
- Antibody Staining: Incubate cells with a panel of 100+ monoclonal antibodies conjugated with proprietary MPX oligonucleotide tags (e.g., from 10x Genomics) for 30 minutes on ice.
- Fixation and Permeabilization: Fix cells with 4% PFA for 15 min. Permeabilize with 0.1% Triton X-100 for intracellular target analysis if required.
- Proximity Ligation & Amplification: Add ligation mix to join adjacent antibody-derived oligonucleotides, creating pairwise proximity barcodes. Perform isothermal amplification to generate readable DNA fragments.
- Library Preparation & Sequencing: Construct sequencing libraries using standard NGS adapters. Run on a high-throughput sequencer (e.g., Illumina NovaSeq) to achieve ~50,000 reads per cell.
- Data Analysis: Use dedicated software (e.g., 10x Genomics' Loupe Browser) to reconstruct protein spatial neighborhoods and interaction networks from barcode co-occurrence data.
Protocol 2: Super-Resolution Microscopy (STED) for Protein Colocalization
- Sample Preparation: Seed cells on high-precision #1.5H coverslips. Fix with 4% PFA and permeabilize with 0.2% saponin.
- Immunostaining: Incubate with primary antibodies against 2-4 target proteins overnight at 4°C. Use highly validated, directly labeled fluorescent secondary antibodies (e.g., Abberior STAR) or nanobodies for 1 hour at RT.
- Mounting: Mount in a commercial, oxygen-scavenging mounting medium (e.g., ProLong Diamond) to reduce photobleaching.
- Image Acquisition: Use a confocal microscope with STED capability (e.g., Leica SP8 STED). Acquire confocal images first, then apply the STED depletion laser (e.g., 592 nm or 775 nm) to achieve super-resolution. Collect 5-10 fields of view per sample.
- Image Analysis: Use software (e.g., Imaris, Fiji) for colocalization analysis (Manders' coefficients) and cluster analysis (DBSCAN, Ripley's K-function).
Visualizing Workflows and Data Relationships
Diagram 1: MPX Experimental and Data Workflow
Diagram 2: Thesis Framework for Technology Comparison
The Scientist's Toolkit: Research Reagent Solutions
Table 2: Essential Reagents and Materials for Spatial Profiling Studies
| Item | Function in Experiment | Typical Vendor/Example |
|---|---|---|
| Oligonucleotide-Conjugated Antibodies | Binds target protein and provides unique DNA barcode for detection and proximity recording. | 10x Genomics (MPX Ab Oligo Conjugates) |
| Proximity Ligation Mix | Enzymatically joins adjacent DNA barcodes on nearby proteins, encoding spatial relationships. | 10x Genomics (MPX Ligation Buffer/Enzyme) |
| Next-Generation Sequencing Kit | Prepares the final DNA library from amplified barcodes for sequencing. | Illumina (Nextera XT), 10x Genomics (Dual Index Kit) |
| Super-Resolution Compatible Fluorophores | Bright, photostable dyes for STED/SIM imaging (e.g., ATTO 590, Abberior STAR 635). | Abberior, ATTO-TEC, Thermo Fisher |
| Oxygen-Scavenging Mountant | Preserves fluorescence and reduces photobleaching during prolonged super-resolution imaging. | Thermo Fisher (ProLong Diamond), Sigma (Mowiol with antifade) |
| High-Precision Coverslips (#1.5H) | Essential for maintaining optical fidelity and correct working distance in high-resolution microscopy. | Marienfeld, Schott, Corning |
| Cell Hashtag Antibodies | Allows sample multiplexing in MPX by labeling cells from different conditions with unique barcodes. | BioLegend (Totalseq-B/C), 10x Genomics |
| Fixative/Permeabilization Kits | Preserves cellular architecture and allows intracellular target access with minimal epitope damage. | BD Biosciences (Cytofix/Cytoperm), Thermo Fisher (eBioscience) |
Head-to-Head Comparison: Resolution, Multiplexing, and Quantitative Accuracy
Understanding the disparity between theoretical resolution limits and achievable experimental performance is a cornerstone of advanced imaging research. This guide objectively compares key technologies within the broader thesis context of Molecular Pixelation versus traditional and super-resolution fluorescence microscopy.
Theoretical Foundations and Practical Bottlenecks
The theoretical resolution limit, defined by Abbe's diffraction limit (~200-250 nm laterally, ~500-700 nm axially for visible light), has been surpassed by super-resolution techniques. However, practical performance is constrained by photophysics, labeling efficiency, and sample preparation.
Quantitative Comparison of Spatial Resolution
Table 1: Benchmarking Theoretical and Practical Resolution of Imaging Modalities
| Imaging Modality | Theoretical Limit (Lateral) | Typical Practical Performance | Key Limiting Factor(s) |
|---|---|---|---|
| Diffraction-Limited Fluorescence | ~λ/(2NA) (~250 nm) | 250-300 nm | Lens NA, emission wavelength (λ). |
| STED | Unlimited in theory | 20-70 nm | Depletion beam power, photostability. |
| (PALM/STORM) | Unlimited in theory | 10-30 nm | Single-molecule brightness, label density. |
| SIM | ~2x diffraction limit | 100-120 nm | Pattern frequency, SNR. |
| Molecular Pixelation (MPX) | Determined by DNA sequence length (~5-10 nm)* | 50-100 nm | Antibody conjugation efficiency, sequencing depth. |
MPX resolution is theoretically defined by the genomic barcode length and library design. *Current published performance; limited by epitope accessibility and data analysis.
Experimental Protocols for Key Comparisons
Protocol 1: Resolving Microtubule Networks (STORM vs. MPX)
Objective: Compare the effective resolution for visualizing cytoskeletal architecture. Sample Prep: U2OS cells fixed with 4% PFA, permeabilized with 0.1% Triton X-100.
- STORM: Label with anti-α-tubulin, secondary antibody conjugated to Alexa Fluor 647. Imaged in STORM buffer (Glucose Oxidase/Catalase system) on a TIRF microscope. 50,000 frames acquired.
- MPX: Label with anti-α-tubulin conjugated with MPX antibody tag (DNA oligo). Cells are fixed, then processed through the MPX workflow: proximity ligation, nuclei isolation, genomic library prep, and sequencing. Analysis: STORM: Localizations clustered and rendered. MPX: Sequencing data processed via MPX analysis pipeline to assign spatial coordinates to epitopes.
Protocol 2: Clustering Analysis of Membrane Receptors (SIM vs. MPX)
Objective: Quantify cluster size of EGFR at the plasma membrane. Sample Prep: A431 cells stimulated with EGF (50 ng/mL, 5 min).
- SIM: Label with anti-EGFR-Alexa Fluor 555. Acquire 15-grid SIM images on a commercial SIM system. Reconstruct with manufacturer's software.
- MPX: Label with anti-EGFR-MPX tag. Process through standard MPX workflow. Use pairwise co-localization analysis of barcodes to infer cluster dimensions. Analysis: SIM: Cluster analysis via DBSCAN on reconstructed image. MPX: Statistical analysis of co-localization frequency versus distance from sequencing data.
Signaling Pathway & Workflow Visualizations
Title: EGFR Activation Pathway for Imaging Studies
Title: Comparative Workflow: Fluorescence Microscopy vs Molecular Pixelation
The Scientist's Toolkit: Research Reagent Solutions
Table 2: Essential Reagents for High-Resolution Imaging Experiments
| Reagent / Material | Function | Example Use Case |
|---|---|---|
| Photoswitchable/Activatable Dyes (e.g., Alexa Fluor 647) | Enables stochastic single-molecule localization in PALM/STORM. | Labeling secondary antibodies for super-resolution imaging of cytoskeleton. |
| STED-Compatible Dyes (e.g., STAR RED) | High photostability under intense depletion laser. | Direct conjugation to antibodies for nanoscale imaging of synaptic proteins. |
| DNA-Barcoded Antibody Tags (MPX) | Carries unique sequence identifier for proximity ligation. | Conjugation to primary antibodies for Molecular Pixelation mapping of cell surface proteins. |
| Fiducial Markers (e.g., Tetraspeck Beads) | Provides reference points for drift correction during long acquisitions. | Essential for any super-resolution microscopy experiment requiring stable staging. |
| Oxygen Scavenging / ROXS Buffers | Reduces photobleaching and blinking artifacts. | Critical buffer component for single-molecule localization microscopy (SMLM). |
| High-NA Oil Immersion Objective (NA ≥1.4) | Maximizes light collection and minimizes diffraction limit. | Universal requirement for all high-resolution fluorescence microscopy. |
| Polymerized Gel Matrix (e.g., PA) | Physically locks biomolecules in place for expansion techniques. | Used in expansion microscopy (ExM) to achieve ~70 nm effective resolution. |
Within the ongoing research thesis comparing Molecular Pixelation (an emerging spatial proteomics technology) to advanced fluorescence microscopy, the central challenge of multiplexing capability defines a critical performance gap. This guide objectively compares the current state of high-plex protein detection, analyzing technologies that enable dozens versus hundreds of simultaneous protein measurements in single-cell or spatial contexts.
Performance Comparison: Key Technologies
Table 1: Multiplexing Capacity & Key Metrics of Leading Platforms
| Technology Category | Representative Platform/Assay | Max Proteins Simultaneously | Spatial Context | Resolution (Approx.) | Key Experimental Readout |
|---|---|---|---|---|---|
| High-Plex Fluorescence Microscopy | CODEX (Akoya), Phenocycler (Formerly CODEX) | 40-60+ | Preserved (Tissue) | ~0.2 µm (limited by diffraction) | Cyclic immunofluorescence, imaging |
| Spatial Proteomics (DNA-tagged Antibodies) | Molecular Pixelation (Pixelgen Technologies) | 100s (claimed) | Preserved (Cells/Tissue) | Molecular (~10 nm) | DNA sequence, proximity mapping |
| Imaging Mass Cytometry (IMC) | Hyperion (Standard Mass Cytometry) | 40-50 | Preserved (Tissue) | ~1 µm | Time-of-flight mass spectrometry |
| Multiplexed Ion Beam Imaging (MIBI) | MIBIscope | 40-50 | Preserved (Tissue) | ~0.26 µm (Oxygen primary ion beam) | Secondary ion mass spectrometry |
| Spatial Transcriptomics Adjacent | Visium (10x Genomics) + Protein | 20-30 (Protein) | Preserved (Tissue) | 55 µm (spot-based) | mRNA + Oligo-tagged Antibody |
Table 2: Experimental Workflow & Practical Considerations
| Parameter | Dozens-Plex (e.g., Cyclic IF, IMC) | Hundreds-Plex (e.g., Molecular Pixelation, CosMx) |
|---|---|---|
| Total Experiment Time | 2-4 days (cyclic staining/imaging) | 2-3 days (library prep + sequencing) |
| Tissue Requirements | FFPE or Fresh Frozen compatible | Typically requires fresh/fresh frozen cells |
| Data Type | Pixel-level intensity maps | Molecular coordinate lists or graphs |
| Primary Analysis | Cell segmentation, intensity quantification | Single-cell protein interaction networks |
| Key Limitation | Spectral overlap, bleaching (cyclic), antibody validation | High-computational burden, novel data structures |
Experimental Protocols
Protocol A: High-Plex Cyclic Immunofluorescence (e.g., CODEX)
Principle: Sequential staining, imaging, and dye inactivation of antibody panels.
- Sample Prep: Prepare FFPE tissue sections on a coated coverslip. Perform standard deparaffinization and antigen retrieval.
- Antibody Conjugation: Label primary antibodies with unique DNA barcodes (CODEX) or directly conjugate to fluorophores (other cyclic IF).
- Staining Cycle: a. Incubate with a subset of antibodies (for non-CODEX) or all antibodies (CODEX). b. Image entire FOV using a widefield or confocal microscope with defined filter sets. c. Fluorophore Inactivation: Treat with a chemical reagent (e.g., hydrogen peroxide/NaOH for dyes) or enzymatically cleave DNA barcodes (CODEX) to remove signal. d. Repeat steps a-c for subsequent cycles until all markers are collected.
- Image Processing: Align all cycle images using fiducial markers. Deconvolve and generate a single, high-plex composite image.
Protocol B: Molecular Pixelation (DNA-Programmable Spatial Proteomics)
Principle: Proximity ligation of antibody-DNA conjugates to map protein neighborhood relationships.
- Sample Preparation: Adherent cells or tissue sections are fixed and permeabilized.
- Staining with DNA-Conjugated Antibodies: Incubate sample with a panel of hundreds of antibodies, each conjugated to a unique, protein-specific DNA oligonucleotide ("Pixelation Code").
- Proximity Ligation & Amplification: Add connectors and ligation reagents. When antibody-DNA conjugates are in close spatial proximity (<30 nm), their DNA strands are ligated together, forming a unique DNA product.
- Library Preparation & Sequencing: The ligated DNA products are amplified via PCR and prepared for high-throughput sequencing (Illumina).
- Data Analysis: Sequencing reads are decoded to identify which proteins were in proximity. A graph network is constructed for each cell, representing the spatial organization of its surfaceome.
Visualizations
Title: Molecular Pixelation Experimental Workflow
Title: Dozens vs. Hundreds Plex Core Concept
Title: Thesis Context & The Multiplexing Gap
The Scientist's Toolkit
Table 3: Research Reagent Solutions for High-Plex Spatial Proteomics
| Item | Function | Key Consideration for High-Plex |
|---|---|---|
| DNA-Barcoded Antibody Panels | Core detection reagent for technologies like Molecular Pixelation, CODEX. | Requires rigorous validation for specificity and conjugation efficiency. Custom vs. pre-validated panels. |
| Fixation/Permeabilization Kits | Preserve tissue/cell morphology and protein epitopes while allowing reagent access. | Optimization is critical; must balance epitope retention with access for DNA-antibody conjugates. |
| Ligation Enzymes & Buffers | Enzymatically join DNA strands from proximal antibodies to record spatial information. | Efficiency dictates the signal-to-noise and effective resolution of the proximity map. |
| Indexed Sequencing Primers | Enable multiplexed, high-throughput sequencing of DNA barcode libraries. | Must be compatible with the specific DNA construct design of the chosen platform. |
| Image Alignment Software | Align images from multiple cycles in cyclic IF to a sub-pixel accuracy. | Uses fiducial markers; critical for accurate multi-channel data overlays. |
| Graph Analysis Software (e.g., NetworkX, custom) | Analyze single-cell protein proximity graphs generated by Molecular Pixelation. | Emerging field; requires tools for clustering, community detection, and comparative network analysis. |
This comparison guide evaluates technologies for quantifying protein expression, a critical capability in molecular biology and drug development. The analysis is framed within ongoing research comparing Molecular Pixelation (an emerging single-cell spatial proteomics technology) with advanced fluorescence microscopy techniques, focusing on their respective abilities to provide relative signal intensity versus absolute protein copy numbers.
Technology Comparison & Performance Data
The table below summarizes the quantitative capabilities of key technologies based on recent experimental studies.
Table 1: Quantitative Performance of Protein Detection Technologies
| Technology / Platform | Primary Output | Dynamic Range | Approx. Lower Quantification Limit (Proteins/Cell) | Key Strength | Key Limitation |
|---|---|---|---|---|---|
| Molecular Pixelation (MPX) | Absolute copy number (estimated via DNA barcode counting) | ~3-4 logs | 100 - 500 | Direct, digital counting of protein targets via associated DNA barcodes. Provides spatial context on cell surface. | Limited to extracellular/epitope targets. Protocol complexity. |
| Fluorescence Microscopy (e.g., Airyscan) | Signal Intensity (A.U.) | ~2-3 logs | Varies widely with dye/background | High spatial resolution. Mature, versatile platform for live & fixed cells. | Intensity is relative; requires calibration standards for absolute numbers. |
| Flow Cytometry (Standard) | Signal Intensity (A.U.) | 4-5 logs | >1,000 | High-throughput, multi-parametric single-cell analysis. | Bulk measurement, no spatial data. Intensity is relative. |
| Mass Spectrometry (LC-MS/MS) | Absolute copy number (with heavy-labeled standards) | 4-5 logs | 50 - 1,000 (varies by protein) | Unbiased, proteome-wide quantification. | Loses single-cell and spatial context without specialized workflows. |
| qPCR/dPCR (for tagged proteins) | Absolute copy number (DNA barcode count) | 6-8 logs (for dPCR) | <10 | Extremely sensitive and precise digital quantification. | Typically requires cell lysis, losing spatial and single-cell info. |
Detailed Experimental Protocols
Protocol 1: Estimating Absolute Copy Numbers via Molecular Pixelation (MPX)
- Sample Preparation: Cells are incubated with a panel of antibody-oligoconjugates (Ab-Oligos) targeting surface proteins of interest. Each Ab-Oligo contains a unique DNA barcode.
- Fixation & Gel Embedding: Cells are fixed and embedded in a polyacrylamide gel matrix. The cell membrane is permeabilized and digested, leaving the Ab-Oligos anchored in the gel relative to their original spatial distribution.
- DNA Barcode Processing: The gel is subjected to an enzymatic reaction (e.g., ligation) to create DNA "pixels" representing the spatial arrangement of proteins. The barcodes are then amplified and sequenced.
- Data Analysis & Quantification: Sequencing reads are mapped to their specific protein targets. Absolute copy numbers are estimated by counting the unique, deduplicated barcode reads associated with a single cell, applying corrections for labeling efficiency and sequencing noise.
Protocol 2: Calibrating Fluorescence Microscopy for Semi-Absolute Quantification
- Standard Curve Generation: Use beads with a known, uniform density of fluorophore molecules (e.g., MESF or QBEE beads). Image these beads under identical acquisition settings as biological samples.
- Image Acquisition: Capture high-resolution images (e.g., using confocal or super-resolution microscopy) of both calibration beads and stained cells.
- Signal Correlation: Plot the measured fluorescence intensity of beads against their known fluorophore count to generate a calibration curve.
- Extrapolation: Apply the calibration function to the integrated fluorescence intensity from a region of interest (e.g., cell membrane) to estimate the number of fluorophores, and thus bound antibodies. This number is then used to infer protein copy numbers, assuming a known antibody:antigen stoichiometry.
Key Signaling Pathways & Workflows
Title: MPX vs Fluorescence Microscopy Quantitative Workflows
Title: Quantitative Questions in a Receptor Signaling Pathway
The Scientist's Toolkit: Key Research Reagent Solutions
Table 2: Essential Reagents for Quantitative Protein Analysis
| Reagent / Material | Primary Function in Quantification | Typical Use Case |
|---|---|---|
| Antibody-Oligoconjugates (MPX) | Binds target protein and provides a unique, amplifiable DNA barcode for digital counting. | Molecular Pixelation for absolute estimate. |
| Polyacrylamide Gel Kit | Creates a matrix to spatially lock DNA barcodes after cell dissolution. | MPX sample processing. |
| Fluorophore-conjugated Antibodies | Binds target protein and emits light proportional to abundance upon excitation. | Fluorescence microscopy & flow cytometry. |
| Calibration Beads (MESF/QBEE) | Provides a reference standard with a known number of fluorophores for intensity calibration. | Converting microscopy/flow intensity to semi-absolute counts. |
| DNA-Barcoded Beads (e.g., BD AbSeq) | Allows multiplexed protein detection by associating antibody binding with sequencable barcodes. | High-parameter flow cytometry or combinatorial indexing assays. |
| Heavy-labeled Peptide Standards (AQUA) | Serves as an internal standard for precise absolute quantification by mass spectrometry. | Targeted LC-MS/MS proteomics. |
| Cell Fixation/Permeabilization Buffers | Preserves cellular architecture and allows access to intracellular targets for labeling. | Most imaging and fixed-cell assays. |
| Indexed Sequencing Kits (Illumina) | Enables high-throughput sequencing of DNA barcodes from MPX or barcoded antibody assays. | Readout for digital counting methods. |
Comparison Guide: Molecular Pixelation vs. Fluorescence Microscopy
This guide compares the performance of Molecular Pixelation (MPX), an emerging spatial proteomics technique, with established fluorescence microscopy methods for analyzing protein organization and interactions at the cell surface.
Table 1: Core Performance Metrics Comparison
| Metric | Molecular Pixelation (MPX, e.g., from Pixelgen Technologies) | High-Resolution Fluorescence Microscopy (e.g., STED, SIM) | Conventional Flow Cytometry |
|---|---|---|---|
| Spatial Resolution | ~2 nm (protein complex detail) | ~20-250 nm (diffraction-limited to super-resolved) | None (bulk population measurement) |
| Throughput (Cells) | High-Throughput (10,000 - 100,000s cells per experiment) | Low-Throughput (10s - 100s cells per imaging session) | Very High-Throughput (10,000s cells/second) |
| Multiplexing Capacity | High-Plex (Simultaneous analysis of 100s - 1000s of proteins via DNA sequencing) | Low-Plex (Typically 4-8 colors due to spectral overlap) | Medium-Plex (Up to 30-40 parameters with spectral cytometry) |
| Scalability to Populations | Excellent (DNA barcoding enables pooled analysis of millions of cells) | Poor (Manual field-of-view selection limits population-scale stats) | Excellent (Inherently designed for large populations) |
| Data Output | Quantitative spatial graphs (neighborhoods, clusters) per single cell. | 2D/3D intensity-based images. | Population-level expression histograms. |
| Key Experimental Data | Identified distinct spatial organization of CD3ε in T-cell activation states (see protocol below). | Visualized nanoscale clustering of GPI-anchored proteins. | Quantified percentage of CD4+ T cells in a sample. |
| Primary Application | Single-cell spatial proteomics maps for population-level discovery. | Subcellular visualization of labeled targets. | High-speed phenotyping and sorting of cell populations. |
Table 2: Suitability for Research Phases
| Research Phase | Molecular Pixelation Recommendation | Fluorescence Microscopy Recommendation |
|---|---|---|
| Discovery & Screening | High: Unbiased mapping of surfaceome organization across vast cell numbers. | Low: Low throughput and multiplexing are bottlenecks. |
| Target Validation | High: Quantify spatial reorganization of targets/pathways in response to treatment at scale. | Medium: Ideal for visual confirmation in selected cells but lacks statistical power. |
| Mechanistic Studies | Medium-High: Provides spatial interaction hypotheses; lower temporal resolution. | High: Best for live-cell imaging and dynamic processes. |
Experimental Protocols
Key Experiment Cited in Comparison: Analyzing T-cell Receptor Spatial Reorganization upon Activation
Objective: To compare how Molecular Pixelation and super-resolution microscopy (STED) reveal changes in the spatial organization of the T-cell receptor (TCR) complex before and after activation.
Protocol A: Molecular Pixelation (MPX) Workflow
- Sample Preparation: Jurkat T-cells are divided into two aliquots. One is activated using a cocktail of PMA/Ionomycin or anti-CD3/CD28 antibodies for 24 hours.
- Antibody Incubation: Both activated and resting cells are incubated with a panel of DNA-barcoded antibody conjugates (e.g., against CD3ε, CD4, CD45, etc.).
- Fixation & Proximity Ligation: Cells are fixed with paraformaldehyde. A proprietary solution is added to create a gel-embedding matrix around each cell.
- DNA Proximity Extension: Enzymes are added to link DNA barcodes from antibodies in close spatial proximity (<30 nm), forming unique proximity ligation products (PLPs).
- Processing & Sequencing: The gel is digested, and the DNA products (PLPs and original barcodes) are purified and prepared for next-generation sequencing (NGS).
- Data Analysis: Sequencing reads are decoded and mapped back to individual cells. Spatial graphs are reconstructed for each cell, showing protein neighborhoods and clusters. Population-level analysis compares graph metrics (e.g., cluster size, connectivity) between resting and activated states.
Protocol B: Stimulated Emission Depletion (STED) Microscopy Workflow
- Sample Preparation: Similar T-cell activation protocol. Cells are fixed and permeabilized.
- Immunostaining: Cells are stained with fluorescently-labeled antibodies (e.g., anti-CD3ε conjugated to a dye suitable for STED, like Abberior STAR RED).
- Mounting: Cells are mounted on coverslips with an antifade mounting medium.
- Image Acquisition: Samples are imaged using a STED microscope. A depletion laser (e.g., at 775 nm) shapes the effective fluorescence point spread function to achieve ~30-50 nm resolution.
- Image Analysis: Images are deconvolved and analyzed using cluster analysis software (e.g., DBSCAN). Metrics like cluster density, size, and fluorescence intensity are quantified for a limited number of cells (~50-100 per condition).
Visualizations
MPX: From Single Cells to Population Spatial Data
Integrative View of TCR Signaling Analysis
The Scientist's Toolkit: Key Research Reagent Solutions
| Item | Function in Experiment | Example Product/Type |
|---|---|---|
| DNA-Barcoded Antibody Conjugates | Primary reagents for MPX. Antibody provides specificity; DNA barcode enables proximity detection & NGS readout. | Custom or kit-based conjugates (e.g., Pixelgen Molecular Pixelation kit). |
| Proximity Ligation Enzymes (MPX) | Enzymatic mix that forms DNA links between barcodes in close spatial proximity (<30 nm), creating sequencing-ready products. | Proprietary enzyme blend (part of MPX kit). |
| Cell Fixation/Permeabilization Buffer | Preserves cellular architecture and protein locations while allowing reagent access. Critical for both MPX and microscopy. | Paraformaldehyde (PFA) solution; mild detergents (e.g., saponin, Triton X-100). |
| Super-Resolution Compatible Fluorophore | Bright, photostable dye for STED microscopy to withstand depletion laser and allow nanoscale imaging. | Abberior STAR RED, Alexa Fluor 594, ATTO 647N. |
| Antifade Mounting Medium | Preserves fluorescence signal during microscopy by reducing photobleaching. | ProLong Diamond, Vectashield. |
| NGS Library Preparation Kit | Prepares the DNA output from MPX for sequencing on platforms like Illumina. | Illumina DNA Prep kits. |
| Cluster Analysis Software | Quantifies nanoscale protein clusters from super-resolution microscopy images. | ImageJ with plugins (DBSCAN), commercial software like Imaris or Huygens. |
Within the ongoing thesis research comparing Molecular Pixelation (MPX) with fluorescence microscopy for spatial proteomics and resolution, the need for integrative strategies is paramount. This guide compares the performance of these core technologies and complementary methods, providing a framework for selecting optimal approaches in drug discovery and basic research.
Performance Comparison: Molecular Pixelation vs. Super-Resolution Fluorescence Microscopy
Table 1: Core Technology Performance Metrics
| Feature / Metric | Molecular Pixelation (MPX) | STED Microscopy | PALM/STORM Microscopy | Expansion Microscopy (ExM) |
|---|---|---|---|---|
| Effective Resolution | ~10 nm (protein proximity) | 30-70 nm | 10-20 nm | ~70 nm (post-expansion) |
| Multiplexing Capacity | Very High (1000s of proteins) | Low-Moderate (2-4 colors) | Moderate (typically 2-3) | High (dozens, via iterative labeling) |
| Throughput | High (cell population analysis) | Low (single FOV) | Very Low (single FOV, slow acquisition) | Moderate |
| Live Cell Compatible | No (fixed cells) | Yes | Limited (often requires special buffers) | No |
| Sample Type | Suspension cells, surfaces | Cultured cells, tissues | Cultured cells, tissues | Cells, tissues, whole organs |
| Key Output | Spatial protein network maps, nanoscale organization | Diffraction-unlimited images of labeled targets | Nanoscale localization maps of sparse emitters | Physically expanded sample for diffraction-limited imaging |
| Quantitative Data | Absolute protein abundance, neighbor relationships | Relative intensity, colocalization coefficients | Molecular counts, clustering metrics | Relative fluorescence intensity, distances |
Table 2: Correlative Study Data from Integrative Protocols
| Integrative Approach | Combined Strengths | Experimental Result (Example Data) | Key Limitation |
|---|---|---|---|
| MPX + Confocal Microscopy | MPX: High-plex nanoscale organization. Confocal: Cellular context, morphology. | Identification of 5 distinct receptor nanocluster phenotypes linked to organelle proximity (n=10,000 cells). | Lack of true super-resolution context. |
| MPX + STORM | MPX: Population-level proteome mapping. STORM: Ultra-structural validation. | Validation of MPX-predicted CD20 nanocluster sizes (MPX: 52±12 nm; STORM: 48±15 nm; n=25 clusters). | Highly labor-intensive; low throughput. |
| STED + Expansion Microscopy | STED: High res. ExM: Enhanced multiplexing. | Post-expansion STED imaging achieved 40 nm resolution with 6-plex labeling in neural tissue. | Physical distortion can complicate analysis. |
Experimental Protocols for Correlative Studies
Protocol 1: MPX Followed by Immunofluorescence Confocal Imaging
This protocol allows the mapping of surface protein networks with high-plex depth followed by contextual imaging of selected markers.
- Cell Preparation: Harvest and wash suspension cells. For adherent cells, use gentle detachment.
- MPX Sample Processing: a. Incubate cells with a cocktail of DNA-antibody conjugates (e.g., 5'-aminated oligos) targeting proteins of interest. b. Fix cells with 4% PFA. c. Perform proximity ligation: Add a bridging oligo to join antibodies within ~30 nm. d. Amplify and barcode DNA nodes via rolling circle amplification (RCA). e. Sequence the DNA amplicons (next-generation sequencing).
- Post-MPX Immunofluorescence: a. After the RCA step, block cells with 5% BSA. b. Incubate with fluorescently-labeled antibodies for 2-3 key markers (e.g., organelle markers) not used in the MPX panel. c. Mount on slides and image using a confocal microscope.
- Data Integration: Use the confocal images to segment cells into spatial compartments (e.g., membrane, cytosol). Overlay this segmentation onto the MPX-derived spatial protein maps for contextual analysis.
Protocol 2: Correlative MPX and dSTORM Validation on the Same Sample
This protocol validates MPX-derived nanoclustering data with ground-truth super-resolution imaging.
- Sample Preparation: Label cells with primary antibodies against the target protein(s) for MPX and a photoswitchable dye (e.g., Alexa Fluor 647) for STORM.
- MPX Processing: Complete steps 2a-2d from Protocol 1 up to the RCA amplification step.
- STORM Imaging: Mount the cells in a STORM imaging buffer (e.g., with glucose oxidase, catalase, and cysteamine). Acquire a STORM super-resolution image stack (~20,000-50,000 frames) for the target protein.
- MPX Sequencing: After imaging, carefully recover the sample and proceed with DNA sequencing (Step 2e, Protocol 1).
- Analysis: Reconstruct the STORM image. Compare the nanocluster size and density measurements from the STORM image with the neighbor graph and adjacency data generated by MPX for the same protein.
Visualization of Workflows and Relationships
Diagram 1: Correlative Study Decision Workflow (82 chars)
Diagram 2: MPX Proximity Ligation Principle (77 chars)
The Scientist's Toolkit: Research Reagent Solutions
Table 3: Essential Reagents for Correlative Spatial Studies
| Item / Reagent | Function in Protocol | Key Consideration for Integration |
|---|---|---|
| DNA-Conjugated Antibodies (e.g., TotalSeq, CEIVO) | Primary labeling reagent for MPX. Antibody coupled to a unique DNA oligonucleotide. | Must avoid epitope collision with antibodies used for subsequent fluorescence imaging. |
| Proximity Ligation & Amplification Kit (e.g., from Pixelgen Technologies) | Contains enzymes, buffers, and nucleotides for on-cell RCA. Essential for MPX signal generation. | Fixation conditions must be compatible with both MPX chemistry and fluorescence epitope preservation. |
| Photoswitchable Dyes (Alexa Fluor 647, CF680) | High-performance fluorophores for single-molecule localization microscopy (SMLM). | Conjugation must be to a different primary antibody clone than the MPX DNA-antibody to prevent steric hindrance. |
| STORM / SMLM Imaging Buffer | Creates a reducing, oxygen-scavenging environment to induce fluorophore photoswitching. | Must be applied after MPX RCA steps; can potentially degrade DNA amplicons if not carefully controlled. |
| High-Performance Mounting Medium (with antifade) | Preserves fluorescence signal for microscopy. Critical for post-MPX imaging. | Must be compatible with sequenced samples if returning to the sequencer. ProLong Diamond is often suitable. |
| Multichannel Confocal or Super-Resolution Microscope | Instrumentation for contextual or validation imaging. | System should have stable stage for relocating specific cells or regions of interest after MPX processing. |
| Bioinformatic Pipeline (e.g., CellProfiler, Pixeline, custom scripts) | Software for image analysis, MPX graph construction, and data correlation. | The largest integration challenge. Requires frameworks for aligning multimodal datasets (image pixels to molecular graphs). |
Conclusion
Molecular Pixelation and fluorescence microscopy are not simply rivals but complementary technologies that address different facets of spatial biology. Fluorescence microscopy remains unparalleled for live-cell dynamics and morphological context, while Molecular Pixelation breaks the multiplexing barrier to provide unprecedented molecular maps of protein communities. The future of biomedical research lies in strategic integration—using microscopy to guide hypotheses and Molecular Pixelation to validate them with deep molecular profiling. For drug development, this synergy promises more precise target discovery, robust biomarker panels, and a deeper understanding of drug mechanisms at the sub-cellular level, ultimately accelerating the path to clinical translation.