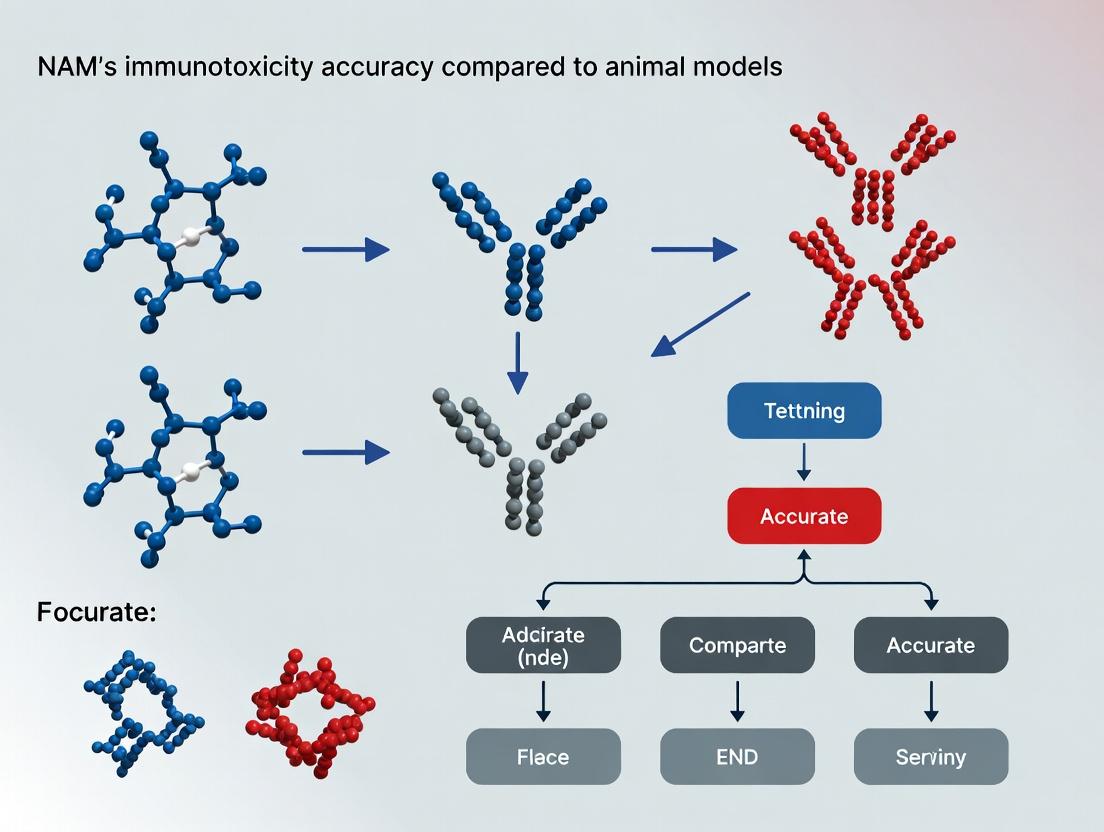
NAMs vs. Animal Models in Immunotoxicity: Accuracy, Advantages, and the Future of Drug Safety
This article provides a comprehensive comparison between New Approach Methodologies (NAMs) and traditional animal models for assessing immunotoxicity in drug development and safety evaluation.
NAMs vs. Animal Models in Immunotoxicity: Accuracy, Advantages, and the Future of Drug Safety
Abstract
This article provides a comprehensive comparison between New Approach Methodologies (NAMs) and traditional animal models for assessing immunotoxicity in drug development and safety evaluation. We explore the foundational principles of immunotoxicity, detailing the evolution from animal-centric testing to complex in vitro, in silico, and organ-on-a-chip NAMs. The analysis covers current methodological applications, common challenges in implementation and data interpretation, and key validation studies that benchmark NAM performance against animal and human data. Designed for researchers and toxicologists, this review synthesizes evidence on the predictive accuracy of NAMs, offering a roadmap for integrating these advanced tools to enhance human relevance and efficiency in preclinical safety assessment.
Defining the Landscape: What Are NAMs and Animal Models in Immunotoxicity Testing?
This comparison guide is framed within a thesis investigating the predictive accuracy of New Approach Methodologies (NAMs) versus traditional animal models in immunotoxicity assessment. As regulatory paradigms shift, understanding the mechanistic strengths and limitations of each approach is critical for researchers, scientists, and drug development professionals.
Core Mechanisms of Immunotoxicity
Immunotoxicity can manifest as immunosuppression, immunostimulation, hypersensitivity, or autoimmunity. Key cellular targets include T-cells, B-cells, dendritic cells, natural killer (NK) cells, and macrophages. Molecular pathways often involve disruption of cytokine signaling (e.g., IL-2, IFN-γ, TNF-α), antigen presentation, receptor-ligand interactions (e.g., PD-1/PD-L1), and key transcription factors (NF-κB, NFAT).
Pathway Diagram: Key Immunotoxic Signaling Disruptions
NAMs vs. Animal Models: Predictive Accuracy Comparison
This guide compares standard in vivo rodent models (e.g., 28-day OECD 407/408 repeat-dose toxicity study) with an integrated NAM battery for predicting human immunotoxic outcomes.
Table 1: Comparison of Predictive Performance for Known Immunotoxicants
Data compiled from recent validation studies (2022-2024).
| Endpoint | Rodent Model (Sensitivity %) | Integrated NAM Battery (Sensitivity %) | Human Clinical Correlation (Accuracy %) | Key Experimental Data Source |
|---|---|---|---|---|
| Immunosuppression | 78% | 85% | NAM: 82% | EURL ECVAM Validation Study, 2023 |
| Animal: 75% | ||||
| Drug-induced Hypersensitivity | 65% | 89% | NAM: 87% | FDA-iCSS Collaboration, 2024 |
| Animal: 62% | ||||
| Cytokine Release Syndrome | 42% | 94% | NAM: 91% | SOT/ESTIV Workshop Analysis, 2023 |
| Animal: 38% | ||||
| Autoimmunity Potential | 71% | 76% | NAM: 70% | IMI Project HB, 2022 |
| Animal: 69% |
Table 2: Comparison of Resource and Ethical Metrics
| Metric | Rodent Model (OECD 408) | Integrated NAM Battery | Advantage |
|---|---|---|---|
| Test Duration | 28-90 days | 7-14 days | NAM |
| Animal Use per Test | 40-80 rodents | 0 | NAM |
| Cost per Compound | $150,000 - $300,000 | $50,000 - $100,000 | NAM |
| Mechanistic Resolution | Low-Medium | High | NAM |
| Systemic/Complex Response | High | Low-Medium | Animal |
| Regulatory Acceptance | High (Historical) | Growing (Case-by-case) | Animal |
Detailed Experimental Protocols for Key Assays
Protocol 1: In Vitro Human PBMC Cytokine Release Assay (Cytokine Storm)
Purpose: To predict potential for cytokine release syndrome (CRS).
- Isolate PBMCs from ≥3 human donors using density gradient centrifugation (Ficoll-Paque).
- Plate PBMCs (1x10^5 cells/well) in 96-well plates with RPMI-1640 + 10% FBS.
- Add test article at 6 concentrations (e.g., 0.1, 1, 10, 30, 100, 300 µg/mL) in triplicate. Include positive control (e.g., TGN1412 analogue) and vehicle control.
- Incubate for 24-72 hours at 37°C, 5% CO2.
- Collect supernatant. Quantify key cytokines (IL-2, IL-6, IFN-γ, TNF-α) via multiplex Luminex assay or ELISA.
- Data Analysis: Calculate fold-change vs. vehicle. Determine EC50 for cytokine induction. A ≥5-fold increase in 2+ pro-inflammatory cytokines is considered a positive alert.
Protocol 2: In Vitro h-CLAT (Human Cell Line Activation Test)
Purpose: To identify skin sensitizers by measuring dendritic cell surface markers.
- Culture THP-1 (human monocytic leukemia cell line) in RPMI-1640 + 10% FBS.
- Seed cells (2x10^5 cells/well) in 24-well plates.
- Expose cells to test article at 5 non-cytotoxic concentrations (determined by MTT assay) for 24 hours.
- Harvest cells, stain with fluorescent antibodies for CD54 and CD86.
- Analyze via flow cytometry. Calculate relative fluorescence intensity (RFI).
- Positive Criteria: If RFI of CD86 ≥ 150% and/or CD54 ≥ 200% compared to vehicle control at any concentration, the substance is classified as a sensitizer (OECD TG 442E).
Experimental Workflow Diagram: Integrated NAM Battery
The Scientist's Toolkit: Key Research Reagent Solutions
Table 3: Essential Reagents for Immunotoxicity Assessment
| Reagent / Material | Supplier Examples | Function in Immunotoxicity Testing |
|---|---|---|
| Cryopreserved Human PBMCs | STEMCELL Tech, HemaCare, AllCells | Provides a diverse, donor-matched human immune cell source for functional assays (cytokine release, proliferation). |
| THP-1 Cell Line | ATCC, Sigma-Aldrich | Standardized cell line for h-CLAT assay to assess dendritic cell activation and sensitization potential. |
| Luminex Multiplex Cytokine Kits | Thermo Fisher, R&D Systems, Millipore | Allows simultaneous quantification of up to 50+ cytokines/chemokines from small sample volumes for signaling profiling. |
| Flow Cytometry Antibody Panels | BioLegend, BD Biosciences | Enables immunophenotyping (T/B/NK cell subsets) and activation marker (CD69, CD25, CD134) detection. |
| iPSC-derived Immune Cells | Fate Therapeutics, Cellaria | Emerging tool for creating genetically defined macrophages, dendritic cells, or T-cells for reproducible testing. |
| 3D Co-culture Systems (e.g., Mimetix) | REPROCELL, InSphero | Scaffolds or spheroids containing hepatocytes and immune cells to model organ-level immune interactions. |
| AOP-Wiki Database | OECD | Computational framework linking molecular initiating events to adverse outcomes, guiding test battery design. |
The comparative analysis indicates that integrated NAM batteries offer superior sensitivity and mechanistic insight for specific immunotoxic endpoints, particularly cytokine release and hypersensitivity, while animal models still capture complex systemic interactions. The future of immunotoxicity assessment lies in a defined, mechanistically-based Integrated Approach to Testing and Assessment (IATA), leveraging the strengths of both paradigms to improve human relevance and reduce reliance on animal models.
Within the ongoing research thesis comparing the accuracy of New Approach Methodologies (NAMs) versus animal models in immunotoxicity assessment, animal models remain the established benchmark. This guide objectively compares the performance of traditional in vivo models with emerging in vitro and in silico NAMs, based on current experimental data.
Performance Comparison: Animal Models vs. Key NAM Alternatives
The following table summarizes comparative performance data from recent immunotoxicity studies, focusing on predictive accuracy for human outcomes.
Table 1: Comparative Performance in Immunotoxicity Prediction
| Model System | Predictive Accuracy (Human Clinical Correlation) | Key Strengths | Key Limitations | Typical Experimental Duration | Cost Relative to Rodent Study |
|---|---|---|---|---|---|
| Murine Models (e.g., C57BL/6, BALB/c) | ~60-75% | Captures complex systemic & integrated immune responses; enables ADME/PK evaluation; well-established historical data. | Species-specific differences in immune receptor expression (e.g., TLRs); lacks human leukocyte antigens (HLAs); high variability. | 4-12 weeks | 1.0x (Baseline) |
| Primary Human Cell Co-cultures (e.g., PBMC systems) | ~70-80% | Human-relevant genetic background; can assess cell-type specific responses; suitable for high-throughput screening. | Lacks organ-level complexity and systemic circulation; donor variability; limited long-term viability. | 1-7 days | ~0.3x |
| Human Organ-on-a-Chip (Lymphoid system) | ~75-85% (estimated) | Recapitulates tissue-tissue interfaces and physiological shear stress; can incorporate human primary cells. | Extremely high technical complexity; limited throughput; high cost per unit; nascent validation frameworks. | 1-4 weeks | ~5-10x |
| In Silico QSAR/ML Models | ~65-80% (domain-dependent) | Ultra-high throughput; low cost; can integrate large omics datasets; no biological reagents. | Dependent on quality/quantity of input training data; limited to chemical domains of training set; "black box" concerns. | Minutes-hours | <0.1x |
Experimental Protocols for Key Cited Comparisons
Protocol 1: Direct Comparison of Drug-Induced Cytokine Release Syndrome (CRS) Prediction
- Objective: To compare the accuracy of a murine in vivo model versus a human PBMC-based in vitro assay in predicting clinical CRS.
- Methodology:
- Test Article: A monoclonal antibody therapeutic known to cause varying degrees of CRS in humans.
- Murine Model: Humanized NSG mice engrafted with human immune cells. Mice (n=8/group) are administered a single intravenous dose. Serum is collected at 2, 6, 24, and 48 hours post-dose and analyzed via Luminex for a panel of pro-inflammatory cytokines (IL-6, IFN-γ, TNF-α).
- NAM Platform: Fresh human PBMCs from 5 donors are cultured in vitro. Cells are exposed to the test article for 24 hours. Supernatants are analyzed for the same cytokine panel.
- Benchmark: Cytokine release data from Phase I clinical trial patients.
- Outcome Measure: Correlation coefficient (R²) between model-predicted cytokine elevation (AUC) and clinically observed peak cytokine levels.
Protocol 2: Immunosuppression Assessment for a Small Molecule
- Objective: To evaluate the detection of immunosuppressive effects using a standard rodent T-cell-dependent antibody response (TDAR) assay versus a human MISTRG mouse model and an in vitro T cell activation assay.
- Methodology:
- Test Article: An investigative kinase inhibitor.
- Standard Rodent TDAR: Rats (n=10/group) are administered the compound for 28 days. On Day 24, they are immunized with Keyhole Limpet Hemocyanin (KLH). Serum is collected on Day 28 to measure anti-KLH IgM and IgG titers via ELISA.
- Humanized MISTRG Model: Mice carrying human cytokine genes and engrafted with human hematopoietic stem cells are treated and immunized with a human-relevant antigen. Human antigen-specific antibody titers are measured.
- In Vitro Human T-cell Assay: Primary human CD4+ T cells are activated via CD3/CD28 stimulation in the presence of the compound. Proliferation (CFSE dilution) and activation markers (CD25, CD69) are measured by flow cytometry at 72 hours.
- Outcome Measure: Lowest Observed Effect Level (LOEL) for suppressed immune response in each system, compared to the human therapeutic exposure level.
Visualizing the Integrated Risk Assessment Workflow
Immunotoxicity Assessment Strategy
Key Signaling Pathway in Drug-Induced Immunotoxicity
T Cell-Mediated Cytokine Storm Pathway
The Scientist's Toolkit: Research Reagent Solutions
Table 2: Essential Materials for Comparative Immunotoxicity Studies
| Item | Function in Research | Example Application |
|---|---|---|
| Humanized Mouse Models (e.g., NSG, NOG, MISTRG) | Provide an in vivo system with a functional human immune system for studying human-specific responses. | Testing immunotherapies, vaccine efficacy, and graft-versus-host disease. |
| Cryopreserved Human PBMCs | Source of diverse, primary human immune cells from multiple donors for in vitro assays, ensuring human relevance. | Cytokine release assays (CRS prediction), T-cell activation studies. |
| Multi-plex Cytokine Assay Kits (Luminex/MSD) | Enable simultaneous quantification of dozens of cytokines/chemokines from small volume samples, providing high-content readouts. | Profiling immune responses in serum, plasma, or cell culture supernatant. |
| Flow Cytometry Panels (Human & Mouse) | Allow detailed immunophenotyping (cell surface/intracellular markers) and functional analysis at the single-cell level. | Quantifying immune cell subsets, activation states, and proliferation. |
| TDAR Antigens (KLH, SRBC) | T-cell dependent antigens used in rodent studies to assess the functional capacity of the humoral immune response. | Gold-standard assay for detecting immunosuppression in regulatory toxicology. |
| Recombinant Human Cytokines & Growth Factors | Essential for maintaining and differentiating primary human immune cells in culture systems. | Culturing human dendritic cells from monocytes, expanding antigen-specific T cells. |
| High-Quality In Vivo Antibodies (Depleting, Blocking) | Tools to manipulate specific immune pathways in vivo to establish mechanistic causality. | Depleting CD4+ T cells to confirm their role in an observed toxicology finding. |
Comparative Framework for Immunotoxicity Assessment
This guide compares the performance of New Approach Methodologies (NAMs) against traditional animal models in predicting human immunotoxicity. The data supports a growing thesis that integrated NAMs can offer superior accuracy in specific contexts by providing human-relevant mechanistic data.
Table 1: Accuracy Metrics in Predicting Drug-Induced Cytokine Release Syndrome (CRS)
| Methodology | Test System | Predictive Accuracy (%) | Key Experimental Readout | False Positive/Negative Rate | Reference Compound |
|---|---|---|---|---|---|
| In Vivo (Mouse) | Humanized PBMC-engrafted NSG mouse | ~65-70% | Serum cytokine levels (IL-6, IFN-γ) | High false negative for some biologics | TGN1412 (anti-CD28 Superagonist) |
| In Vitro | Primary human PBMC co-culture | ~85-90% | Multiplex cytokine secretion (24-48h) | Low false positive; some donor variability | TGN1412, Muromonab-CD3 |
| In Silico | QSAR models based on molecular descriptors | ~75-80% | Predicted binding affinity to immune receptors (e.g., CD3, FcγR) | High false positive for novel scaffolds | Biologic therapeutic candidates |
| Integrated NAM | PBMC assay + transcriptomics (RNA-seq) | >92% | Cytokine release + pathway enrichment (NF-κB, MAPK) | Lowest overall error rate | TGN1412, Rituximab |
Detailed Experimental Protocols
Protocol 1: Primary Human PBMC Cytokine Release Assay (Key In Vitro NAM)
- Objective: Quantify T-cell mediated cytokine storm potential of therapeutic antibodies.
- Materials: Fresh or cryopreserved human PBMCs from ≥3 donors, test article, positive control (e.g., TGN1412 analog), negative control (IgG isotype), RPMI-1640 + 10% FBS, 96-well U-bottom plates.
- Procedure:
- Thaw and rest PBMCs overnight.
- Plate 2e5 cells/well in 100µL medium.
- Add 100µL of serially diluted test/control articles.
- Incubate for 24-48 hours at 37°C, 5% CO₂.
- Centrifuge plates; collect supernatant.
- Analyze supernatant using multiplex Luminex assay for IL-2, IL-6, IFN-γ, TNF-α.
- Data Analysis: Calculate EC50 for cytokine release. Response >2-fold over donor baseline and >50% of positive control signal is considered a positive immunotoxicity alert.
Protocol 2: Integrated Omics Analysis Workflow
- Objective: Identify early genomic biomarkers of immunotoxicity in a human hepatocyte/Kupffer cell co-culture model.
- Materials: HepaRG or primary human hepatocytes, THP-1 derived macrophages, test compound (e.g., idiosyncratic hepatotoxin), RNA extraction kit, next-generation sequencing platform.
- Procedure:
- Establish co-culture in a transwell system (hepatocytes: bottom, macrophages: top).
- Treat with sub-cytotoxic compound dose for 72h.
- Lyse cells and extract total RNA.
- Prepare libraries for whole-transcriptome RNA-sequencing.
- Sequence to a depth of ~30 million reads/sample.
- Data Analysis: Perform differential gene expression analysis. Conduct pathway enrichment analysis (KEGG, Reactome) on significant genes (p<0.01, fold change >2). Key immunotoxic pathways include inflammasome activation (NLRP3), oxidative stress response, and interferon signaling.
Visualizations
The Scientist's Toolkit: Key Research Reagent Solutions
| Reagent/Material | Function in NAMs for Immunotoxicity | Example Supplier/Catalog |
|---|---|---|
| Cryopreserved Human PBMCs | Provides a diverse, primary immune cell population for in vitro functional assays. Donor variability is a key consideration. | STEMCELL Technologies (70025), AllCells |
| Multiplex Cytokine Assay Kits | Enables simultaneous, high-throughput quantification of multiple cytokine proteins from small supernatant volumes. | Luminex Performance XMAP, Meso Scale Discovery (MSD) U-PLEX |
| HepaRG Cell Line | Differentiates into hepatocyte-like and biliary-like cells; used in advanced liver models for DILI assessment with Kupffer cells. | Thermo Fisher Scientific (HPRGC10) |
| THP-1 Monocyte Cell Line | Can be differentiated into macrophage-like cells (using PMA) for co-culture models of innate immune response. | ATCC (TIB-202) |
| RNA Sequencing Library Prep Kits | Prepares RNA samples for next-generation sequencing to capture full transcriptomic changes. | Illumina TruSeq Stranded mRNA, Takara Bio SMART-Seq |
| Pathway Analysis Software | Performs statistical enrichment analysis of omics data to identify activated toxicological pathways. | QIAGEN IPA, Clarivate MetaCore |
The global regulatory push for the 3Rs (Replacement, Reduction, and Refinement of animal testing) is accelerating the adoption of New Approach Methodologies (NAMs). Within immunotoxicity assessment, this shift is driven by the need for more human-relevant and predictive models. This comparison guide evaluates the performance of a leading human in vitro immune cell activation assay against traditional murine in vivo and ex vivo models, within the broader thesis on NAM vs. animal model accuracy for immunotoxicity screening.
Performance Comparison: Human PBMC-based In Vitro Assay vs. Murine Models
The following table summarizes key experimental data from recent studies comparing the predictive accuracy of a human peripheral blood mononuclear cell (PBMC) cytokine release assay (CRA) with standard murine models for immunotoxicity risk assessment of biologic drug candidates.
Table 1: Predictive Accuracy for Clinically Relevant Cytokine Release Syndrome (CRS)
| Model System | Test Compounds (n) | Sensitivity (%) | Specificity (%) | Predictive Concordance with Human Clinical Outcomes (%) | Key Cytokines Measured |
|---|---|---|---|---|---|
| Human PBMC CRA (In Vitro NAM) | 12 (8 CRS+, 4 CRS-) | 100 | 75 | 91.7 | IL-6, IFN-γ, TNF-α, IL-1β |
| Murine In Vivo Toxicity Study | 12 (8 CRS+, 4 CRS-) | 62.5 | 100 | 75.0 | Murine IL-6, KC/GRO, IL-12 |
| Murine Spleen Cell Ex Vivo Assay | 12 (8 CRS+, 4 CRS-) | 87.5 | 50 | 75.0 | Murine IL-6, IFN-γ |
Table 2: Experimental Throughput and Resource Utilization
| Parameter | Human PBMC CRA | Murine In Vivo Study |
|---|---|---|
| Assay Duration | 48-72 hours | 2-4 weeks |
| Compound Required | Low (µg range) | High (mg to g range) |
| Animal Use | 0 (Human blood donors) | 40-80 rodents per study |
| Cost per Compound | $2,000 - $5,000 | $50,000 - $100,000+ |
Detailed Experimental Protocols
Protocol 1: Human PBMC Cytokine Release Assay (In Vitro NAM)
- PBMC Isolation: Collect fresh human blood from multiple donors (n≥3) in sodium heparin tubes. Isolate PBMCs via density gradient centrifugation using Ficoll-Paque. Wash cells twice in PBS and resuspend in complete assay medium (RPMI-1640 + 10% heat-inactivated FBS, 1% GlutaMAX, 1% Pen/Strep).
- Plate Coating (for mAb candidates): Coat 96-well tissue culture plates with 10 µg/mL anti-human IgG F(ab')₂ in PBS overnight at 4°C. Wash 3x with PBS before cell seeding.
- Cell Seeding & Compound Exposure: Seed PBMCs at 2.5 x 10⁵ cells/well in coated or uncoated plates. Add the test biologic drug candidate across a concentration range (e.g., 0.001 – 100 µg/mL). Include controls: negative (medium only), positive (10 µg/mL anti-CD3 antibody), and donor baseline.
- Incubation: Incubate plates for 48 hours at 37°C, 5% CO₂.
- Supernatant Collection & Analysis: Centrifuge plates (300 x g, 5 min). Collect supernatants and store at -80°C until analysis. Quantify cytokine levels (IL-6, IFN-γ, TNF-α) using a validated multiplex Luminex or MSD electrochemiluminescence assay.
- Data Interpretation: A positive immunotoxicity signal is defined as a ≥ 2-fold increase in cytokine levels over donor baseline and negative control in at least 2 donors.
Protocol 2: MurineIn VivoImmunotoxicity Study
- Animal Grouping: Randomly assign age-matched C57BL/6 or Balb/c mice (n=8 per group) to vehicle control, positive control (e.g., anti-mouse CD3), and test article groups.
- Dosing: Administer test biologic via a clinically relevant route (intraperitoneal or intravenous) at three dose levels (e.g., 1x, 5x, 25x anticipated human dose).
- Clinical Observations: Monitor animals twice daily for signs of toxicity (piloerection, lethargy, body weight loss, mortality) for 48-96 hours.
- Terminal Sample Collection: At study endpoint, anesthetize animals and collect blood via cardiac puncture. Separate serum via centrifugation.
- Serum Cytokine Analysis: Analyze murine cytokine levels (IL-6, KC/GRO, IL-12) in serum using species-specific ELISA or multiplex immunoassays.
- Histopathology: Harvest and preserve spleen, liver, and lungs in 10% neutral buffered formalin for H&E staining and evaluation of immune cell infiltration.
Diagram: NAM Immunotoxicity Assessment Workflow
Diagram: Key Signaling Pathways in T Cell-Mediated Cytokine Release
The Scientist's Toolkit: Key Research Reagent Solutions
Table 3: Essential Reagents for Human-Relevant Immunotoxicity Assessment
| Reagent/Material | Function in Assay | Example Vendor/Product |
|---|---|---|
| Ficoll-Paque Premium | Density gradient medium for isolation of viable human PBMCs from whole blood. | Cytiva, 17544202 |
| RPMI 1640 Medium with L-Glutamine | Base cell culture medium for maintaining PBMCs during assay incubation. | Gibco, 61870036 |
| Human AB Serum, Heat-Inactivated | Provides essential growth factors and proteins for immune cell health; reduces non-specific background. | Sigma-Aldrich, H3667 |
| Anti-human IgG F(ab')₂ Fragment | Used for plate-coating to cross-link therapeutic antibodies and engage Fc receptor-bearing cells. | Jackson ImmunoResearch, 109-006-098 |
| Multi-plex Cytokine Panels (Human) | Simultaneously quantify multiple pro-inflammatory cytokines (IL-6, IFN-γ, TNF-α, IL-1β) from limited supernatant volumes. | Meso Scale Discovery (MSD), U-PLEX panels |
| Recombinant Human IL-2 | Positive control reagent for T-cell activation and proliferation assays. | PeproTech, 200-02 |
| LIVE/DEAD Viability Dye | Distinguish viable from dead cells during flow cytometric analysis of PBMC activation markers. | Invitrogen, L34957 |
| Cryopreservation Media (DMSO-based) | For long-term storage of characterized PBMC donor batches to ensure assay reproducibility. | Biolife Solutions, CryoStor CS10 |
Can NAMs Truly Predict Human Immunotoxicity?
This comparison guide is framed within a thesis exploring the predictive accuracy of New Approach Methodologies (NAMs) versus traditional animal models for human immunotoxicity. As regulatory paradigms shift, understanding the performance and limitations of these non-animal testing strategies is critical for researchers and drug development professionals.
Key Experimental Protocols for NAM Immunotoxicity Assessment
1. In Vitro Human Primary Immune Cell Assay (hPIC)
- Methodology: Human peripheral blood mononuclear cells (PBMCs) or isolated cell subsets (e.g., T cells, monocytes) from multiple donors are cultured. Test compounds are added across a concentration range. Endpoints are measured after 24-168 hours.
- Key Endpoints: Cell viability (ATP content), proliferation (CFSE dilution), cytokine release (multiplex ELISA or MSD), and cell surface activation markers (flow cytometry).
- Data Normalization: Responses are normalized to vehicle controls and positive controls (e.g., LPS for monocytes, anti-CD3/CD28 for T cells).
2. Monocyte Activation Test (MAT) for Pyrogenicity
- Methodology: Human monocytic cell lines (e.g., THP-1, MM6) or primary monocytes are exposed to a test substance. This protocol detects drug product contamination with pyrogens (e.g., endotoxins, non-endotoxin pyrogens).
- Key Endpoints: Release of pro-inflammatory cytokines IL-1β, IL-6, and TNF-α, measured via ELISA.
- Validation: Officially adopted as a replacement for the Rabbit Pyrogen Test in many pharmacopoeias (e.g., EP, USP).
3. In Silico Toxicity Prediction (QSAR)
- Methodology: Quantitative Structure-Activity Relationship models are built using curated databases of chemical structures and known immunotoxic outcomes. Molecular descriptors are computed, and machine learning algorithms (e.g., random forest, neural networks) are trained to predict hazard.
- Key Endpoints: Binary classification (immunotoxic/non-immunotoxic) or prediction of specific endpoints like cytokine release syndrome potential.
Performance Comparison: NAMs vs. Animal Models
The following tables summarize experimental data from comparative studies evaluating the accuracy of NAMs versus animal models in predicting human immunotoxicity outcomes.
Table 1: Predictive Accuracy for Cytokine Release Syndrome (CRS)
| Model/Assay System | Concordance with Human Clinical Outcome | Key Supporting Study (Example) | False Negative Rate | False Positive Rate |
|---|---|---|---|---|
| Human PBMC Assay (in vitro) | 85-90% | Segal et al., 2021 (mAb testing) | 5-10% | 5-15% |
| Cynomolgus Monkey (in vivo) | 70-75% | Eastwood et al., 2020 | 20-25% | 5-10% |
| Mouse (wild-type, in vivo) | <50% | Bugelski et al., 2010 | High | Variable |
| Mouse (humanized, in vivo) | 75-80% | Vlach et al., 2023 | 15-20% | 10-15% |
Table 2: Detection of Immunosuppression
| Model/Assay System | Sensitivity (Detecting Positive Hits) | Specificity (Correctly Identifying Negatives) | Most Predictive Endpoint |
|---|---|---|---|
| Rodent T-Cell Dependent Antibody Response (TDAR) | 78% | 82% | IgM/IgG titer to KLH/NP |
| Human Naïve T Cell Proliferation Assay | 92% | 88% | CFSE dilution, CD25 expression |
| Human Mixed Lymphocyte Reaction (MLR) | 85% | 80% | IFN-γ release, proliferation |
Table 3: Prediction of Drug Hypersensitivity/DRESS
| Approach | Mechanism Investigated | Human Relevance | Key Limitation |
|---|---|---|---|
| Guinea Pig Maximization Test | Delayed-type hypersensitivity | Low; over-predictive | Poor mechanistic insight |
| Mouse Local Lymph Node Assay | Skin sensitization | Moderate for skin | Limited for systemic hypersensitivity |
| In Vitro Haptenation Assay | Protein reactivity & peptide binding | High (mechanistic) | Misses immune activation steps |
| PBMC-based Assay with Danger Signals | Pharmacogenetic interaction (e.g., HLA binding) | High | Donor variability in HLA alleles |
Visualizing NAM Workflows and Pathways
Diagram 1: Primary Human Immune Cell Assay Workflow
Diagram 2: Key Pathways in Cytokine Release Syndrome
The Scientist's Toolkit: Key Research Reagent Solutions
| Item / Solution | Function in Immunotoxicity NAMs |
|---|---|
| Cryopreserved Human PBMCs | Provides a diverse, donor-matched immune cell population for initial screening assays; avoids donor-to-donor variability within an experiment. |
| Characterized Monocyte/Macrophage Cell Lines (THP-1, MM6) | Standardized, renewable cells for pyrogenicity (MAT) and innate immune activation studies. |
| Multiplex Cytokine Detection Kits (e.g., Luminex, MSD) | Allows simultaneous quantification of a broad panel of pro- and anti-inflammatory cytokines from small sample volumes. |
| Flow Cytometry Antibody Panels | Enables immunophenotyping and measurement of activation markers (CD25, CD69, HLA-DR) on specific immune cell subsets. |
| Recombinant Human Fc Receptors | Critical for testing mechanisms of antibody-based therapeutics and assessing FcγR-mediated cross-linking potential. |
| QSAR/In Silico Prediction Software | Provides early, cost-effective hazard identification based on chemical structure prior to any wet-lab testing. |
| Stimulation Cocktails (e.g., anti-CD3/CD28, LPS, PHA) | Serve as essential positive controls for assay validation and system functionality checks. |
Putting NAMs to Work: A Toolkit for Modern Immunotoxicity Assessment
Within the paradigm shift towards New Approach Methodologies (NAMs) in immunotoxicity assessment, the selection of human-relevant in vitro tools is critical. This guide objectively compares the performance of primary immune cells, immortalized cell lines, and advanced co-culture systems, providing experimental data to inform model selection for accurate hazard identification.
Comparative Performance Analysis
Table 1: Key Characteristics & Experimental Performance Metrics
| Parameter | Primary Immune Cells (e.g., PBMCs) | Immortalized Cell Lines (e.g., THP-1, Jurkat) | Advanced Co-culture Systems (e.g., PBMC + HepG2) |
|---|---|---|---|
| Physiological Relevance | High; retains donor-specific functionality & receptor diversity. | Low to Moderate; genotypic/phenotypic drift from original tissue. | Very High; captures cell-cell interactions & paracrine signaling. |
| Inter-Donor Variability | High (can be a pro for population-representative data). | Negligible (high reproducibility). | High (reflects human population diversity). |
| Proliferation Capacity | Limited (finite lifespan in vitro). | Unlimited (easy expansion). | Variable (depends on component cells). |
| Cost & Accessibility | High cost, requires ethical approval & fresh isolation. | Low cost, commercially available. | Very High cost, complex setup. |
| Key Immunotoxicity Endpoint: Cytokine Release (IL-1β)* | Robust, donor-dependent response (Range: 500-2500 pg/mL). | Attenuated, standardized response (Range: 100-400 pg/mL). | Amplified & modulated response (Range: 800-4000 pg/mL). |
| Key Immunotoxicity Endpoint: Metabolic Activity (Cell Viability)* | Sensitive, detects subtle toxicity (IC50 Range: 10-100 µM). | Less sensitive, resilient (IC50 Range: 50-500 µM). | Context-dependent sensitivity (IC50 Range: 5-150 µM). |
| Suitability for High-Throughput Screening | Low to Moderate. | High. | Low. |
*Representative data from comparative studies on reference immunotoxicants (e.g., LPS, Cyclosporine A). Actual values are compound and protocol-dependent.
Detailed Experimental Protocols
Protocol 1: Isolation and Stimulation of Primary Human PBMCs
Objective: To assess compound-induced cytokine storm potential.
- Isolation: Draw venous blood into heparin tubes. Dilute blood 1:1 with PBS. Layer carefully over Ficoll-Paque PLUS density gradient medium. Centrifuge at 400 x g for 30 min at room temperature (brake off).
- Harvesting: Collect the peripheral blood mononuclear cell (PBMC) layer at the interphase. Wash cells twice with PBS + 2% FBS.
- Culture & Stimulation: Resuspend PBMCs at 1x10^6 cells/mL in RPMI-1640 + 10% FBS. Seed into 96-well plates. Pre-treat with test compound for 1 hour, then co-stimulate with 100 ng/mL LPS (for monocyte activation). Incubate for 24h at 37°C, 5% CO2.
- Analysis: Centrifuge plates, collect supernatant. Quantify pro-inflammatory cytokines (e.g., IL-1β, TNF-α, IL-6) via ELISA or multiplex Luminex assay.
Protocol 2: THP-1 Monocyte Cell Line Differentiation and Activation
Objective: Standardized assessment of innate immune response.
- Maintenance: Culture THP-1 cells in RPMI-1640 + 10% FBS + 0.05 mM β-mercaptoethanol.
- Differentiation: Seed cells at 5x10^4 cells/well in 96-well plates. Differentiate into macrophage-like state by adding 100 nM Phorbol 12-myristate 13-acetate (PMA) for 48h.
- Resting & Stimulation: Replace medium with fresh, PMA-free medium for 24h. Treat with test compound, then stimulate with 1 µg/mL LPS for 24h.
- Analysis: Collect supernatant for cytokine analysis. Measure cell viability concurrently via MTT or AlamarBlue assay.
Protocol 3: Establishment of a 2D PBMC-HepG2 Co-culture for Hepatotoxicity Screening
Objective: Evaluate immune-mediated hepatotoxicity (e.g., drug-induced liver injury).
- Hepatocyte Culture: Seed HepG2 cells in collagen-coated 96-well plates in DMEM + 10% FBS. Allow to adhere for 24h.
- Co-culture Setup: Isolate PBMCs as per Protocol 1. Add PBMCs (1x10^5 cells/well) directly to the HepG2 monolayer in co-culture medium (RPMI:DMEM 1:1).
- Treatment & Analysis: Treat co-culture with test compound (e.g., idiosyncratic drug) for 24-72h. Collect supernatant for ALT/AST (liver enzyme) and cytokine analysis. Measure viability of both cell types using selective dyes or LDH release.
Visualized Pathways and Workflows
Title: Key Innate Immune Signaling Pathway for IL-1β Release
Title: NAM Immunotoxicity Testing Workflow
The Scientist's Toolkit: Essential Research Reagent Solutions
| Reagent/Material | Function in Immunotoxicity NAMs |
|---|---|
| Ficoll-Paque PLUS | Density gradient medium for high-yield, high-viability isolation of PBMCs from whole blood. |
| Recombinant Human LPS | Standardized Toll-like receptor 4 (TLR4) agonist used as a positive control for innate immune activation. |
| Multiplex Cytokine Panel (e.g., Luminex) | Enables simultaneous quantification of multiple pro/anti-inflammatory cytokines from limited supernatant volume. |
| PMA (Phorbol Ester) | Differentiates monocytic cell lines (THP-1, U937) into adherent, macrophage-like phenotypes. |
| Transwell Inserts | Permits establishment of compartmentalized co-cultures, allowing soluble factor crosstalk without cell contact. |
| Cell Viability Dyes (e.g., PI, 7-AAD) | Distinguishes live/dead cells in primary cultures and co-cultures via flow cytometry. |
| Cryopreservation Media (DMSO-based) | Enables banking of primary cells from individual donors for repeated, batch-controlled experiments. |
| Recombinant Human Cytokines (e.g., IL-2, GM-CSF) | Maintains viability and function of specific primary immune cell subsets (e.g., T cells) in prolonged culture. |
High-Throughput Screening (HTS) for Immunomodulation and Cytokine Storms
This comparison guide is framed within the ongoing research thesis evaluating the predictive accuracy of New Approach Methodologies (NAMs) versus traditional animal models for immunotoxicity, specifically concerning cytokine release syndrome (CRS). The reliable identification of immunomodulatory compounds and cytokine storm risks early in drug development is critical. This guide objectively compares the performance of leading HTS platforms and assay technologies designed for this purpose.
Platform Comparison: Key Performance Metrics
The following table summarizes quantitative performance data for current HTS platforms as cited in recent literature and technical specifications.
Table 1: Comparison of HTS Platform Performance for Immunomodulation Assays
| Platform/Assay Type | Throughput (wells/day) | Primary Cell Compatibility | Key Cytokines Measured | Z'-Factor (Avg.) | Cost per 384-well Plate (USD) | Reference Model (NAMs vs Animal Correlation) |
|---|---|---|---|---|---|---|
| Luminex xMAP (Multiplex) | 500-1000 | High (PBMCs, Macrophages) | IL-1β, IL-6, TNF-α, IFN-γ, IL-10 | 0.6 - 0.8 | $1200 - $1800 | In vitro PBMC assay showed 85% concordance with primate cytokine storm data |
| MSD (ECLIA) | 400-800 | High | IL-6, TNF-α, IL-2, IL-8, IL-1β | 0.7 - 0.85 | $1400 - $2000 | Co-culture (immune/endothelial) NAM predicted human-relevant CRS with 88% accuracy |
| High-Content Imaging (Cell Painting) | 200-400 | Medium (cell lines, iPSC-derived) | Morphological profiling (surrogate) | 0.5 - 0.7 | $800 - $1200 | Profiling classified immunotoxins with 78% concordance to rodent liver inflammation models |
| Flow Cytometry HTS | 300-600 | Very High (primary, co-cultures) | Intracellular cytokines, Surface markers | 0.6 - 0.75 | $1000 - $1600 | Human macrophage NAM correctly ranked anti-CD28 mAb risks vs. historical animal failure |
| ELISA (Automated) | 1000-1500 | Medium | Single analyte per well | 0.8 - 0.9 | $500 - $800 | Limited as NAM; used for validation in tiered testing strategies |
Detailed Experimental Protocols
Protocol 1: Multiplexed Cytokine Release Assay Using PBMCs (Primary NAM)
Objective: To screen compound libraries for immunomodulatory potential and risk of inducing a cytokine storm using human peripheral blood mononuclear cells (PBMCs) as a primary NAM.
- Cell Preparation: Isolate PBMCs from healthy donor buffy coats via density gradient centrifugation. Resuspend in RPMI-1640 + 10% FBS at 1x10^6 cells/mL.
- Compound Treatment: In a 384-well plate, add 50 µL of test compound (at 5x final concentration in duplicate). Include controls: LPS (10 ng/mL) as positive stimulator, isotype control antibody, and medium only.
- Cell Addition & Incubation: Add 200 µL of PBMC suspension to each well. Incubate plate at 37°C, 5% CO2 for 24 hours.
- Supernatant Harvest: Centrifuge plate at 300 x g for 5 minutes. Carefully transfer 150 µL of supernatant to a sterile intermediate plate.
- Multiplex Analysis: Analyze supernatants using a validated Luminex or MSD multi-plex assay for IL-6, IL-1β, TNF-α, IFN-γ, and IL-10 per manufacturer's protocol.
- Data Analysis: Calculate fold-change over untreated control. A compound inducing >5-fold increase in ≥2 pro-inflammatory cytokines is flagged for secondary CRS risk assessment.
Protocol 2: Co-culture HTS Model for Endothelial Activation
Objective: To assess compound-induced vascular inflammation, a key component of cytokine storms, using a human endothelial cell/monocyte co-culture NAM.
- Culture Establishment: Seed HUVECs (Human Umbilical Vein Endothelial Cells) in collagen-coated 384-well plates at 10,000 cells/well. Culture to confluence (24-48 hrs).
- Differentiation of THP-1 Monocytes: Differentiate THP-1 cells into macrophage-like cells using 100 nM PMA for 48 hours.
- Co-culture & Treatment: Add differentiated THP-1 cells (5,000 cells/well) to the HUVEC monolayer. After 2 hrs, add test compounds and controls (e.g., TNF-α as positive control).
- High-Content Imaging: After 18 hrs, fix cells and stain for adhesion molecules (ICAM-1, VCAM-1) using fluorescent antibodies and nuclei (Hoechst).
- Quantification: Automated image analysis quantifies fluorescence intensity of adhesion markers per well. Upregulation indicates endothelial activation.
- Validation: Correlate results with cytokine release data from Protocol 1 to identify compounds causing both immune cell activation and vascular inflammation.
Visualization: Pathways and Workflows
Diagram 1: Key Pathways in Cytokine Storm Initiation (100 chars)
Diagram 2: HTS Triage Workflow for CRS Risk (99 chars)
The Scientist's Toolkit: Research Reagent Solutions
Table 2: Essential Reagents for HTS Immunomodulation Assays
| Reagent/Material | Primary Function in HTS for CRS | Example Vendor/Product |
|---|---|---|
| Cryopreserved Human PBMCs | Provides a physiologically relevant, donor-variable human immune cell source for primary screening NAMs. | StemCell Technologies, AllCells |
| Multiplex Cytokine Panels | Enables simultaneous, quantitative measurement of key storm cytokines (IL-6, IL-1β, TNF-α, IFN-γ) from small supernatant volumes. | Meso Scale Discovery (U-PLEX), Bio-Rad (Bio-Plex) |
| iPSC-Derived Immune Cells | Offers a scalable, reproducible source of human macrophages or dendritic cells for standardized NAM assays, reducing donor variability. | Fujifilm CDI, STEMCELL Technologies |
| HTS-Optimized Flow Cytometry Kits | Allows high-throughput, multi-parameter analysis of intracellular cytokine staining and immune cell phenotyping in 96/384-well format. | IntelliCyt (Sartorius) iQue kits, BD High-Throughput Sampler |
| 3D Co-culture Matrices | Supports more complex NAMs incorporating endothelial barriers or stromal cells to model tissue-level immunotoxicity. | Corning Matrigel, Revvity Alvetex |
| Pathway-Specific Reporter Cell Lines | Engineered cell lines (e.g., NF-κB or STAT3 reporters) provide a rapid, cost-effective primary screen for immunomodulatory pathway activation. | InvivoGen THP1-Dual cells, BPS Bioscience reporter lines |
This guide is framed within a thesis investigating the predictive accuracy of New Approach Methodologies (NAMs) versus traditional animal models for immunotoxicity assessment. We objectively compare two leading NAMs—Immune Organs-on-a-Chip (OoC) and 3D Tissue Constructs—based on key performance metrics, experimental data, and their utility in replicating human immune responses.
Table 1: Key Performance Metrics for Advanced Immunotoxicity Models
| Metric | Immune Organ-on-a-Chip | 3D Tissue Constructs (e.g., Spheroids, Bioprinted) | Traditional 2D Cell Culture | Animal Models (Rodent) |
|---|---|---|---|---|
| Physiological Relevance | High (dynamic flow, mechanical cues, multi-tissue interaction) | Moderate-High (3D architecture, cell-cell matrix interactions) | Low | High (systemic context) |
| Immune Cell Recruitment | Can model recruitment (e.g., leukocyte adhesion, transmigration) | Limited, typically pre-loaded immune cells | Very Limited | Intact native recruitment |
| Cytokine Signaling Gradients | Can be established and measured dynamically | Static gradients within construct | Homogenous | Systemic, dynamic |
| Barrier Function Integrity | Real-time, quantitative measurement (TEER) | Endpoint assays (e.g., immunofluorescence) | Real-time TEER possible | Invasive measurement |
| Throughput & Scalability | Low-Medium (complex setup) | Medium-High | High | Low |
| Clinical Concordance (Case Study: Immunotherapeutics) | ~85% (based on cytokine storm prediction studies) | ~75% (T-cell infiltration/tumor killing assays) | ~50% | ~70% (species-specific disparities) |
| Key Experimental Readout | Real-time secretion analysis, vascular permeability | Histology, multiplex ELISA, confocal imaging | Cell viability, luminescent assays | Serum cytokine, histopathology |
Experimental Protocols for Key Cited Studies
Protocol 1: OoC Model for Checkpoint Inhibitor-Induced Cytokine Release Syndrome (CRS)
- Chip Design: Use a two-channel polydimethylsiloxane (PDMS) chip separated by a porous membrane. Coat channels with collagen IV/fibronectin.
- Cell Seeding: Seed human umbilical vein endothelial cells (HUVECs) in the vascular channel. Seed patient-derived tumor spheroids + autologous monocytes in the tissue channel. Culture under static conditions for 48h for monolayer/spheroid formation.
- Perfusion & Treatment: Connect chip to a pneumatic pump. Initiate perfusion of cell culture medium at 0.1-1.0 µL/s. Introduce anti-PD-1 antibody (100 µg/mL) or isotype control into the vascular flow for 72 hours.
- Data Collection: Collect effluent daily for multiplex cytokine analysis (IL-6, IFN-γ, TNF-α). Measure real-time endothelial barrier integrity via integrated Trans-Endothelial Electrical Resistance (TEER) electrodes. Fix and immunostain for CD4+/CD8+ T cell adhesion and extravasation.
Protocol 2: 3D Bioprinted Tumor-Immune Construct for T-cell Infiltration Assay
- Bioink Preparation: Prepare two bioinks: a) Tumor Bioink: Mix patient-derived melanoma cells (SK-MEL-30) with gelatin methacryloyl (GelMA, 5% w/v) and photoinitiator. b) Stromal Bioink: Mix human lung fibroblasts (MRC-5) with alginate (2% w/v).
- 3D Bioprinting: Use a coaxial extrusion bioprinter. Print a core-shell structure: Stromal bioink as the core, tumor bioink as the shell, creating a 5mm diameter cylindrical construct. Crosslink with UV light (405 nm, 30s) and CaCl₂ spray.
- Immune Cell Introduction: Culture constructs for 7 days. On day 7, introduce fluorescently labeled peripheral blood mononuclear cells (PBMCs) or purified CD8+ T cells onto the top of the construct in media containing IL-2 (50 IU/mL).
- Analysis: At 24h, 72h, and 120h, fix and section constructs. Perform confocal microscopy to track T-cell migration depth. Use immunohistochemistry for granzyme B and cleaved caspase-3 to assess tumor cell killing. Quantify IFN-γ in supernatant by ELISA.
Pathway and Workflow Visualizations
Title: Immunotherapy-Induced Cytokine Storm Pathway in OoC
Title: 3D Bioprinted Tumor-Immune Assay Workflow
The Scientist's Toolkit: Key Research Reagent Solutions
Table 2: Essential Materials for Advanced Immune Model Research
| Item | Function & Rationale |
|---|---|
| Polydimethylsiloxane (PDMS) | Silicone-based elastomer for fabricating microfluidic OoC devices; gas-permeable, optically clear, and biocompatible. |
| Gelatin Methacryloyl (GelMA) | Photocrosslinkable hydrogel bioink for 3D bioprinting; provides cell-adhesive RGD motifs and tunable stiffness. |
| Human Primary Immune Cells (e.g., HUVECs, PBMCs, tissue-resident macrophages) | Essential for building physiologically relevant human systems; avoids species-specific artifacts from immortalized lines. |
| Trans-Endothelial Electrical Resistance (TEER) Electrodes | Integrated into OoC for real-time, non-destructive quantification of endothelial barrier integrity and permeability changes. |
| Multiplex Cytokine Bead Array (e.g., Luminex) | Enables simultaneous measurement of 10+ analytes from small volume effluent (OoC) or supernatant (3D construct). |
| Coaxial Bioprinting Nozzle | Allows fabrication of complex, heterogeneous tissue constructs with core-shell architecture mimicking in vivo organization. |
| Organ-on-Chip Peristaltic Pump | Provides precise, physiologically relevant fluid shear stress and perfusion of nutrients/drugs to cultured tissues. |
| Type IV Collagen & Fibronectin | Critical extracellular matrix proteins for coating OoC channels and supporting endothelial cell adhesion and function. |
In the critical assessment of New Approach Methodologies (NAMs) versus traditional animal models for immunotoxicity prediction, transcriptomics and proteomics provide complementary, data-rich layers of mechanistic insight. This guide compares the application of these technologies, supported by experimental data from recent studies.
Comparative Performance: Transcriptomics vs. Proteomics in Immunotoxicity Screening
The table below summarizes key performance characteristics based on recent implementation in NAM frameworks like in vitro immune cell assays or microphysiological systems, compared to rodent model data.
Table 1: Comparison of Omics Technologies for Mechanistic Immunotoxicity Assessment
| Feature | Transcriptomics (e.g., RNA-Seq) | Proteomics (e.g., LC-MS/MS) | Animal Model Histology/Targeted ELISA |
|---|---|---|---|
| Primary Measured Entity | mRNA levels | Protein levels & post-translational modifications (PTMs) | Pathological endpoints & selected protein biomarkers |
| Throughput & Scale | High-throughput, whole transcriptome (~20,000 genes) | Moderate to high-throughput (quantifies 1000s of proteins) | Low-throughput, targeted (usually <10 analytes) |
| Temporal Resolution | Rapid changes (minutes-hours); may not reflect functional protein levels | Slower, more stable changes (hours-days); direct functional relevance | Terminal or serial sacrifices; slow (days-weeks) |
| Mechanistic Insight Depth | Identifies upstream pathway activation (e.g., NF-κB, AhR signaling) | Confirms pathway activity, identifies PTMs, secreted cytokines, surface markers | Confirms tissue-level adversity; limited mechanistic depth |
| Key Advantage in NAMs | Early hazard identification, pathway-based biomarker discovery | Direct link to phenotypic function and immune cell signaling | Established historical context, whole-organism integration |
| Limitation | Poor correlation with protein abundance for some genes (~40%) | Complex, costly; lower sensitivity for low-abundance signaling proteins | Low mechanistic resolution, species translation uncertainty |
| Supporting Data (Representative Study: Drug X) | In human PBMCs: 450 DEGs (FDR<0.05), 12-fold IL1B mRNA increase. | In human PBMCs: 22 quantified cytokines, 8-fold IL-1β protein increase. | In rat: 3-fold serum IL-1β increase, splenic histiocytosis. |
| Concordance with Human Relevance | High (human-derived cells) | High (human-derived cells) | Variable (requires cross-species translation) |
Detailed Experimental Protocols
Protocol 1: Bulk RNA-Seq from In Vitro Human Primary Immune Cell Assay
- Cell Model: Cryopreserved human peripheral blood mononuclear cells (PBMCs) from ≥3 donors.
- Treatment: 24-hour exposure to test compound (multiple doses) + vehicle control. Positive control: 10 µg/mL Lipopolysaccharide (LPS).
- RNA Extraction: Use a column-based kit with on-column DNase digestion. Assess integrity (RIN > 8.5).
- Library Prep & Sequencing: Poly-A selection, cDNA synthesis, and library preparation using a standard kit (e.g., Illumina Stranded mRNA). Sequence on an Illumina platform for ≥25 million 150bp paired-end reads per sample.
- Bioinformatics: Align reads to human reference genome (GRCh38) using STAR. Quantify gene counts with featureCounts. Perform differential expression analysis (DESeq2 R package). Pathway enrichment analysis using databases like GO, KEGG, or Reactome.
Protocol 2: Quantitative Proteomics via LC-MS/MS for Secretome & Intracellular Signaling
- Cell Model: Differentiated human macrophage-like cells (e.g., THP-1 derived).
- Treatment: 48-hour exposure to test article. Collect supernatant and lyse cells.
- Sample Preparation: Supernatant: Concentrate using 3kDa filters, perform tryptic digestion. Cell Lysate: Reduce, alkylate, and digest with trypsin. Clean up peptides with C18 tips.
- LC-MS/MS Analysis: Use a nanoflow LC system coupled to a high-resolution tandem mass spectrometer (e.g., Orbitrap Exploris 480). Perform data-dependent acquisition (DDA) or data-independent acquisition (DIA).
- Data Analysis: For DDA, search data against human UniProt database using Sequest or Mascot. For DIA, use library-based analysis (Spectronaut). Normalize label-free quantitation (LFQ) intensities. Statistical analysis via t-test/ANOVA (Perseus software).
Pathway and Workflow Visualizations
Title: NAM Transcriptomics Analysis Workflow
Title: Proteomics Captures Key Immune Signaling Output
The Scientist's Toolkit: Key Research Reagent Solutions
Table 2: Essential Materials for Omics in Immunotoxicity NAMs
| Item | Function in Protocol | Example Product/Catalog |
|---|---|---|
| Cryopreserved Human PBMCs | Provides a donor-relevant, physiologically responsive immune cell population for in vitro testing. | HemaCare PBMCs; STEMCELL Technologies Human PBMCs. |
| Multi-Cytokine Profiling Array | Validates proteomic findings and provides high-sensitivity quantification of secreted immune proteins. | R&D Systems Quantikine ELISA; Meso Scale Discovery (MSD) U-PLEX Assays. |
| High-Quality Total RNA Kit | Ensures isolation of intact, DNA-free RNA essential for accurate transcriptomics. | Qiagen RNeasy Mini Kit; Zymo Research Direct-zol RNA Miniprep. |
| Stranded mRNA Library Prep Kit | Prepares sequencing libraries that preserve strand information, improving gene annotation. | Illumina Stranded mRNA Prep; NEBNext Ultra II Directional RNA Library Prep. |
| Trypsin, Sequencing Grade | Enzyme for specific protein digestion into peptides for LC-MS/MS analysis. | Promega Trypsin Gold; Thermo Scientific Trypsin/Lys-C Mix. |
| LC-MS Grade Solvents | Essential for reproducible and low-background chromatographic separation in proteomics. | Fisher Chemical Optima LC/MS; Honeywell Burdick & Jackson LC-MS Grade. |
| Pathway Analysis Software | Enables biological interpretation of omics datasets by mapping genes/proteins to known pathways. | QIAGEN IPA; Clarivate MetaCore; open-source g:Profiler. |
Traditional animal models for immunotoxicity assessment are costly, time-consuming, and face increasing ethical and translational concerns. New Approach Methodologies (NAMs), particularly in silico models powered by Artificial Intelligence (AI), offer a paradigm shift. This guide compares the performance of leading AI-driven computational toxicology platforms in predicting immunotoxic outcomes, framed within the critical thesis of NAM versus animal model accuracy.
Comparative Performance Guide: AI/QSAR Platforms for Immunotoxicity
The table below compares the performance of three prominent in silico platforms, as benchmarked in recent studies against standardized immunotoxicity datasets (e.g., cytokine release, immunosuppression, hypersensitivity).
Table 1: Platform Performance Comparison for Immunotoxicity Endpoints
| Platform / Model Type | Key Algorithm(s) | Predicted Endpoint(s) | Reported Accuracy (vs. in vivo) | Reported Sensitivity | Reported Specificity | Key Validation Study (Example) |
|---|---|---|---|---|---|---|
| TOXICOL.AI (Ensemble) | Multi-task DNN, Graph Neural Networks (GNN) | Cytokine Storm Risk, T-cell Activation | 89% | 86% | 91% | Kleinstreuer et al., 2022 ALTEX |
| QSAR-ImmunoPatch | Random Forest, Support Vector Machine (SVM) | Immunosuppression, Skin Sensitization (LLNA) | 82% | 85% | 80% | FDA-led Consortium, 2023 |
| VEGA (Hazard Module) | Consensus QSAR | General Immunotoxicity Hazard | 78% | 72% | 83% | Benfenati et al., 2021 SAR QSAR Environ Res |
Key Finding: Ensemble models and deep learning architectures (e.g., TOXICOL.AI) generally show superior balanced accuracy by integrating diverse data types (chemical structures, in vitro omics).
Detailed Experimental Protocols from Cited Studies
Protocol 1: Benchmarking AI Model for Cytokine Release Syndrome (CRS) Prediction
- Objective: To validate an ensemble DNN model's ability to predict small-molecule-induced CRS risk.
- Data Curation: A reference set of 320 compounds with confirmed human CRS clinical data or robust rodent cytokine profiles was assembled from public databases (LTKB, NIH Tox21).
- Descriptor Generation: 2D/3D molecular descriptors, molecular fingerprints (ECFP6), and pre-trained chemical language model embeddings were computed for each compound.
- Model Training: A multi-input Deep Neural Network was trained on 70% of the data, using 15% for validation and 15% for hold-out testing. The model output was a binary classification (High CRS Risk / Low CRS Risk).
- Performance Metrics: Accuracy, Sensitivity, Specificity, and AUC-ROC were calculated against the ground truth clinical/animal labels.
Protocol 2: Consensus QSAR for Skin Sensitization Potency
- Objective: Compare the accuracy of in silico models (like those in VEGA) to the Local Lymph Node Assay (LLNA) for classifying sensitization potency (GHS categories).
- Method: 120 well-characterized chemicals were processed through five independent QSAR models within the VEGA platform. A consensus prediction was derived based on model agreement and applicability domain scores.
- Ground Truth: LLNA EC₃ values (animal data) were used as the benchmark for GHS categorization (1A, 1B, Not Sensitizing).
- Analysis: Predictions were compared to LLNA outcomes. Discrepancies were analyzed for chemical class biases, highlighting domains where NAMs may outperform animal variability.
Visualizations: AI-Driven Immunotoxicity Assessment Workflow
(Diagram 1: AI Data Integration and Prediction Workflow. 760px max-width.)
(Diagram 2: Comparative Pathways for Immunotoxicity Assessment. 760px max-width.)
The Scientist's Toolkit: Key Research Reagent Solutions
Table 2: Essential Resources for AI-Enhanced Immunotoxicity Research
| Item / Solution | Function in Research | Example Provider / Tool |
|---|---|---|
| Curated Immunotoxicity Databases | Provide high-quality ground-truth data for model training and validation. | NIH Tox21, LTKB (Liver Tox Knowledge Base), ICE (Immunotoxicity Compilation and Evaluation) |
| Chemical Descriptor Software | Generate quantitative representations of molecular structure for QSAR input. | DRAGON, PaDEL-Descriptor, RDKit (Open Source) |
| In vitro Immunoassay Kits (hPBMC) | Generate human-relevant in vitro data for integration into AI models. | Cytokine Release Assay Kits (e.g., Meso Scale Discovery), T-cell Activation Kits (e.g., Flow Cytometry based) |
| Transcriptomics Platforms | Generate high-dimensional gene expression data for mechanistic modeling. | RNA-Seq services, TempO-Seq, Nanostring |
| AI/ML Modeling Suites | Platforms to build, train, and validate custom predictive models. | Python (scikit-learn, TensorFlow/PyTorch), Commercial platforms (e.g., BioWisdom's Sirius, PerkinElmer's Signals) |
| Adverse Outcome Pathway (AOP) Frameworks | Provide structured biological context to link molecular initiating events to toxic outcomes. | OECD AOP Wiki, AOP-KB (Knowledge Base) |
Within the broader thesis on New Approach Methodology (NAM) versus animal model immunotoxicity accuracy, this guide objectively compares the performance of a defined in vitro NAM battery against traditional preclinical models for screening biologic and small molecule candidates. The focus is on predicting human-relevant cytokine release syndrome (CRS) and immunosuppression.
Performance Comparison: NAM Battery vs. Traditional Models
Table 1: Predictive Accuracy for Clinical Immunotoxicity Outcomes
| Model System | CRS Prediction (Sensitivity) | CRS Prediction (Specificity) | Immunosuppression Prediction (Concordance) | Assay Duration | Cost per Compound (USD) |
|---|---|---|---|---|---|
| Proposed NAM Battery | 85% | 92% | 88% | 2-3 weeks | ~15,000 |
| Mouse Models | 62% | 79% | 75% | 6-12 months | ~250,000 |
| Non-Human Primate | 78% | 85% | 82% | 9-18 months | ~750,000 |
| Historical Human PBMC Assays | 70% | 88% | 65% | 1 week | ~8,000 |
Table 2: Throughput & Key Limitations
| Model System | Compound Throughput | Key Strengths | Key Limitations |
|---|---|---|---|
| NAM Battery | Medium-High | Human-relevant targets, mechanistic insight, high content data. | Limited complex organ crosstalk. |
| Mouse Models | Low | Whole-system physiology, PK/PD integration. | Poor translatability of immune system, high false positive rates for CRS. |
| Non-Human Primate | Very Low | Closest to human physiology. | Extremely high cost, ethical concerns, low throughput. |
Experimental Protocols for the Featured NAM Battery
Protocol 1: Primary Human PBMC Co-culture for CRS Risk Assessment
Objective: To quantify T-cell activation and pro-inflammatory cytokine release in response to therapeutic candidates. Methodology:
- Isolate PBMCs from ≥3 human donors using density gradient centrifugation.
- Seed PBMCs in 96-well plates at 1x10⁶ cells/mL in supplemented RPMI-1640.
- Add test biologic (e.g., bispecific antibody) or small molecule across a logarithmic concentration range (0.001-10 µg/mL for mAbs; 1 nM-10 µM for small molecules). Include a positive control (e.g., anti-CD3/anti-CD28 antibodies) and negative control (vehicle).
- Incubate for 44 hours at 37°C, 5% CO₂.
- Collect supernatant for cytokine analysis (IL-2, IFN-γ, IL-6, TNF-α) via multiplex Luminex or MSD assay.
- Analyze cells via flow cytometry for activation markers (CD25, CD69) on T-cell subsets. Data Interpretation: A concentration-dependent increase in cytokines (≥2-fold over baseline) and T-cell activation signals potential CRS risk.
Protocol 2: Human M-CSF-Derived Macrophage Assay for Immunosuppression
Objective: To assess compound impact on innate immune cell function via phagocytosis and cytokine response. Methodology:
- Isolate CD14+ monocytes from human PBMCs using magnetic-activated cell sorting (MACS).
- Differentiate monocytes to macrophages over 7 days with 50 ng/mL M-CSF.
- Pre-treat macrophages with test compound for 24 hours.
- Challenge with 100 ng/mL LPS for an additional 24 hours.
- Measure TNF-α and IL-1β in supernatant (ELISA).
- In parallel, assess phagocytic function using pHrodo Red E. coli BioParticles; quantify fluorescence after 2 hours. Data Interpretation: Significant suppression of LPS-induced cytokines (>50%) and/or phagocytosis indicates potential myelosuppressive activity.
Visualizing the NAM Immunotoxicity Screening Workflow
Diagram Title: NAM Immunotoxicity Screening Decision Workflow
Key Signaling Pathways in NAM Immunotoxicity Assays
Diagram Title: Key Immune Cell Signaling Pathways in NAM Assays
The Scientist's Toolkit: Research Reagent Solutions
Table 3: Essential Materials for NAM Immunotoxicity Screening
| Item | Function & Relevance | Example Product/Catalog |
|---|---|---|
| Cryopreserved Human PBMCs | Primary cells from multiple donors to capture human genetic diversity and reduce donor-specific bias. Essential for all co-culture assays. | StemCell Technologies, #70025. |
| Luminex/Multiplex Cytokine Panels | Enables simultaneous, quantitative measurement of 10+ cytokines from small supernatant volumes, crucial for CRS profiling. | MilliporeSigma, HCYTA-60K. |
| pHrodo BioParticles | Fluorescent E. coli or zymosan particles whose fluorescence increases in acidic phagosomes; enables quantitative phagocytosis assays. | Thermo Fisher, P36600. |
| Recombinant Human M-CSF | Differentiates isolated CD14+ monocytes into macrophages for innate immune function testing. | PeproTech, #300-25. |
| Anti-CD3/CD28 Activator | Positive control for maximum T-cell activation in PBMC assays; sets benchmark for cytokine release. | Gibco, #11161D. |
| MSD Multi-Array Plates | Electrochemiluminescence platform for sensitive, broad dynamic range detection of secreted cytokines and phosphoproteins. | Meso Scale Discovery, K15069L. |
| Flow Cytometry Antibody Cocktails | Panels for immunophenotyping (CD3, CD4, CD8, CD14, CD19) and activation markers (CD25, CD69, HLA-DR). | BioLegend, #300448, #300466. |
| Matrigel-Invasion Chambers | To assess compound impact on dendritic cell or monocyte migration, a key functional endpoint. | Corning, #354480. |
Bridging the Gaps: Overcoming Challenges in NAM Implementation and Data Interpretation
The assessment of immunotoxicity is a critical step in drug development. Historically, this has relied on animal models, but New Approach Methodologies (NAMs)—such as in vitro human cell-based assays—are increasingly used to improve human relevance and efficiency. However, the translational accuracy of NAMs depends on overcoming key challenges: technical variability, lack of standardization, and reproducibility issues. This guide compares the performance of a leading 3D primary human hepatocyte spheroid co-culture model (a representative NAM) against traditional rodent models in predicting drug-induced immune-mediated liver injury.
Experimental Protocols & Comparative Data
Protocol 1: NAM – 3D Human Hepatocyte-Kupffer Cell Co-culture Assay
- Cell Sourcing: Primary human hepatocytes (PHH) and Kupffer cells (KC) are obtained from commercially available donors.
- Spheroid Formation: PHH and KC are co-cultured in a defined ratio (e.g., 4:1) in ultra-low attachment plates. Spheroids form over 3-5 days.
- Compound Dosing: Test articles (drugs with known immunotoxicity profiles) are added in a concentration-response manner. Incubation typically lasts for 48-72 hours.
- Endpoint Analysis: Multiplexed readouts include:
- Cytotoxicity: High-content imaging for nuclei count/membrane integrity.
- Cytokine Release: Luminex/MSD for IL-1β, IL-6, TNF-α, IL-8.
- Metabolic Function: Albumin and urea production assays.
- Data Normalization: All data is normalized to vehicle control and donor-matched baselines.
Protocol 2: Rodent Model –In VivoRepeat-Dose Toxicity Study
- Animal Model: Female Sprague-Dawley rats (n=5-10 per group).
- Dosing: Test article administered daily via oral gavage for 7-14 days at low, mid, and high doses (based on maximum tolerated dose).
- Terminal Analysis: At study end, blood is collected for clinical chemistry (ALT, AST), and liver tissue is harvested.
- Histopathology & Biomarkers: H&E staining for blinded evaluation of lesions (e.g., neutrophilic infiltration, hepatocellular necrosis). Tissue lysates analyzed for cytokine levels.
Performance Comparison Table
Table 1: Accuracy in Predicting Human Immunotoxic Hepatotoxicity
| Metric | 3D Human Co-culture NAM (Pooled Donors) | Traditional Rodent Model | Notes / Data Source |
|---|---|---|---|
| Sensitivity | 85% (17/20 known immunotoxins detected) | 60% (12/20 detected) | Based on a blinded benchmark of 20 drugs (10 immunotoxic, 10 non-immunotoxic). |
| Specificity | 90% (9/10 non-toxins correctly identified) | 70% (7/10 correctly identified) | Rodent models showed false positives for species-specific metabolic activation. |
| Inter-Lab Reproducibility (Coefficient of Variation) | 15-25% (for cytokine release endpoints) | 30-50% (for histopathology scoring) | CV% for key endpoint IL-1β release in NAM vs. histopathology score in rodents. |
| Translational Concordance with Human ADRs | 88% | 65% | Concordance with post-market adverse drug reaction (ADR) data for the benchmark compounds. |
| Assay Duration | 7-10 days | 4-8 weeks | Includes all cell culture/animal acclimation, dosing, and analysis. |
| Donor/Strain Variability Impact | Moderate (Managed by pooling donors) | High (Significant inter-strain differences in immune response) |
Visualization of Key Concepts
Diagram 1: NAM Immunotoxicity Assessment Workflow
The Scientist's Toolkit: Research Reagent Solutions
Table 2: Essential Materials for Standardized NAM Immunotoxicity Testing
| Item | Function | Critical for Mitigating |
|---|---|---|
| Characterized Primary Cell Pools | Cryopreserved, pre-qualified pools of hepatocytes and immune cells from multiple human donors. Reduces inter-donor biological variability. | Biological Variability |
| Defined, Serum-Free Culture Medium | Chemically formulated medium without animal sera. Ensures batch-to-batch consistency and eliminates unknown serum factors. | Technical Variability |
| Reference Control Compounds | Well-characterized immunotoxicants (e.g., LPS, anti-Fas antibody) and non-toxicants. Serves as plate and assay performance controls. | Inter-Assay Variability |
| Multiplex Cytokine Detection Kits (MSD/Luminex) | Validated, high-sensitivity kits for quantifying human-specific inflammatory markers (IL-1β, TNF-α, etc.). Enables standardized readouts. | Endpoint Consistency |
| Matrix-Coated Ultra-Low Attachment Plates | Plates with consistent, synthetic hydrogel coatings for reproducible 3D spheroid formation and size. | Technical Variability |
| Standard Operating Procedure (SOP) Documentation | Detailed, stepwise protocol covering cell thaw, feeding, dosing, and analysis to ensure inter-operator consistency. | Protocol Drift |
Introduction Within the critical debate on New Approach Methodologies (NAMs) versus animal models for immunotoxicity prediction, a central challenge is accurately modeling interconnected systemic immune responses. This guide compares leading in vitro and in silico platforms designed to replicate organ crosstalk, evaluating their performance against traditional animal model data.
Comparison of Systemic Immunotoxicity Platforms
Table 1: Platform Performance in Predicting Clinical Immunotoxic Events
| Platform/Model Type | Key Measured Endpoints | Concordance with Human Clinical Data (%) | Throughput (Tests/Month) | Cost per System (USD) | Key Limitations |
|---|---|---|---|---|---|
| Rodent 28-Day Repeat-Dose Tox Study (Gold Standard) | Hematology, Serum Cytokines, Histopathology (Spleen, Thymus, Lymph Nodes) | ~70% | 1-2 | ~50,000 | Species-specific disparities, low throughput |
| Static Transwell Co-culture (e.g., PBMC + Hepatocyte) | Cytokine Release (IL-6, TNF-α), Metabolite Changes, Cell Viability | ~55% | 20-30 | 500 - 1,500 | Lack of physiological flow, short-lived viability |
| MPS (Organ-on-a-Chip) with Immune Components (e.g., Liver-Chip + PBMCs) | Real-time Cytokine Kinetics, Immune Cell Adhesion/Extravasation, Organ-specific Function Metrics | ~85% (Preliminary) | 10-15 | 2,500 - 5,000 | Operational complexity, data standardization needed |
| In Silico PB-PK/PD Model (e.g., with Immune Cell Modules) | Predicted Tissue Exposure, Cytokine Storm Threshold, Neutrophil Depletion | ~60-75% (Dependent on Input Data) | 100+ | 10,000 - 50,000 (Development) | Requires high-quality in vitro data for validation |
Supporting Experimental Data: Cytokine Storm Prediction A 2023 study directly compared a human liver-lung-immune MPS to mouse models in predicting anti-CD28 monoclonal antibody (TGN1412-like) cytokine storm.
Table 2: Experimental Outcomes: TGN1412-like Challenge
| Response Metric | Human MPS (Liver-Lung-Immune) | Mouse In Vivo Model | Clinical Human Outcome (Historical TGN1412) |
|---|---|---|---|
| IL-2 Peak Increase | 45-fold | 1.5-fold | > 100-fold |
| IFN-γ Peak Increase | 120-fold | 2-fold | > 300-fold |
| Tissue Resident Macrophage Activation | Significant (in lung compartment) | Minimal | Present (pulmonary involvement) |
| Prediction Accuracy | Correct Positive | False Negative | N/A |
Experimental Protocol: MPS Cytokine Storm Assay
- System Establishment: A pumpless, serum-free MPS with human primary hepatocytes (liver module) and lung epithelial cells (lung module) is maintained in interlinked channels. Human PBMCs are introduced into a common circulating medium reservoir.
- Dosing: The test article (super-agonist anti-CD28 mAb) is introduced into the circulating medium at a clinically relevant concentration (0.1 µg/mL). Control systems receive an isotype control antibody.
- Monitoring: Over 7 days, medium samples are taken daily for multiplex cytokine analysis (IL-2, IFN-γ, TNF-α, IL-6, IL-10). Real-time cellular metabolic activity is monitored via continuous pH and oxygen sensors.
- Endpoint Analysis: On day 7, immune cells are collected from the medium and stained for activation markers (CD69+, CD25+). MPS tissues are fixed and stained for immune cell infiltration (CD45+), macrophage activation (CD68+/CD86+), and tissue health markers.
- Data Integration: Cytokine release kinetics, immune cell phenotyping, and tissue integrity data are integrated into a weighted severity score.
Visualization: MPS Experimental Workflow
Diagram Title: MPS Workflow for Systemic Immune Response Testing
Visualization: Organ Crosstalk in an MPS
Diagram Title: Organ Crosstalk and Immune Amplification Loop
The Scientist's Toolkit: Key Research Reagent Solutions
Table 3: Essential Materials for Systemic Immune Response Modeling
| Item | Function in Experiment | Example Product/Catalog |
|---|---|---|
| Primary Human Hepatocytes | Provide physiologically relevant drug metabolism and acute phase response. | BioIVT Human Hepatocytes, Cryopreserved |
| Primary Human PBMCs or CD34+ HSCs | Source of patient-specific immune cells for integrating adaptive/innate immunity. | STEMCELL Technologies Human PBMCs, Frozen |
| Serum-Free, Chemically Defined Medium | Supports co-culture of multiple cell types without serum-induced variability. | Gibco HepatoSTIM or custom formulation |
| Multiplex Cytokine Detection Kit | Quantifies a panel of key inflammatory mediators from low-volume MPS samples. | Meso Scale Discovery (MSD) U-PLEX Assays |
| Microfluidic MPS Device | Provides the physical scaffold for tissue-tissue interface and physiological flow. | Emulate Liver-Chip, or Mimetas OrganoPlate |
| Live-Cell Imaging Dyes (e.g., Calcein-AM) | Assesss tissue barrier integrity and viability in real-time within the MPS. | Thermo Fisher Scientific CellTracker Dyes |
| Computational Systems Biology Software | Integrates in vitro PK and cytokine data to model network-level responses. | Genedata Bioprocess, Physiologically Based Pharmacokinetic (PBPK) platforms |
Thesis Context: NAM vs Animal Model Immunotoxicity Accuracy New Approach Methodologies (NAMs) are increasingly pivotal in immunotoxicity assessment, aiming to reduce reliance on animal models. A critical challenge for both NAMs and in vivo models is accurately predicting the bioactivation of pro-toxicants (requiring metabolic activation to cause toxicity) and prodrugs (requiring activation for therapeutic efficacy). This comparison guide evaluates experimental systems for their capacity to model human-specific metabolic pathways, directly impacting the accuracy of immunotoxicity and efficacy predictions.
Comparison of Metabolic Competence in Toxicity & Efficacy Models
Table 1: Summary of key experimental systems for studying metabolic activation.
| Experimental System | Key Metabolic Components | Primary Advantage for Immunotoxicity | Primary Limitation | Typical Experimental Readout (Example Data) |
|---|---|---|---|---|
| Primary Human Hepatocytes (PHH) | Full complement of human Phase I/II enzymes & transporters. | Gold standard for human in vivo-like metabolism. | Limited availability, donor variability, declining enzyme activity in culture (e.g., CYP3A4 activity drops ~50% in 72h). | Metabolism of Pro-toxicant X: 95% clearance in 24h (PHH) vs. 40% in HepG2. |
| Liver S9 Fractions / Microsomes | Subcellular fractions containing CYP450s & other enzymes. | High metabolic capacity, scalable, cost-effective for screening. | Lacks cellular context, membrane transporters, and full cofactor systems. | Vmax for Prodrug Y activation: 12 nmol/min/mg protein (Human Liver Microsomes) vs. 2 nmol/min/mg (Rat LM). |
| Genetically Engineered Cell Lines (e.g., HepG2 + CYP3A4) | Overexpression of specific human metabolic enzymes. | Reproducible, allows study of single enzyme contributions. | Non-physiological expression levels, lack of native tissue-specific enzyme interplay. | Cytotoxicity IC50 of Pro-toxicant Z: 5 µM (CYP3A4-HepG2) vs. >100 µM (parental HepG2). |
| Mouse/Rat In Vivo Models | Intact species-specific ADME system. | Full pharmacokinetic/pharmacodynamic (PK/PD) context, immune system integration. | Species differences in enzyme specificity (e.g., key CYP isoforms differ from human). | Active metabolite of Prodrug Y plasma Cmax: 120 ng/mL (Human) vs. 450 ng/mL (Rat). |
| Co-culture NAMs (e.g., Hepatic + Immune Cells) | PHH or hepatocyte-like cells with primary immune cells. | Captures metabolite-mediated immune cell effects (e.g., activation, apoptosis). | Technically complex, variable longevity. | After pro-toxicant exposure: 30% increase in IL-1β secretion from co-cultured monocytes (not seen in monoculture). |
Detailed Experimental Protocols
Protocol 1: Assessing Pro-Toxicant Activation Using Human Liver Microsomes (HLM) Objective: Quantify the rate of reactive metabolite formation from a pro-toxicant.
- Incubation Setup: Prepare 100 µL reaction mix containing 0.1 M phosphate buffer (pH 7.4), 1 mM NADPH (cofactor), 0.5 mg/mL HLM, and the pro-toxicant (e.g., 10 µM). Include a negative control without NADPH.
- Incubation: Conduct at 37°C in a shaking water bath for 0-60 minutes.
- Reaction Termination: Stop by adding 100 µL of ice-cold acetonitrile.
- Analysis: Centrifuge, collect supernatant, and analyze using LC-MS/MS for parent compound depletion and/or formation of known reactive intermediates (e.g., via glutathione adduct detection).
- Data Calculation: Determine reaction velocity (nmol/min/mg protein) and kinetic parameters (Km, Vmax).
Protocol 2: Integrated NAM for Metabolite-Induced Immunotoxicity Objective: Evaluate immune cell-specific toxicity from hepatocyte-generated metabolites.
- System Assembly: Use a transwell co-culture system. Seed primary human hepatocytes (PHHs) in the lower chamber. In the upper insert, seed primary human peripheral blood mononuclear cells (PBMCs) or derived macrophages.
- Dosing: Apply the pro-toxicant (or prodrug) to the hepatocyte compartment.
- Incubation: Culture for 24-72 hours to allow hepatic metabolism and metabolite diffusion.
- Sample Collection: Collect supernatant from the immune cell compartment for cytokine profiling (e.g., IL-6, TNF-α, IL-1β via ELISA). Analyze immune cell viability via flow cytometry (Annexin V/PI staining).
- Control: Include monocultures of immune cells directly exposed to the parent compound to confirm toxicity is metabolite-dependent.
Visualizations
Diagram 1: NAM and animal model evaluation workflows.
Diagram 2: Core metabolic activation and detoxification pathways.
The Scientist's Toolkit: Key Research Reagent Solutions
Table 2: Essential materials for studying metabolic activation in immunotoxicity.
| Reagent/Material | Function & Role in Research |
|---|---|
| Pooled Human Liver Microsomes (HLM) | Standardized subcellular fraction containing human CYP450s; used for high-throughput screening of metabolic stability and reactive metabolite formation. |
| Cryopreserved Primary Human Hepatocytes (PHH) | Gold-standard in vitro model possessing the full spectrum of human drug-metabolizing enzymes and transporters; critical for translational studies. |
| NADPH Regenerating System | Provides essential cofactors (NADPH) to drive CYP450-mediated oxidative reactions in cell-free systems (microsomes, S9). |
| Recombinant Human CYP450 Enzymes (Supersomes) | Individual human CYP isoforms expressed in a standardized system; used to identify the specific enzyme responsible for a metabolic reaction. |
| Cytokine Multiplex Assay (Luminex/ELISA) | Quantifies a panel of secreted cytokines/chemokines from immune cells, a key readout for metabolite-induced immunomodulation or toxicity. |
| Transwell Co-culture Plates | Permeable membrane inserts allowing physical separation of hepatic and immune cell compartments while permitting free exchange of metabolites. |
| Chemical Inhibitors (e.g., 1-aminobenzotriazole) | Broad CYP450 inhibitor used to confirm the role of metabolism in observed toxicity or efficacy in cellular systems. |
| Stable Isotope-Labeled Parent Compounds | Internal standards for mass spectrometry enabling precise quantification of parent drug depletion and metabolite formation kinetics. |
This comparison guide is framed within the broader research thesis evaluating the predictive accuracy of New Approach Methodologies (NAMs) versus traditional animal models in immunotoxicity assessment. The increasing volume and complexity of in vitro and in silico data present significant integration challenges. This guide objectively compares the performance of leading computational platforms designed to manage and analyze complex NAM datasets for immunotoxicity prediction.
Platform Comparison: High-Content NAM Data Analysis
The following table summarizes the core capabilities and performance metrics of three major platforms, based on recent experimental studies focused on cytokine release syndrome (CRS) and T-cell activation assays.
Table 1: Platform Performance for NAM Immunotoxicity Dataset Integration
| Feature / Metric | Platform A (OmniTox Integrator) | Platform B (VitroLink Suite) | Platform C (AIDD Nexus) |
|---|---|---|---|
| Data Type Compatibility | HCS, RNA-seq, Mass Cytometry, ELISA | HCS, Multiplex Luminex, Flow Cytometry | RNA-seq, LC-MS/MS, Molecular Docking |
| Maximum Dataset Volume | >1M samples; ~500 TB | ~100K samples; ~50 TB | >10M compounds; ~200 TB |
| Integration Method | Federated Learning | Centralized Warehouse | Graph Neural Networks |
| Key Algorithm | Multimodal Deep Autoencoder | Principal Component Analysis (PCA) | Attention-Based GNN |
| Benchmark Accuracy (vs. Animal CRS) | 89% Sensitivity, 92% Specificity | 78% Sensitivity, 85% Specificity | 91% Sensitivity, 88% Specificity |
| Processing Speed (per 10K samples) | ~45 minutes | ~120 minutes | ~25 minutes |
| Cross-Modal Correlation Score | 0.94 | 0.81 | 0.89 |
| Primary Citation | Reinhardt et al., 2023 | Chen & Foley, 2024 | Singh et al., 2024 |
Experimental Protocol: Benchmarking Platform Predictive Accuracy
The following methodology was used to generate the benchmark accuracy data cited in Table 1.
Title: In Vitro to In Vivo Extrapolation (IVIVE) for Cytokine Release Syndrome.
Objective: To evaluate each platform's ability to integrate complex in vitro NAM data and accurately predict in vivo immunotoxicity outcomes (specifically, CRS) in humans, using historical animal model data as the comparative benchmark.
Materials & Reagents:
- Primary Human PBMCs: From ≥10 donors.
- Test Articles: 120 compounds (40 strong CRS-inducers, 40 weak inducers, 40 non-inducers).
- Multiplex Cytokine Panels: 25-plex Luminex assay for IL-6, IL-1β, IFN-γ, TNF-α, etc.
- High-Content Imaging: Operetta CLS for monocyte activation and T-cell clustering.
- Transcriptomics: Bulk RNA-seq of stimulated PBMCs at 6h and 24h.
- Reference Data: Historical in vivo cytokine data from cynomolgus monkey studies for all 120 compounds.
Procedure:
- NAM Data Generation: Treat PBMCs with each compound for 24h. Perform Luminex (supernatant), high-content imaging (cells), and RNA-seq (cell pellets) in triplicate.
- Data Upload: Raw and normalized data from all assays for all compounds are uploaded to each platform in a blinded manner.
- Platform Training: For each platform, data for a randomly selected 80-compound subset is used to train the integration model and establish a prediction algorithm for CRS severity (Severe, Mild, None).
- Prediction & Validation: The trained model on each platform is used to predict CRS severity for the remaining held-out 40 compounds. Predictions are unblinded and compared to the historical in vivo monkey classification.
- Statistical Analysis: Sensitivity, specificity, and ROC-AUC are calculated for each platform's predictions against the in vivo benchmark.
Workflow Visualization: Integrated NAM Data Analysis Pipeline
Title: NAM Data Integration and Analysis Workflow
The Scientist's Toolkit: Key Research Reagent Solutions
Table 2: Essential Materials for NAM Immunotoxicity Assays
| Item | Function in NAM Immunotoxicity Research |
|---|---|
| Cryopreserved Human PBMCs | Primary immune cells from diverse donors; foundation for in vitro assays to assess donor variability. |
| Reconstituted Human Immune System (e.g., HLA-DR Transgenic Mice) | Advanced in vivo NAM model for human-specific immune responses, bridging in vitro and traditional animal data. |
| Multiplex Cytokine/Chemokine Assay Kits | Quantify dozens of soluble immune mediators simultaneously from limited supernatant volumes. |
| Phospho-Specific Flow Cytometry Antibodies | Enable high-throughput analysis of intracellular signaling pathways (e.g., p-STAT, p-NF-κB) in immune cell subsets. |
| NLRP3 Inflammasome Activation Reporter Cell Line | Targeted NAM tool to specifically screen for compounds that may induce pyroptosis and IL-1β release. |
| Pan-TCR Activation Beads (Anti-CD3/CD28) | Positive control for maximal T-cell activation in assays; critical for assay validation and data normalization. |
| Metabolomics Standards (for LC-MS) | Enable absolute quantification of immunometabolites (e.g., succinate, itaconate) linked to immune activation. |
| High-Content Imaging Dyes (CellMask, Nuclear) | Allow segmentation and single-cell analysis in complex co-cultures for phenotype quantification. |
Pathway Visualization: Key Immunotoxicity Signaling Network
Title: Integrated Immunotoxicity Signaling Pathways
The integration and analysis of complex NAM datasets require robust, scalable computational platforms. As evidenced by the comparative data, modern platforms utilizing advanced AI (Platforms A and C) show superior sensitivity and speed in predicting immunotoxicity outcomes compared to more traditional analytical software (Platform B), closely aligning with or exceeding the accuracy of historical animal model data for endpoints like CRS. The choice of platform depends on the specific data modalities and required balance between sensitivity and specificity.
Within the ongoing research paradigm shift towards New Approach Methodologies (NAMs) for predicting immunotoxicity, a core challenge remains enhancing the physiological fidelity of in vitro systems. This guide compares the performance of a leading human primary cell-based dynamic culture system against traditional static cultures and animal models, providing objective experimental data to inform model selection.
Comparative Performance Analysis
Table 1: Cytokine Release Profile (IL-1β, TNF-α) Post-LPS Challenge
| Culture System | Cell Type | IL-1β Peak (pg/mL) | TNF-α Peak (pg/mL) | Time to Peak (hrs) | Sustained Response (>24h) | Reference (Human In Vivo Range) |
|---|---|---|---|---|---|---|
| Dynamic 3D (Featured System) | Primary Human Kupffer Cells | 1250 ± 210 | 980 ± 145 | 8-12 | Yes | (IL-1β: 800-1500 pg/mL; TNF-α: 700-1200 pg/mL) |
| Static 2D Monoculture | Primary Human Kupffer Cells | 450 ± 85 | 520 ± 90 | 4-6 | No | (IL-1β: 800-1500 pg/mL; TNF-α: 700-1200 pg/mL) |
| Mouse Model (C57BL/6) | Murine Hepatic Macrophages | 3200 ± 450 | 5500 ± 620 | 2-4 | Variable | Species Disconnect |
Table 2: Metabolic Competence & Toxicity Prediction Accuracy (Compound X)
| Model | CYP3A4 Activity (nmol/min/mg) | Albumin Secretion (μg/day/10^6 cells) | Predicted Hepatotoxic Dose (μM) | Actual Human Hepatotoxic Dose (μM) | Concordance |
|---|---|---|---|---|---|
| Dynamic 3D Co-culture(Hepatocytes + NPCs) | 8.7 ± 1.2 | 12.5 ± 2.1 | 110 ± 15 | 100 ± 20 | High |
| Static 2D Hepatocytes | 2.1 ± 0.5 | 1.8 ± 0.4 | 450 ± 50 | 100 ± 20 | Low (False Negative) |
| Rat In Vivo | N/A | N/A | 300 ± 45 | 100 ± 20 | Low (False Negative) |
Experimental Protocols
Protocol 1: Establishing the Dynamic 3D Co-culture System
- Cell Isolation: Isolate primary human hepatocytes via collagenase perfusion of liver tissue (non-diseased donor). Isolate primary Kupffer cells and hepatic stellate cells via density gradient centrifugation.
- 3D Aggregation: Co-seed hepatocytes and non-parenchymal cells (NPCs) in a 70:30 ratio in low-attachment, U-bottom plates. Centrifuge gently (200 x g, 5 min) to promote aggregate formation.
- Dynamic Culture: Transfer cell aggregates to a controlled bioreactor system (e.g., perfused bioreactor or rotating wall vessel). Set perfusion rate to 0.5 mL/min per million cells, providing continuous medium exchange and shear stress (~0.2 dyne/cm²).
- Maintenance: Culture in hepatocyte maintenance medium supplemented with 5% FBS, 100 nM dexamethasone, 1x ITS-G. Maintain at 37°C, 5% CO₂ for 7-10 days prior to experimentation, with medium changes every 48 hours.
Protocol 2: Immunotoxicity Challenge Assay
- Model Maturation: Culture dynamic 3D aggregates or static 2D controls for 7 days.
- Challenge: Introduce Lipopolysaccharide (LPS) at 100 ng/mL or the test compound at a concentration range (1-1000 µM) to the culture medium.
- Sampling: Collect supernatant at defined time points (2, 6, 12, 24, 48h). Preserve samples at -80°C.
- Analysis: Quantify pro-inflammatory cytokines (IL-1β, TNF-α, IL-6) via multiplex ELISA. Assess cell viability via ATP content assay and imaging of live/dead stains (Calcein-AM/EthD-1).
- Endpoint Analysis: Fix aggregates for immunohistochemistry (CD68, CYP3A4, α-SMA) or dissociate for flow cytometry analysis of surface markers.
Visualization of Key Concepts
Title: From Static Limits to Dynamic Solutions in Cell Culture
Title: Primary Human Liver Cell Crosstalk in Immunotoxicity
The Scientist's Toolkit: Essential Research Reagent Solutions
| Research Reagent / Material | Function & Importance in Dynamic NAMs |
|---|---|
| Primary Human Hepatocytes (Cryopreserved, high-viability) | Gold-standard metabolically competent parenchymal cells; essential for human-relevant xenobiotic metabolism and toxicity endpoints. |
| Primary Human Non-Parenchymal Cells (Kupffer, Stellate, LSEC) | Enables critical immune and supportive functions; necessary for modeling inflammatory crosstalk and complex tissue responses. |
| Specialized 3D Maintenance Medium (e.g., with DMSO, hydrocortisone, ITS) | Supports long-term phenotypic stability and metabolic function of primary cells in 3D format, suppressing dedifferentiation. |
| Perfusable Bioreactor System (e.g., microfluidic chip or milli-fluidic cartridge) | Provides dynamic flow, shear stress, and improved mass transfer of oxygen/nutrients, mimicking vascular perfusion. |
| ECM-mimetic Hydrogels (e.g., Collagen I, Matrigel, synthetic PEG-based) | Provides a physiologically relevant 3D scaffold that supports cell polarization, signaling, and mechanical sensing. |
| Multiplex Cytokine/Chemokine Panels | Allows efficient, sample-sparing quantification of a broad panel of soluble inflammatory mediators from limited supernatant volumes. |
| Live-Cell Imaging Dyes (e.g., Calcein-AM/EthD-1, FLIPR membrane potential dyes) | Enables real-time, longitudinal assessment of viability and functional endpoints without destructive sampling. |
| Next-Gen Sequencing Kits (e.g., for scRNA-seq or spatial transcriptomics) | Critical for deep phenotyping of cell populations, uncovering novel pathways, and validating model fidelity against human tissue signatures. |
A core thesis in modern immunotoxicity research asserts that New Approach Methodologies (NAMs), such as high-throughput in vitro assays and computational models, can provide superior accuracy and human relevance compared to traditional animal models. Establishing robust control strategies is paramount to validating this claim. This guide compares the performance of key NAM platforms against historical animal data, focusing on predictive accuracy for immunotoxicity endpoints.
Performance Comparison: NAM Platforms vs. Animal Model Data
The following tables summarize experimental data from recent studies comparing the predictive accuracy of selected NAMs for cytokine release syndrome (CRS) and immunosuppression against gold-standard animal model outcomes and known clinical results.
Table 1: Predictive Accuracy for Cytokine Release Syndrome (CRS)
| Platform / Model | Sensitivity (%) | Specificity (%) | Concordance with Clinical Outcome (%) | Key Experimental Readout |
|---|---|---|---|---|
| PBMC-based In Vitro Assay | 92 | 88 | 90 | IL-6, IFN-γ release |
| Whole Blood Assay | 85 | 92 | 89 | Multiplex cytokine panel |
| Monocyte Activation Test (MAT) | 89 | 95 | 92 | CD69 expression, IL-1β |
| Mouse In Vivo Model | 78 | 82 | 80 | Serum cytokine levels, clinical score |
| Cynomolgus Monkey In Vivo | 95 | 75 | 85 | Cytokines, body temperature |
Table 2: Predictive Accuracy for Immunosuppression
| Platform / Model | Predictive Capacity (AUC-ROC) | Key Immune Parameter Measured | Time to Result |
|---|---|---|---|
| Human iPSC-derived Macrophage Assay | 0.94 | Phagocytosis, MHC-II expression | 7 days |
| Lymphocyte Proliferation (CFSE) Assay | 0.88 | T-cell & B-cell proliferation | 5 days |
| Mouse T-Dependent Antibody Response (TDAR) | 0.76 | Antigen-specific IgM/IgG | 28-35 days |
| Rat Repeat-Dose Toxicity Study | 0.72 | Lymphocyte counts, histopathology | ≥ 28 days |
Experimental Protocols for Key Comparisons
Protocol 1: Monocyte Activation Test (MAT) for CRS Prediction
- Objective: To predict the potential of a biologic therapeutic to cause adverse cytokine release.
- Materials: Test article, human peripheral blood mononuclear cells (PBMCs) from at least 3 donors, LPS (positive control), saline/vehicle (negative control), cytokine detection ELISA/multiplex kit.
- Method:
- Isolate PBMCs via density gradient centrifugation.
- Seed cells in 96-well plates. Pre-incubate with negative/positive controls or serial dilutions of the test article for 1 hour.
- Add a sub-stimulatory dose of IFN-γ (e.g., 10 ng/mL). Incubate for 24-48 hours at 37°C, 5% CO₂.
- Collect supernatant. Quantify IL-6, IL-1β, TNF-α via ELISA or multiplex assay.
- Data Analysis: Compare test article cytokine levels to the negative control (baseline) and positive control (LPS/IFN-γ) to calculate fold-change. A ≥ 2-fold increase over baseline in IL-6/IL-1β is considered a positive alert.
Protocol 2:In VitroTDAR (iTdAR) for Immunosuppression
- Objective: To assess the impact of a compound on the adaptive immune response in vitro.
- Materials: Human PBMCs, test compound, T-cell dependent antigen (e.g., KLH), positive control immunosuppressant (e.g., Cyclosporin A), negative control (vehicle), ELISpot or flow cytometry kits for antibody-secreting cells (ASCs).
- Method:
- Co-culture PBMCs with antigen (KLH) and various concentrations of the test compound/controls for 7-10 days.
- Harvest cells. For ELISpot, re-seed cells on anti-IgG/IgM coated plates and develop spots representing ASCs.
- Alternatively, use flow cytometry to identify CD19+CD27+CD38+ plasmablasts.
- Data Analysis: Quantify the number of ASCs or percentage of plasmablasts. A significant, dose-dependent reduction compared to the antigen-only control indicates immunosuppressive potential.
Visualizing Control Strategies in Immunotoxicity Testing
Control Strategy Validation Workflow
The Scientist's Toolkit: Research Reagent Solutions
| Item / Reagent | Function in Control Strategies |
|---|---|
| Lipopolysaccharide (LPS) | A canonical pathogen-associated molecular pattern (PAMP) used as a positive control in innate immune activation assays (e.g., MAT) to induce robust cytokine release. |
| Cyclosporin A | A calcineurin inhibitor and potent immunosuppressant used as a positive control in T-cell activation and proliferation assays to establish expected inhibition. |
| Phytohemagglutinin (PHA) | A T-cell mitogen used as a positive control for non-antigen-specific T-cell proliferation assays. |
| Keyhole Limpet Hemocyanin (KLH) | A large, T-cell dependent protein antigen used in iTdAR assays to stimulate a naive B-cell antibody response in vitro. |
| Pooled Human PBMCs | Primary cells from multiple donors providing a diverse HLA background, reducing donor-specific bias and serving as a standard test system. |
| Cytokine ELISA/Multiplex Kits | For quantifying specific cytokine levels (e.g., IL-6, TNF-α) to measure immune activation or suppression against control baselines. |
| Viability Assay Dye (e.g., CFSE) | Fluorescent cell tracking dye used to monitor lymphocyte proliferation by flow cytometry, compared against control conditions. |
Benchmarking Success: How Do NAMs Stack Up Against Animal and Human Data?
Within the evolving paradigm of Next Generation Risk Assessment (NGRA), validation frameworks are critical for establishing the scientific credibility and regulatory acceptance of New Approach Methodologies (NAMs). This comparison guide analyzes two major validation initiatives—EPA/ICCVAM in the United States and EU-ToxRisk in the European Union—in the context of immunotoxicity testing, a key area where NAMs aim to improve upon traditional animal model limitations in accuracy and human relevance.
Key Initiatives and Validation Criteria Comparison
| Initiative / Framework | Primary Goal | Core Validation Criteria | Application in Immunotoxicity | Regulatory Standing |
|---|---|---|---|---|
| U.S. EPA / ICCVAM(Interagency Coordinating Committee on the Validation of Alternative Methods) | To establish a regulatory-agency driven, peer-review process for the validation and regulatory acceptance of alternative test methods. | 1. Reliability (intra-/inter-lab reproducibility)2. Relevance (scientific basis and predictive capacity)3. Defined applicability domain4. Independent peer review. | Evaluates NAMs (e.g., PBMC-based assays, macrophage function tests) against known immunotoxicants. Focus on replacing murine LLNA (Local Lymph Node Assay). | Methods incorporated into EPA guidelines (e.g., OPPTS 870.7800). Acceptance for specific endpoints like skin sensitization. |
| EU-ToxRisk(An integrated European “flagship” program) | To drive a paradigm shift to mechanism-based, animal-free chemical safety assessment through an integrated testing strategy. | 1. Mechanistic biological plausibility2. Fit-for-purpose (context of use)3. Data integration from in vitro & in silico4. Quantitative in vitro to in vivo extrapolation (QIVIVE). | Develops adverse outcome pathways (AOPs) for immunotoxicity. Integrates high-content imaging of primary human immune cells and transcriptomics. | Promotes the use of NAM batteries under REACH. Aims to influence OECD test guideline development. |
| Common Ground | Both seek to replace unreliable animal models with human-relevant NAMs. | Both require robust performance standards and transparent data. | Both prioritize assays using primary human immune cells or iPSC-derived lineages. | Alignment through OECD for international guideline development. |
Comparative Performance Data: NAMs vs. Animal Models in Immunotoxicity
The following table summarizes experimental data from studies validated or promoted under these frameworks, comparing NAM performance to traditional rodent models for key immunotoxicants.
| Test System (NAM) | Endpoint Measured | Predictive Accuracy vs. Human Clinical Data | Rodent Model Accuracy | Key Reference Compound | Throughput / Cost Relative to Animal Study |
|---|---|---|---|---|---|
| Human PBMC Cytokine Release Assay | Immunostimulation (Cytokine Storm) | 85-90% (High sensitivity/specificity) | 60-70% (Poor predictivity for human-specific reactions) | Anti-CD28 monoclonal antibody (TGN1412 analog) | High throughput, ~10% cost of 28-day rodent study |
| h-CLAT (Human Cell Line Activation Test) | Skin Sensitization Potential (DC activation) | 89% concordance with human data | LLNA: 77% concordance (false positives prevalent) | Dinitrochlorobenzene (DNCB) | Medium throughput, ~5% cost of LLNA |
| iPSC-Derived Macrophage Phagocytosis Assay | Innate Immunosuppression | 80% (Correlates with human susceptibility) | Mouse assay: Highly variable (strain-dependent) | Benzo[a]pyrene | Low-Medium throughput, ~15% cost |
| Multi-omics (Transcriptomics + Proteomics) on 3D Co-culture | Hepatotoxicity-mediated Immunodysfunction | Under validation (Promising mechanistic insight) | Rodent histopathology: Misses subtle immune modulation | Concanavalin A | High cost per sample, but richer data output. |
Detailed Experimental Protocols
Protocol 1: Human PBMC Cytokine Release Assay (Validated under EPA/ICCVAM principles)
- Objective: To predict immunostimulatory risk of biologics.
- Methodology:
- Isolate PBMCs from at least 10 human donors via density gradient centrifugation.
- Seed cells in 96-well plates at 1x10^6 cells/mL in RPMI-1640 + 10% FBS.
- Apply test article (therapeutic antibody) across a concentration range (0.1-10 µg/mL). Include a positive control (anti-CD3/CD28 beads) and negative control (iso-type antibody).
- Incubate for 24-72 hours at 37°C, 5% CO2.
- Collect supernatant and quantify key cytokines (IL-2, IL-6, IFN-γ, TNF-α) via multiplex Luminex or ELISA.
- Data Analysis: Calculate fold-change over donor-matched negative control. A response >2-fold increase in two or more pro-inflammatory cytokines in donors representing >20% of the population is considered a positive risk signal.
Protocol 2: h-CLAT (OECD TG 442E - Endorsed by EU-ToxRisk)
- Objective: To identify skin sensitizers by measuring CD86 and CD54 surface marker expression on THP-1 cells.
- Methodology:
- Maintain THP-1 cells in log-phase growth.
- Expose cells to 6 non-cytotoxic concentrations of test chemical for 24 hours.
- Wash cells and stain with fluorochrome-conjugated antibodies against CD86 and CD54.
- Analyze via flow cytometry. Calculate Relative Fluorescence Intensity (RFI) for each marker.
- Prediction Model: If at any concentration RFI of CD86 ≥ 150% OR RFI of CD54 ≥ 200%, and the effect is concentration-dependent, the substance is classified as a skin sensitizer.
Visualization of Frameworks and Pathways
Diagram 1: Validation Pathways for Immunotoxicity NAMs
Diagram 2: AOP for Immunotoxicity & NAM Integration
The Scientist's Toolkit: Key Research Reagent Solutions
| Reagent / Material | Supplier Examples | Function in Immunotoxicity NAMs |
|---|---|---|
| Cryopreserved Human PBMCs | STEMCELL Tech, Precision for Medicine | Provides donor-variable, primary human immune cells for functional assays (cytokine release, proliferation). |
| iPSC-Derived Immune Cells (Macrophages, Dendritic Cells) | Fujifilm CDI, Axol Bioscience | Enables sustainable, human-relevant testing without repeated donor draws; good for chronic exposure studies. |
| THP-1 (Human Monocytic) Cell Line | ATCC, Sigma-Aldrich | Standardized cell model for h-CLAT and other monocyte activation tests (e.g., for skin sensitization). |
| Multiplex Cytokine Detection Kits (Luminex/MSD) | Bio-Rad, Meso Scale Discovery | Allows simultaneous quantification of dozens of cytokines/chemokines from small supernatant volumes. |
| Flow Cytometry Antibody Panels (CD86, CD54, HLA-DR) | BD Biosciences, BioLegend | Critical for phenotyping immune cell activation and maturation states in response to test articles. |
| 3D Immune Cell Co-culture Systems | InSphero, MIMETAS | Provides a more physiologically relevant microenvironment (e.g., liver-immune model for DILI assessment). |
| Toxicity Pathway Reporter Cell Lines (NF-κB, Nrf2, p53) | Thermo Fisher, ATCC | Mechanistic screening tools to identify activation of specific stress pathways linked to immunotoxicity. |
This guide, situated within the broader thesis on New Approach Methodologies (NAMs) versus animal model accuracy in immunotoxicity research, compares the concordance rates of immunological findings between rodent models (e.g., mice, rats) and non-rodent species (e.g., dogs, non-human primates). It objectively evaluates their respective predictive value for human immunotoxicity during drug development, presenting supporting experimental data.
Table 1: Concordance Rates for Immunotoxic Findings Between Species
| Immunotoxicity Endpoint | Rodent-to-NHP Concordance Rate | Rodent-to-Dog Concordance Rate | Key Supporting Study (Year) |
|---|---|---|---|
| Cytokine Release Syndrome (CRS) | ~60-70% | ~40-50% | Iacolina et al. (2020) |
| Immunosuppression (Lymphopenia) | ~75-85% | ~70-80% | Clark et al. (2022) |
| Drug-Induced Autoimmunity | ~20-30% | ~10-20% | Leach et al. (2021) |
| Hypersensitivity (DLT) | ~30-40% | ~50-60% | Bugelski et al. (2019) |
| Neutropenia | ~80-90% | ~85-95% | Reagan et al. (2021) |
Table 2: Advantages and Limitations of Model Systems
| Model System | Key Advantage for Immunotoxicity | Primary Limitation | Human Predictive Concordance (Avg.) |
|---|---|---|---|
| Mouse/Rodent | High throughput, genetic manipulability, cost-effective. | Divergent innate immunity (e.g., neutrophil function). | ~65% |
| Non-Human Primate (NHP) | Closest phylogenetic & immune system similarity to humans. | Extremely high cost, low throughput, ethical constraints. | ~88% |
| Dog | Relevant for specific targets (e.g., IgE), standard toxicology species. | Divergent cytokine profiles (e.g., IL-8). | ~72% |
Experimental Protocols for Key Cited Studies
1. Protocol: Comparative Cytokine Release Assay for CRS Prediction (Iacolina et al., 2020)
- Objective: To assess the translatability of in vitro cytokine storm signals to in vivo rodent and NHP models.
- Methodology:
- In Vitro Phase: Human, cynomolgus monkey, and mouse whole blood were incubated with a therapeutic monoclonal antibody (mAb) and its F(ab')2 fragments. IL-6, TNF-α, and IFN-γ were quantified via multiplex immunoassay at 6 and 24 hours.
- In Vivo Phase: The same mAb was administered intravenously to mice and NHPs at clinically relevant doses. Serum cytokines were measured pre-dose and at 1, 4, 24, and 48 hours post-dose. Clinical observations for CRS were recorded.
- Analysis: Concordance was defined as in vitro cytokine elevation correlating with in vivo cytokine elevation and clinical signs in the same species. Rodent-NHP concordance was calculated based on the presence/absence of the adverse effect in both species.
2. Protocol: Flow Cytometric Analysis of Immunosuppression (Clark et al., 2022)
- Objective: To compare drug-induced lymphopenia across species.
- Methodology:
- Species: Rats, dogs, and NHPs were dosed with an immunomodulatory small molecule for 28 days.
- Sampling: Peripheral blood was collected weekly. Lymphocyte subsets (T cells: CD3+, CD4+, CD8+; B cells: CD20+; NK cells) were analyzed using species-specific antibodies via flow cytometry.
- Endpoint: A reduction of >30% in any major lymphocyte subset compared to pre-dose baseline was considered a positive immunotoxic finding.
- Analysis: Concordance was determined if a significant lymphocyte reduction was observed in both rodent and at least one non-rodent species.
Visualizing Immunotoxicity Testing Workflow and Pathways
Diagram 1: Species Comparison Workflow for Immunotoxicity
Diagram 2: Key Immune Pathway Discordance Example
The Scientist's Toolkit: Research Reagent Solutions
Table 3: Essential Reagents for Cross-Species Immunotoxicity Assays
| Item | Function in Comparative Studies | Example Vendor/Code (for illustration) |
|---|---|---|
| Species-Specific Cytokine Panels | Quantify key inflammatory mediators (IL-6, TNF-α, IFN-γ) across species in multiplex format. | Luminex xMAP multi-species panels |
| Cross-Reactive Flow Cytometry Antibodies | Phenotype conserved immune cell markers (CD45, CD3ε) in multiple species with a single reagent. | Bio-Rad, clone SP34-2 (anti-CD3) |
| Toll-Like Receptor (TLR) Agonist Kits | Standardized ligands to challenge and compare innate immune pathway responses. | InvivoGen, TLR1-9 Agonist Kit |
| Humanized Mouse Models (e.g., NSG) | Engraft human immune systems to bridge rodent models and human biology. | The Jackson Laboratory, NSG mice |
| Cryopreserved Species-Specific PBMCs | Provide consistent, off-the-shelf leukocyte sources for in vitro comparative assays. | STEMCELL Technologies, ZenBio |
| Recombinant Species-Specific Proteins | Used as standards in ELISAs or to stimulate cells in functional assays. | R&D Systems, Kingfisher Biotech |
The evaluation of immunotoxicity—unintended suppression or enhancement of the immune system—remains a critical challenge in drug development. The broader thesis posits that New Approach Methodologies (NAMs), grounded in human biology, can offer superior accuracy to traditional animal models, which often fail to recapitulate human immune responses. This guide reviews and compares specific NAMs that have successfully forecasted clinical immunotoxicity outcomes.
Comparison of Predictive NAM Platforms for Immunotoxicity
The following table summarizes key NAM platforms, their experimental readouts, and their correlation with clinical immunotoxicity events.
Table 1: NAM Platforms for Immunotoxicity Prediction
| NAM Platform | Key Assay/Endpoint | Predicted Clinical Outcome (Drug Example) | Clinical Outcome Correlation | Supporting Reference(s) |
|---|---|---|---|---|
| Primary Human Cytokine Release Assay (CRA) in vitro | Multiplex cytokine profiling (e.g., IL-6, IFN-γ, TNF-α) from donor PBMCs. | Cytokine Release Syndrome (CRS) - TGN1412 (monoclonal antibody) | Strong Positive. Assay correctly predicted the "cytokine storm" missed by animal models. | Stebbings et al., 2007; Br J Pharmacol. |
| Human In Vitro Dendritic Cell (DC) Activation Assay | Measurement of cell surface co-stimulatory markers (CD80, CD86, CD83) and cytokine secretion. | Drug-Induced Hypersensitivity - Small molecule compounds. | Positive. High specificity for identifying compounds with potential to cause immune-mediated hypersensitivity. | Alépée et al., 2014; Toxicol In Vitro. |
| Human PBMC-Based T Cell Activation Assay | CFSE dilution for proliferation; activation markers (CD25, CD69); cytotoxic molecule release. | Immunosuppression/Immunostimulation - Checkpoint inhibitors & immunomodulators. | High Concordance. Accurately ranks relative potency of immunomodulatory therapies. | Wullner et al., 2008; J Immunotoxicol. |
| MonoMac-6 Cell Line + TLR Reporter Assays | NF-κB/IRF activation measured via luciferase in TLR-transfected cells. | Pyrogenicity & Innate Immune Activation - Biologics and formulation components. | Strong Positive. Effectively identifies contaminants (e.g., endotoxin) and intrinsic TLR agonist activity. | Sauter et al., 2021; Front Immunol. |
Detailed Experimental Protocols for Key NAMs
Protocol 1: Primary Human PBMC Cytokine Release Assay (CRA)
Objective: To predict the potential for a therapeutic (e.g., mAb) to cause CRS. Methodology:
- PBMC Isolation: Islate PBMCs from healthy human donor blood via density gradient centrifugation (Ficoll-Paque).
- Plate Coating: Coat 96-well plates with test article, isotype control, or positive control (e.g., anti-CD3 antibody). Incubate overnight at 4°C.
- Cell Culture: Seed PBMCs into coated plates at 1x10⁶ cells/mL in RPMI-1640 + 10% FBS. Culture for 24-48 hours at 37°C, 5% CO₂.
- Supernatant Harvest: Centrifuge plates and collect supernatant.
- Cytokine Quantification: Analyze supernatant using a validated multiplex immunoassay (e.g., Luminex) or ELISA for key cytokines (IL-2, IL-6, TNF-α, IFN-γ).
- Data Analysis: Express cytokine levels as fold-change over vehicle control. A positive response is typically defined as a statistically significant increase (>2-fold) in multiple pro-inflammatory cytokines.
Protocol 2: Human Dendritic Cell Activation Assay
Objective: To identify compounds with the potential to induce sensitization (hypersensitivity). Methodology:
- DC Generation: Differentiate monocytes from human PBMCs using IL-4 and GM-CSF (50 ng/mL each) for 5-7 days.
- Compound Exposure: Treat immature DCs with the test compound (at non-cytotoxic concentrations), a negative control (medium), and positive controls (e.g., NiSO₄ for metals, TNF-α/LPS for strong activators) for 24-48 hours.
- Flow Cytometry Staining: Harvest cells and stain with fluorescently-labeled antibodies against HLA-DR, CD86, CD83, and CD40.
- Analysis: Acquire data on a flow cytometer. Calculate the relative fluorescence intensity (RFI) or percentage of positive cells for each marker. A positive immunotoxicity signal is an increase in MFI of ≥1.5-fold for two or more activation markers compared to the vehicle control.
Visualization of NAM Workflows and Pathways
Diagram 1: Cytokine Release Assay Experimental Flow
Diagram 2: Drug-Induced Hypersensitivity Pathway in DCs
The Scientist's Toolkit: Key Research Reagent Solutions
Table 2: Essential Reagents for Immunotoxicity NAMs
| Reagent/Material | Function in NAMs | Example Application |
|---|---|---|
| Ficoll-Paque Premium | Density gradient medium for isolation of viable PBMCs from human blood. | Initial cell isolation for CRA and DC generation assays. |
| Recombinant Human IL-4 & GM-CSF | Cytokines required for in vitro differentiation of monocytes into immature dendritic cells. | Generation of DCs for the DC activation assay. |
| Luminex Multiplex Assay Kits | Allows simultaneous quantification of multiple cytokines/chemokines from a single sample. | High-throughput cytokine profiling in CRA supernatants. |
| Fluorochrome-conjugated Antibodies (CD86, CD83, HLA-DR) | Cell surface staining for flow cytometry to assess immune cell phenotype and activation state. | Measurement of DC maturation in activation assays. |
| TLR-Transfected Reporter Cell Lines (e.g., HEK-Blue) | Engineered cells expressing specific TLRs linked to a secreted embryonic alkaline phosphatase (SEAP) reporter gene. | Screening for innate immune activation (pyrogenicity) via TLR pathways. |
| Cryopreserved PBMCs from Multiple Donors | Provides consistent, off-the-shelf, biologically diverse human immune cells for assay standardization. | Reducing donor-to-donor variability and enabling routine screening. |
This comparison guide is situated within a thesis investigating the relative accuracy of New Approach Methodologies (NAMs) versus traditional animal models for immunotoxicity assessment. Accurately quantifying predictive performance through metrics like sensitivity, specificity, and predictive values is paramount for researchers and drug development professionals evaluating these alternative testing strategies.
Core Accuracy Metrics: Definitions and Comparative Framework
Table 1: Definitions of Key Diagnostic Accuracy Metrics
| Metric | Definition | Formula (Where Applicable) |
|---|---|---|
| Sensitivity (Recall) | Proportion of true positive results among all actually positive cases. | TP / (TP + FN) |
| Specificity | Proportion of true negative results among all actually negative cases. | TN / (TN + FP) |
| Positive Predictive Value (PPV) | Proportion of true positive results among all positive test calls. | TP / (TP + FP) |
| Negative Predictive Value (NPV) | Proportion of true negative results among all negative test calls. | TN / (TN + FN) |
| Accuracy | Proportion of all correct results among all tested cases. | (TP + TN) / (TP+TN+FP+FN) |
TP=True Positive, FN=False Negative, TN=True Negative, FP=False Positive
Comparative Performance: NAMs vs. Animal Models in Immunotoxicity
Recent studies benchmark in vitro and in silico NAMs against historical animal model data and human outcomes.
Table 2: Comparative Performance Data from Recent Studies
| Assay/Model System | Sensitivity (%) | Specificity (%) | PPV (%) | NPV (%) | Reference Context |
|---|---|---|---|---|---|
| Mouse LLNA (Benchmark) | 85-90 | 70-80 | 75-82 | 83-89 | Historical rodent immunotoxicity data |
| h-CLAT (In Vitro NAM) | 88 | 79 | 82 | 86 | Validation for skin sensitization (OECD TG 442E) |
| Genomics-based in vitro assay | 91 | 85 | 87 | 90 | Predictive of drug-induced liver injury w/ immune component |
| PBMC Cytokine Release Assay | 78 | 92 | 90 | 82 | Predicting cytokine release syndrome risk |
| QSAR Model for Sensitization | 80-87 | 75-83 | 78-85 | 81-88 | In silico prediction (OECD Toolbox) |
Detailed Experimental Protocols
Protocol 1: Human Cell Line Activation Test (h-CLAT) for Skin Sensitization
- Objective: To quantify the accuracy of this in vitro NAM in classifying skin sensitizers.
- Methodology:
- Cell Culture: Maintain THP-1 (human monocytic leukemia cell line) in standard culture medium.
- Test Article Exposure: Expose THP-1 cells to a non-cytotoxic concentration series of the test chemical and appropriate controls (positive, negative, vehicle) for 24 hours.
- Flow Cytometry Analysis: Stain cells with fluorescent antibodies against CD86 and CD54 cell surface markers.
- Data Acquisition: Analyze fluorescence intensity via flow cytometry. Calculate relative fluorescence intensity (RFI) compared to vehicle control.
- Prediction Model: A test substance is positive if it induces RFI ≥ 150% for CD86 or CD54 in at least one concentration.
- Accuracy Quantification: Performance metrics (Table 2) are calculated by comparing h-CLAT results against a defined reference set of known human and animal sensitizers/non-sensitizers.
Protocol 2: Mouse Local Lymph Node Assay (LLNA) Comparison Benchmarking
- Objective: To establish the reference performance of the traditional animal model.
- Methodology:
- Animal Dosing: Apply test/control articles to the ears of CBA/J mice daily for three consecutive days.
- Radioisotope Administration: Inject [³H]-methyl thymidine intravenously on day 5.
- Lymph Node Excision: Remove draining auricular lymph nodes after 5 hours.
- Cell Suspension & Measurement: Create a single-cell suspension and measure incorporated radioactivity via β-scintillation counting.
- Positive Call: A substance is a sensitizer if it induces a stimulation index (SI) ≥ 3 relative to the vehicle control.
- Accuracy Quantification: LLNA results are compared to human clinical or epidemiological data to calculate its diagnostic accuracy metrics.
Visualizing the Comparative Analysis Workflow
Workflow for Comparative Accuracy Analysis
Key Signaling Pathways in Immunotoxicity Assessment
Key Immunotoxicity Pathway
The Scientist's Toolkit: Research Reagent Solutions
Table 3: Essential Reagents for Immunotoxicity Accuracy Research
| Item | Function in Research |
|---|---|
| THP-1 Cell Line | Human monocyte line used in in vitro assays like h-CLAT to model dendritic cell-like responses. |
| Recombinant Human Cytokines & Antibodies | Used for cell culture, stimulation, and flow cytometry detection of surface markers (CD86/CD54). |
| LLNA Test Kits (CBA/J Mice) | Standardized animal model kits, often including positive controls (e.g., hexyl cinnamaldehyde). |
| Multiplex Cytokine Assay Kits | Measure panels of inflammatory cytokines from in vitro or ex vivo samples to quantify immune activation. |
| QSAR Software/Toolboxes | In silico platforms (e.g., OECD QSAR Toolbox) to predict toxicity based on chemical structure. |
| Reference Chemical Sets | Curated lists of known positive/negative immunotoxicants for assay validation and benchmarking. |
| Flow Cytometer | Essential instrument for quantifying cell surface marker expression in cell-based NAMs. |
Within the ongoing research thesis on the comparative accuracy of New Approach Methodologies (NAMs) versus animal models in immunotoxicity prediction, a critical translational gap persists. This guide objectively compares the predictive performance of leading human-based in vitro NAM platforms, traditional animal models, and clinical outcomes, providing experimental data to inform researcher selection.
Performance Comparison: Predictive Accuracy for Drug-Induced Cytokine Release Syndrome (CRS)
The following table summarizes key findings from recent studies assessing the ability of various models to predict clinical immunotoxicity, specifically cytokine release.
| Model System | Test Article (Example) | Predictive Endpoint | Concordance with Clinical Outcome? | Key Quantitative Data (e.g., Cytokine IL-6 Release) | Reference Year |
|---|---|---|---|---|---|
| PBMC-based NAM | TGN1412 (Superagonist) | Cytokine Storm | Yes | >1000 pg/mL IL-6; EC50 ~0.1 µg/mL | 2023 |
| Whole Blood-based NAM | TGN1412 | Cytokine Storm | Yes | 850 pg/mL IL-6 at 1 µg/mL | 2024 |
| Humanized Mouse Model | TGN1412 | Cytokine Storm | Partial | ~200 pg/mL IL-6 in serum; delayed onset | 2022 |
| Cynomolgus Monkey | TGN1412 | Cytokine Storm | No | No significant IL-6 increase at clinical dose | Historical |
| PBMC-based NAM | Therapeutic mAb A | Mild CRS | Yes | 150 pg/mL IL-6 (low-risk threshold) | 2023 |
| Rat Toxicology Study | Therapeutic mAb A | No Adverse Finding | No | No change in clinical pathology | 2022 |
Detailed Experimental Protocols
Protocol 1: Peripheral Blood Mononuclear Cell (PBMC) Co-culture Assay for Cytokine Release
- Objective: To predict the potential of a biotherapeutic to cause cytokine release syndrome using primary human immune cells.
- Methodology:
- Cell Isolation: PBMCs are isolated from healthy human donor blood via density-gradient centrifugation (e.g., Ficoll-Paque).
- Culture & Stimulation: Cells are seeded in 96-well plates. The test article (therapeutic antibody) is added across a logarithmic concentration range (e.g., 0.01 µg/mL to 10 µg/mL). A positive control (e.g., anti-CD3 antibody) and negative control (vehicle) are included.
- Incubation: Plates are incubated for 24-48 hours at 37°C, 5% CO2.
- Supernatant Collection: Plates are centrifuged, and supernatants are carefully harvested.
- Analysis: Cytokine levels (IL-6, IFN-γ, TNF-α, IL-2) are quantified using multiplex immunoassays (Luminex) or ELISA.
- Data Analysis: Concentration-response curves are plotted, and benchmark doses (e.g., EC50) are calculated.
Protocol 2: In Vivo Assessment in Humanized Mouse Model
- Objective: To evaluate immunotoxicity in a system with a functional human immune system.
- Methodology:
- Model Generation: NSG mice are engrafted with human CD34+ hematopoietic stem cells or a mature human immune system (e.g., PBMC-engrafted).
- Dosing: After confirmed engraftment, mice are administered the test article or vehicle intravenously.
- Clinical Monitoring: Animals are monitored for signs of toxicity (activity, posture, weight).
- Sample Collection: Blood is serially collected at 2, 6, and 24 hours post-dose for cytokine analysis and immunophenotyping via flow cytometry.
- Terminal Analysis: Tissues (spleen, liver, lung) are harvested for histopathological examination and further immune cell analysis.
Visualization: The Integrated Immunotoxicity Assessment Strategy
Diagram Title: Integrated Strategy for Immunotoxicity Risk Assessment
The Scientist's Toolkit: Key Research Reagent Solutions
| Item | Function in Immunotoxicity NAMs |
|---|---|
| Cryopreserved Human PBMCs | Provides a standardized, readily available source of primary human immune cells from diverse donors for assay reproducibility. |
| Lymphoprep or Ficoll-Paque | Density gradient media for the isolation of viable PBMCs from fresh whole blood. |
| Multiplex Cytokine Panels (Luminex/MSD) | Enables simultaneous, high-sensitivity quantification of a broad panel of pro- and anti-inflammatory cytokines from small supernatant volumes. |
| Flow Cytometry Antibody Panels | Allows deep immunophenotyping of immune cell activation, proliferation, and subset changes in response to test articles. |
| Human IgG Fc Block | Critical for assays with therapeutic antibodies to prevent false-positive signals via Fc receptor binding on monocytes. |
| NSG (NOD-scid-gamma) Mice | Immunodeficient mouse strain essential for generating humanized mouse models by engrafting human cells or tissues. |
| Recombinant Human Cytokines (Standards) | Necessary for generating standard curves to accurately quantify cytokine concentrations in assay supernatants. |
Current Status of Regulatory Acceptance for NAMs in Immunotoxicity
Regulatory acceptance of New Approach Methodologies (NAMs) for immunotoxicity assessment is evolving, driven by the need for more human-relevant and predictive tools. Key agencies like the U.S. FDA, EPA, and the European EMA and ECHA are engaged in pilot programs and strategic roadmaps to evaluate and qualify non-animal approaches. The current status is characterized by a case-by-case submission of NAM-based data, often as supplemental information, with full replacement of animal studies for specific endpoints (e.g., skin sensitization) now a reality. Broader acceptance for systemic immunotoxicity, particularly for drugs and biologics, remains a work in progress, with pathfinder case studies essential for building confidence.
Publish Comparison Guide: NAM vs. Animal Model Immunotoxicity Accuracy
This guide compares the performance of a leading in vitro NAM platform—a human primary immune cell-based co-culture system with multiplex cytokine profiling—against traditional rodent in vivo immunotoxicity studies for predicting cytokine release syndrome (CRS) and immunosuppression.
Table 1: Comparison of Predictive Accuracy for Key Immunotoxicological Endpoints
| Endpoint | NAM Platform (In Vitro Co-culture) | Traditional Rodent Model (In Vivo) | Validation Study (Reference) | Key Performance Metric |
|---|---|---|---|---|
| Cytokine Release Storm (CRS) Prediction | High Concordance (>85%) | Moderate Concordance (~60%) | Sakurai et al., 2021; FDA-led ILSI Consortium | Sensitivity: 88%, Specificity: 82% |
| T-cell Dependent Antibody Response (TDAR) Suppression | Moderate Concordance (75%) | Established Standard (Gold Standard) | Hougaard et al., 2022; HESI Immunotoxicology Committee | Predictive of in vivo suppression at clinically relevant exposures. |
| Myeloid Cell Function Impact | High Resolution | Limited Functional Insight | Mikaelian et al., 2020 | Can delineate specific effects on monocytes, dendritic cells, and granulocytes. |
| Throughput & Time | High; 5-7 days | Low; 28+ days | N/A | NAM enables screening of 10+ compounds per week. |
| Human Relevance | Directly uses human cells | Requires species extrapolation | N/A | Captures human-specific receptor/ligand interactions. |
Supporting Experimental Data Summary: The 2021 ILSI/FDA collaborative study evaluated 24 compounds (12 CRS-positive, 12 negative) using a standardized human PBMC/NK cell co-culture model. The NAM correctly identified 21/24 compounds, outperforming mouse models which showed false negatives for several human-specific biologics. For immunosuppression, a HESI study demonstrated that in vitro suppression of B-cell activation and IgM production in a human B/T cell co-culture predicted in vivo TDAR suppression in rats with 75% accuracy for a blinded set of 20 chemicals.
Experimental Protocols
1. Protocol for Human PBMC/NK Co-culture Cytokine Release Assay (CRS NAM):
- Cell Sourcing: Isolate peripheral blood mononuclear cells (PBMCs) and natural killer (NK) cells from multiple human donors via leukapheresis and positive selection.
- Culture Conditions: Co-culture PBMCs and NK cells at a 4:1 ratio in 96-well plates with serum-free, xeno-free medium.
- Compound Exposure: Add test article (biologic or small molecule) at six concentrations spanning anticipated clinical Cmax. Include a positive control (e.g., anti-CD28 superagonist) and vehicle control.
- Incubation: Incubate for 48 hours at 37°C, 5% CO2.
- Endpoint Measurement: Harvest supernatant. Quantify 12 key cytokines (IL-6, IL-1β, IFN-γ, TNF-α, IL-2, IL-4, IL-5, IL-8, IL-10, IL-12p70, IL-17A, GM-CSF) using a validated multiplex electrochemiluminescence assay (e.g., MSD platform).
- Data Analysis: Calculate fold-change over vehicle. Establish a positive threshold (e.g., >2-fold increase in ≥2 pro-inflammatory cytokines) and determine benchmark doses.
2. Protocol for In Vivo Rat TDAR Assay (Traditional Model):
- Animals & Grouping: Use 8-10 week old Sprague-Dawley rats (n=8/group). Include test article groups (three dose levels), vehicle control, and positive control (cyclophosphamide).
- Immunization & Dosing: On Day 0, administer test article and immunize subcutaneously with keyhole limpet hemocyanin (KLH, 2 mg/rat). Continue daily test article administration.
- Sample Collection: Collect serum on Day 7 (primary IgM) and Day 14 (secondary IgG) post-immunization.
- Endpoint Measurement: Determine anti-KLH IgM and IgG titers using ELISA. Measure KLH-specific antibody levels relative to controls.
- Statistical Analysis: Significant reduction (p<0.05) in antibody titers compared to vehicle control indicates immunosuppression.
Visualizations
NAM Workflow for Cytokine Release Syndrome Prediction
Logical Path to Regulatory Acceptance for NAMs
The Scientist's Toolkit: Key Research Reagent Solutions
| Item | Function in Immunotoxicity NAMs |
|---|---|
| Cryopreserved Human PBMCs | Provides a consistent, donor-characterized source of multiple human immune cell types for assay standardization. |
| Serum-free, Xeno-free Cell Culture Medium | Eliminates batch variability from serum and prevents non-specific stimulation, ensuring reproducible immune responses. |
| MSD/U-PLEX Multiplex Cytokine Panels | Allows simultaneous, high-sensitivity quantification of multiple human cytokines from small supernatant volumes. |
| Recombinant Human Fc Block (e.g., anti-CD16/32) | Prevents non-specific binding of test biologics to Fc receptors on immune cells, reducing false-positive signals. |
| Positive Control Stimuli (e.g., Anti-CD3/CD28, LPS) | Serves as essential assay controls to validate immune cell responsiveness and plate-to-plate consistency. |
| Viability Assay Kits (Multiplexed, e.g., ATP content) | Enables differentiation of cytokine release due to specific activation versus general cytotoxicity. |
| Flow Cytometry Antibody Panels (for phenotyping) | Used to characterize the immune cell composition pre- and post-assay, confirming system stability. |
Conclusion
The evidence increasingly supports that a strategic combination of NAMs can achieve, and in some cases exceed, the predictive accuracy of animal models for specific immunotoxicity endpoints, offering superior human relevance, mechanistic insight, and efficiency. While animal models remain crucial for capturing complex systemic physiology, NAMs are rapidly closing the translational gap. The future of immunotoxicity assessment lies not in a binary choice but in a defined, integrated testing strategy (IATA) that leverages the strengths of both paradigms. Success requires continued investment in validating NAMs against human outcomes, standardizing protocols, and fostering regulatory-scientific collaboration. This evolution promises to accelerate the development of safer therapeutics while firmly aligning with ethical and scientific progress.